
ABSTRACT
Monocytes are closely associated with tuberculosis (TB). Latent tuberculosis in some patients gradually develops into its active state. This study aimed to investigate the role of hub monocyte-associated genes in distinguishing latent TB infection (LTBI) from active TB. The gene expression profiles of 15 peripheral blood mononuclear cells (PBMCs) samples were downloaded from the gene expression omnibus (GEO) database, GSE54992. The monocyte abundance was high in active TB as evaluated by the Cell-type Identification by Estimating Relative Subsets of RNA Transcripts (CIBERSORT) algorithm. The limma test and correlation analysis documented 165 differentially expressed monocyte-related genes (DEMonRGs) between latent TB and active TB. Functional annotation and enrichment analyses of the DEMonRGs using the database for annotation, visualization, and integration discovery (DAVID) tools showed enrichment of inflammatory response mechanisms and immune-related pathways. A protein-protein interaction network was constructed with a node degree ≥10. The expression levels of these hub DEMonRGs (SERPINA1, FUCA2, and HP) were evaluated and verified using several independent datasets and clinical settings. Finally, a single sample scoring method was used to establish a gene signature for the three DEMonRGs, distinguishing active TB from latent TB. The findings of the present study provide a better understanding of monocyte-related molecular fundamentals in TB progression and contribute to the identification of new potential biomarkers for the diagnosis of active TB.
1. Introduction
Although tuberculosis (TB) infection caused by Mycobacterium can currently be divided into two categories: latent TB and active TB, several stages of Mycobacterium tuberculosis infection have been observed within the human body. The scope of the disease includes people with cleared infection, latent infection, and subclinical or early tuberculosis infections [Citation1]. Unfortunately, both the interferon-gamma release assays (IGRA) and the tuberculin skin test (TST) can neither distinguish latent tuberculosis infection (LTBI) from active TB nor the different stages of Mycobacterium tuberculosis infection and the high-risk groups susceptible to developing the active disease. In addition, these diagnostic tests for LTBI may lead to false-positive or negative results [Citation2]. Although the IGRA has greater specificity than the TST, the response of T cells in the body to mycobacterial antigens persists even after eliminating the bacteria [Citation3]. Therefore, LTBI has a broader scope, including patients with cleared infection and those at high risk of progression to the active tuberculosis stage.
Testing people infected with Mycobacterium tuberculosis is of great significance for the prevention and control of TB. The World Health Organization (WHO) ‘End Tuberculosis Strategy’ recommended that the early diagnosis and treatment of LTBI patients at a higher risk of infection was essential to effectively control TB globally [Citation4]; however, the treatment of latent TB had been associated with potential toxicity and drug-related adverse reactions [Citation5]. Therefore, the development of new, quick, and easy strategies to assist in identifying active and latent tuberculosis is crucial for TB management and control.
Several studies had shown that autoimmunity played a vital role in the development of tuberculosis [Citation6]. Host resistance to infection caused by Mycobacterium tuberculosis depended on both the innate and adaptive immune systems. Tuberculosis granuloma comprises cells of both the innate and adaptive immune response systems; among them, monocytes had received the most attention in recent years. Monocytes are important in immune defense and are the primary innate immune cells in the early stage of Mycobacterium tuberculosis infection, protecting the host against intracellular pathogens [Citation7,Citation8]. Monocytes’ heterogeneity and their ability to differentiate into monocyte-derived dendritic cells or monocyte-derived macrophages establishes a connection between innate and adaptive immune responses [Citation9]. Inflammatory monocytes can promptly respond to microbial stimuli by secreting cytokines and antimicrobial factors, expressing C-C motif chemokine receptor 2 (CCR2) chemokine receptors, and can affect the secretion and transport of monocyte chemoattractant protein (MCP-1) and C-C motif chemokine ligand 2 (CCL2) at the microbial infection site [Citation10]. Sun et al. [Citation11] showed that the average volume and conductivity of monocytes and the expression of MCP-1 were significantly higher in active TB samples than in latent TB samples. Liu et al. [Citation7] also showed that, the mononuclear cell membrane and soluble CD163 expression for active TB were higher than those in latent TB. Although the relationship between the abundance of circulating monocytes and active TB remains unclear, the targeted study of monocytes is increasingly regarded as a promising strategy for treating TB.
Advancements in gene chip and RNA sequencing technologies had accelerated the diagnosis of TB and the discovery of therapeutic targets. Biomarkers that distinguished between active TB and latent TB had been identified based on these technologies [Citation12]. However, the relationship between monocytes and these biomarkers and the underlying molecular mechanisms of the role of monocytes in TB is still unknown. Therefore, monocytes in active TB and latent TB are worthy of in-depth investigation.
Monocytes may play an essential role in the development of tuberculosis. Therefore, this study aimed to investigate the role of hub monocyte-associated genes in distinguishing LTBI from active TB.
2. Methods and materials
2.1 Source of information
We obtained the human microarray dataset GSE54992 [Citation13] from the Gene Expression Omnibus (GEO, https://www.ncbi.nlm.nih.gov/geo/) database. In addition, the data for gene expression from the Affymetrix Human Genome U133 Plus 2.0 Array of peripheral blood mononuclear cells (PBMCs) in nine active and six latent tuberculosis samples were analyzed. The raw transcriptomic data were processed by normalization and log2 transcriptomics using robust multiple average algorithms before further analysis [Citation14].
2.2 Evaluation of immune cells in PBMCs of tuberculosis
CIBERSORT is a deconvolution algorithm used to characterize the cellular composition of tissues according to the patterns of their gene expression profiles [Citation15]. To determine the abundance of immune cells in the peripheral blood of patients with tuberculosis, the LM22 matrix was used as the reference [Citation16], and the CIBERSORT algorithm was executed with 1000 permutations in GSE54992. CIBERSORT output, according to Monte Carlo sampling [Citation17], produced the deconvolution P-values, which indicated the reliability of the results for all samples. Only the peripheral blood samples of tuberculosis patients (p < 0.05) were used to evaluate the immune cell type composition in this study. The Wilcoxon rank-sum test compared the abundance of immune cell types between latent and active TB.
2.3 Screening monocyte-related genes
The ‘limma’ package in the R software was used to identify the DEGs among latent and active TB samples. If |fold change|≥1 and P < 0.05, genes were considered to be differentially expressed. Finally, Pearson’s correlation analysis was used to identify genes related to monocyte abundance. The genes were considered as DEMonRGs for a Pearson correlation coefficient>0.7.
2.4 Functional enrichment analysis
The DAVID software (http://david.ncifcrf.gov/, version 6.8) is a network-accessible tool that examines the biological relevance of a set of genes [Citation18]. Therefore, Gene Ontology (GO) and the Kyoto Encyclopedia of Genes and Genomes (KEGG) pathway enrichment analyses [Citation18] were performed to evaluate the potential function of the genes using DAVID 6.8. Gene count>3 and the significance threshold were set at p < 0.05 for the enrichment analysis.
2.5 PPI network
The Search Tool for the Retrieval of Interacting Genes (STRING version 11.5) (http://string-db.org) was used to systematically screen human protein interactions, and the interacting genes were retrieved.
In this study, the list of DEMonRGs was uploaded onto the STRING database, and essential PPIs with combined scores> 0.4 were identified. The Cytoscape 3.6.0 (http://cytoscape.org) software was used to visualize network interactions. Nodes in the network with a connectivity degree ≥ 10 were identified as hub DEMonRGs.
2.6 Validation of key genes in latent and active tuberculosis
The ‘pheatmap’ package in R was used for evaluating the association between the hub DEMonRGs and tuberculosis progression through unsupervised hierarchical clustering [Citation19] in the GSE54992 dataset. Four independent datasets (GSE19444 [Citation20], GSE37250 [Citation21], GSE39939 [Citation22], and GSE39940 [Citation22] (see Supplementary ) were used to validate the DEMonRGs between latent and active TB. To eliminate interference due to other factors, we eliminated the information of patients co-infected with human immunodeficiency virus (HIV) from the dataset.
Table 1. Clinical and demographic characteristic of subjects
2.7 Characteristics of hub DEMonRGs
The hub DEMonRGs were integrated, and based on the single sample scoring algorithm, ‘singscore,’ a multi-gene signature was constructed [Citation23]. The scores produced by this method were stable for a certain sample size and the number of tested genes. In this study, the score (called the ‘MonRG score’) relative to the hub DEMonRG collection was calculated for the peripheral blood samples of TB patients in the GSE19444 (n = 42), GSE37250 (n = 180), GSE39939 (n = 66), and GSE39940 (n = 124) datasets. The receiver operating characteristic (ROC) curve analysis was used to evaluate the diagnostic performance of the MonRG score for active tuberculosis, and the medcalc2.0 software was used to calculate the area under the curve (AUC). An equal number of genes were selected randomly to obtain a random score, and the bootstrap method [Citation24] was used to compare the diagnostic performances of the random and MonRG scores.
2.8 Verification using clinical samples
2.8.1 Specimen collection
Peripheral blood samples of healthy adults were collected from faculty, staff, and students between 21–55 years and underwent physical examinations at Chengdu Medical College from January 2019 to December 2020 with no recent infections. The chest X-ray examinations were regular, and tuberculosis, tumor, autoimmune diseases, and others were excluded. The peripheral blood of 35 healthy adults was tested using the T cell enzyme-linked immunospot assay kit for tuberculosis infection (Beijing Wantai Biological Company, TR20210101A). Due to the positive test results, 10 patient samples with latent tuberculosis were removed, and the remaining 25 were considered healthy controls. Interpretation criteria for latent tuberculosis were as previously described [Citation25]: positive, if the number of spots in the negative control is 0–5, the number of spots in test A and/or B minus the number of spots in the negative control is ≥6; and if the number of spots in the negative control was ≥6, the number of spots in test A and/or test B must be ≥2 times the spot numbers in the negative control. Peripheral blood samples from 15 patients with pulmonary tuberculosis (PTB) were obtained from the Department of Respiratory and Critical Care Medicine, The First Affiliated Hospital of Chengdu Medical College. All patients were aged 23–61 years, and met the diagnostic criteria for tuberculosis [Citation26]. They had no tumor, autoimmune disease, acquired immune deficiency syndrome (AIDS), or any co-existing conditions. A demographic table of the participants is shown in . Informed consent was obtained from all patients, and the study design was approved by the ethics committee of Chengdu Medical College (approval number2021 CYFYIRB-BA-14-01).
2.8.2 Extraction of peripheral blood mononuclear cells
Anticoagulated peripheral blood (5 mL) was incubated with lymphocyte separation solution (Sigma, 10,771), and the mononuclear cells were separated by density gradient centrifugation [Citation27]. Finally, the cells were frozen in liquid nitrogen until further use.
2.8.3 Real-time fluorescence quantitative PCR to detect cell mRNA expression
Total RNA from mononuclear cells was extracted, and the concentration was detected using a spectrometer. Then, reverse transcription (RT) was performed. The cDNA was synthesized using a reverse transcription PrimeScriptTM RT reagent Kit (Takara RR037B) and stored in a refrigerator at −20°C until further use. Fluorescence quantitative PCR was performed after cDNA synthesis using PrimeScriptTM RT Master Mix, and RT-qPCR was performed using SYBR® Premix Ex TaqTM (10 μL) according to the manufacturer’s instructions. The reaction comprised of 0.4 μL upstream and downstream primers each (10 μmol/L), 1 μL cDNA, and 8.4 μL RNase free water. The conditions for the reaction were set as follows: pre-denaturation at 95°C for 30 s, 95°C for 5 s, 60°C for 34 s for 40 cycles, and annealing at 60°C for 30 s. The reaction was performed on an ABI 8000 real-time quantitative PCR instrument. GAPDH was used as the internal reference, and the 2−ΔΔCT method [Citation28] was used for the relative quantitative analysis of expression. The primers were synthesized by the Shanghai Sangon Biological Engineering Technology & Services Co. Ltd. (Shanghai, China). The primer sequences are listed in Additional File 3 (Table S2). The mRNA expression levels of LTBI, active tuberculosis (ATB), and healthy control (HC) did not conform to the normal distribution and are presented as median values (interquartile range). The Kruskal-Wallis H test was used to compare mRNA expression, and the Nemenyi method was used for subsequent pairwise comparisons.
2.9 Statistical analysis
Non-normally distributed data in clinical data were represented as median with 25% to 75% interquartile range (IQR). DEMonRGs biomarkers were compared between multiple groups using the Kruskal–Wallis test, and the Nemenyi method was used for subsequent pairwise comparisons. Statistical significance was set at p < 0.05. Statistical analyses were performed using MedCalc2.0 (MedCalc Software, Ostend, Belgium), GraphPad Prism 8 (GraphPad Software, La Jolla, CA, USA), and R 3.6.1(R Project for Statistical Computing, https://www.r-project.org/) software.
3. Results
In this study, the deconvolution algorithm CIBERSORT was used to quantify the monocyte composition in TB samples. Among the PBMCs of patients with latent and active tuberculosis, 165 DEMonRGs were obtained through the ‘limma’ test and correlation analysis. Subsequently, we evaluated the pathways involved in the biological functions of the 165 DEMonRGs. A protein-protein interaction (PPI) network was constructed, and the hub genes (SERPINA1, FUCA2, and HP) were identified, and their expressions were further evaluated and validated using independent datasets and clinical samples. Subsequently, the hub genes were integrated, and a multi-gene signature was established to distinguish latent from active TB. A schematic of the workflow is shown in supplementary Figure 1. These findings may help us understand the molecular mechanisms of monocyte function in the progression of TB and provide potential new biomarkers for identifying and distinguishing of active and latent tuberculosis.
3.1 Role of DEMonRGs in latent and active tuberculosis
The immune cell components in the GSE54992 dataset were obtained using the CIBERSORT deconvolution algorithm (Supplementary Table 3).
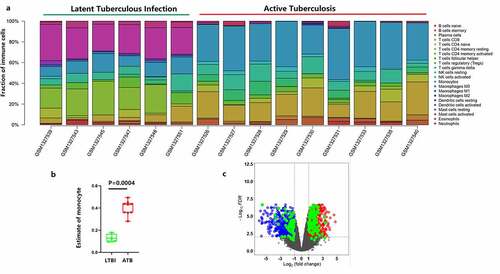
The results from 15 PBMCs samples from the GSE54992 dataset are presented in ). Active TB samples had higher infiltration of monocytes than the latent TB samples (), p < 0.001). In PBMCs, 2323 DEGs were obtained between six latent and nine active tuberculosis samples based on the limma test. Among them, 165 genes were highly correlated with monocytes (correlation coefficient> 0.7), and these were considered as DEMonRGs (), Supplementary Table 3). Along with monocytes, four other immune cell types also showed significant differences in their distribution between latent and active TB samples: memory B cells, CD8 T cells, gamma delta T cells, and activated dendritic cells. However, only monocytes had the highest abundance among the active TB samples and the highest number of genes with a correlation coefficient of> 0.7. These results indicate that the selected genes were mainly associated with monocytes for active TB.
Figure 1. Identification of the differentially expressed monocyte-related genes between latent and active tuberculosis. (a) The CIBERSORT algorithm was used to estimate the abundance of 22 immune cell types in the 15 samples. (b) Fraction of monocytes in PBMCs of 6 LTBI and 9 ATB. (c) The volcano plot of the DEGs in PBMCs of 6 latent- and 9 active tuberculosis PBMCs samples
3.2 Enrichment analysis for DEMonRGs
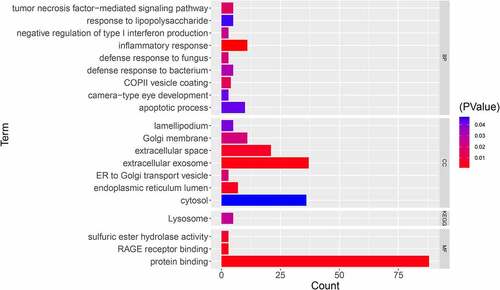
For functional analysis, the DEMonRG list was uploaded onto the DAVID 6.8 tool. The GO biological processes showed that these genes were mainly involved in the inflammatory response, apoptosis process, defense response to fungi, defense response to bacteria, and tumor necrosis factor-mediated signaling pathways. In addition, the KEGG pathway enrichment analysis showed that these genes were significantly enriched in lysosome-related pathways ().
Figure 2. GO and KEGG enrichment analyses for DEMonRGs; BP: Biological Process, CC: Cellular Component, MF: Molecular Function, KEGG: Kyoto Encyclopedia of Genes and Genomes
3.3 PPI network analysis
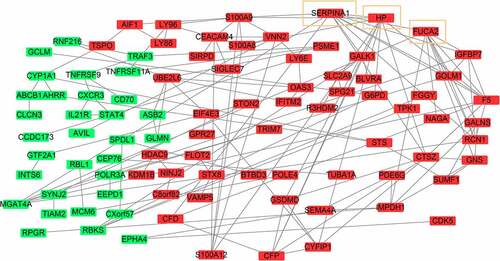
The PPI network of DEMonRGs was constructed using STRING. As shown in , this is a scale-free network consisting of 113 nodes and 111 edges. Genes with connectivity degree ≥ 10, including SERPINA1 (degree = 11), FUCA2 (degree = 11), and HP (degree = 10) were identified as hub DEGs in the network. All these genes were upregulated in active TB samples compared with latent tuberculosis samples.
Figure3 The protein-protein interaction network of DEMonRGs. Green represents the down-regulated genes, and red represents the up-regulated genes. Genes in the yellow box represent hub genes
3.4 Validation of hub DEMonRGs in latent and active tuberculosis
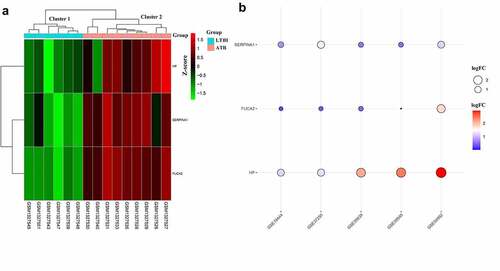
Unsupervised hierarchical clustering for hub DEMonRGs was performed for the GSE54992 dataset. As shown in ), the samples were classified into two different clusters: all latent tuberculosis samples were grouped in cluster 1, and all active TB samples were included in cluster 2. SERPINA1, FUCA2, and HP were potentially related to the active status of TB infection. Then, the expression of the three genes was verified using four independent datasets (GSE19444, GSE37250, GSE39939, and GSE39940). As shown in ), all hub DEGs had significantly higher expression in active TB samples. Notably, these genes in GSE39939 and GSE39939, which included tuberculosis samples in children who were not infected with human immunodeficiency virus (HIV), were also upregulated.
Figure 4. Expression patterns of hub DEMonRGs between latent and active tuberculosis peripheral blood samples. (a) The heat map for unsupervised hierarchical clustering of the three hub DEMonRGs in GSE54992. (b) Validation of the hub DEMonRGs in other GEO datasets
3.5 Verification in clinical samples
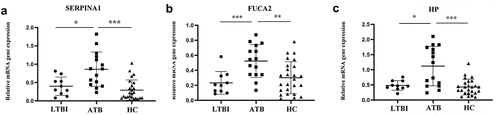
RT-qPCR results showed that peripheral blood mononuclear cell expression in SERPINA1, FUCA2, and HP among patients with latent TB were 0.350 (0.181,0.583), 0.204 (0.117,0.329), and 0.465 (0.390,0.633), respectively; in active tuberculosis patients SERPINA1, FUCA2, and HP mRNA expression levels were 0.873 (0.444,1.210), 0.543 (0.342,0.732), and 1.239 (0.462,1.738), respectively. For healthy individuals SERPINA1, FUCA2, and HP mRNA expression levels were 0.198 (0.080,0.459), 0.283 (0.109,0.457), and 0.233 (0.432,0.594), respectively. The Kruskal–Wallis test showed that the differences between the three groups were statistically significant (all P < 0.05). The SERPINA1, FUCA2, and HP expression levels in PBMCs from patients with active pulmonary tuberculosis were significantly higher than those in latent pulmonary tuberculosis and healthy individuals (all P < 0.05), as shown in . However, there were no differences in SERPINA1, FUCA2, and HP mRNA expression between latent tuberculosis and healthy controls.
Figure 5. Verification in clinical samples. (a) SERPINA1 mRNA expression in active tuberculosis, latent tuberculosis infection and healthy controls; (b) FUCA2 mRNA expression in active tuberculosis, latent tuberculosis infection and healthy controls; (c) HP mRNA expression in active tuberculosis, latent tuberculosis infection and healthy controls; *represents P < 0.05; ** represents P < 0.01; ***represents P < 0.001; ATB: active tuberculosis, LTBI: latent tuberculosis infection, HC: healthy control. Nonparametric one-way ANOVA(Kruskal-Walls) analyses were performed on measurement of mRNA expression levels
3.6 Clinical significance of hub gene characteristics
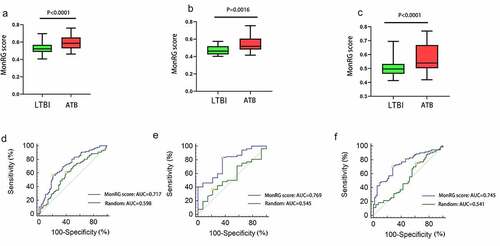
Since patients with latent tuberculosis were more likely to develop active tuberculosis, we speculated that hub DEMonRGs might help distinguish latent and active TB. As described in the previous section, the ‘singscore’ algorithm was used to verify this hypothesis to aggregate the three hub DEMonRGs, and the MonRG score was calculated. In the GSE37250, GSE39939, and GSE39940 datasets, the MonRG scores of patients with active TB were significantly higher than those of patients with latent tuberculosis ()). ROC analysis showed that the AUC value of the MonRG score for identification of active tuberculosis (TB) in the GSE37250 dataset was 0.715, which was significantly higher than that of the random condition (); AUC = 0.598, bootstrap p < 0.05). Similar results were obtained in the GSE39939 and GSE39940 datasets (); AUC = 0.769, bootstrap P < 0.05; ); AUC = 0.745, bootstrap P < 0.05) ().
Table 2. ROC analysis of MonRG score and random condition for discrimination between ATB and LTBI group
Figure 6. Diagnostic performance of the MonRG score for patients with active tuberculosis. (A, B, C) MonRG score between patients with active tuberculosis and latent tuberculosis in GSE37250, GSE39939, GSE39940 datasets, respectively. (D, E, F) Receiver operation characteristic curves of MonRG score for diagnosis of between active tuberculosis and latent tuberculosis infection in GSE37250, GSE39939, GSE39940 datasets, respectively. AUC: area under the curve; LTBI: latent tuberculosis infection; ATB: active tuberculosis
4. Discussion
Recent data from single-cell RNA sequencing and flow cytometry showed an increase in the proportion of monocytes for active tuberculosis. Mortality was related to innate immune activation and monocyte dysfunction in the pathogenesis of tuberculosis [Citation29]. In addition, studies had reported that monocytes were involved in tuberculosis-associated immune reconstitution inflammatory syndrome (TB-IRIS) [Citation30]. Druszczynska et al. [Citation31] also reported that in patients with active tuberculosis, the simultaneous increase in the monocyte signal transduction receptor membrane-bound CD14 (mCD14) and lymphocyte function-associated antigen (LFA-1) integrin might be considered a prodrome of breathing immune control by Mycobacterium tuberculosis in patients with LTBI and absence of clinical symptoms. However, monocyte-related molecular mechanisms and gene-based biomarkers during the occurrence and development of tuberculosis remain under investigation. Consistent with previous studies, a significant increase in monocyte abundance in the peripheral blood of patients with active TB was observed in this study. We identified 169 monocyte-related genes in patients with latent tuberculosis and active tuberculosis. These genes were mainly associated with inflammatory response, apoptosis process, defense response to fungi and bacteria, and tumor necrosis factor-mediated signaling pathways. In the PPI network, based on their degree of connectivity, SERPINA1 (degree = 11), FUCA2 (degree = 11), and HP (degree = 10) were identified as core genes. The expression patterns of these monocyte-related genes were verified using independent datasets for latent and active TB. More importantly, the core gene signature based on the ‘singscore’ algorithm could distinguish latent and active TB. The singscore method described in this study functions independently of sample composition in gene expression data and thus provided stable scores, which were particularly useful for small datasets or data integration. The sample size of the GEO cohorts included in this study was relatively small, as we chose the single-score method.
Bioinformatic analysis showed that monocyte-related genes were mainly enriched in immune-related biological processes, such as tumor necrosis factor-related pathways, lysosomal pathways, type I interferon secretion, and inflammatory factor responses. Immunological differences existed between latent and active tuberculosis. Some immune indices had been reported in active TB disease, possibly as a nonspecific indication of inflammation and immune activation, thus reflecting disease activity [Citation32]. The bioinformatic analysis suggested that an impaired immune response in patients might facilitate either primary infection with Mycobacterium or reactivation of latent tuberculosis. Previous studies reported that the body could release pro- tumor necrosis factor-α (TNF-α) after Mycobacterium tuberculosis infection to condition the adjacent uninfected cells to produce anti-tuberculosis activity and form granulomas, Interleukin-3 (IL-3) and interferon-gamma (IFN-γ) produced by cellular immunity can reach the local area of tuberculosis infection and enhance this effect [Citation32]. In addition, Quesniaux et al. [Citation33] showed that overproduction of tumor necrosis factor might lead to immunopathology, while defective production of tumor necrosis factor could lead to uncontrolled infection. TNF-α is a crucial effector for tuberculosis control and can play a protective role by guiding the formation of granulomas, aggregation of macrophages, and formation of other immune cells [Citation34]. The loss of tumor necrosis factor signaling led to the progression of human tuberculosis and increased mortality in mice infected with Mycobacterium tuberculosis due to necrotizing tissue granuloma. Roca et al. [Citation35] showed that tumor necrosis factor-α induced programmed pathogenic macrophage necrosis in tuberculosis through the mitochondrial-lysosome-endoplasmic reticulum pathway. Indeed, the lysosomal-related pathway was enriched in monocyte-related differential genes in this study. Zhang et al. [Citation36] determined the key role of autocrine or paracrine signals of type I interferon secreted from macrophages using in vitro M.tb-infected macrophages screened by genome-wide CRISPR-Cas9 and found that type I interferon signaling enhanced the effect of the first-line tuberculosis drug rifampicin in M.tb-infected mice. The above results also supported the findings of our bioinformatics analysis that the biological processes of immune inflammation and active TB shared some common genes. These results indicated that monocyte-related genes might be involved in the progression of TB mediated by immune inflammation. However, the specific underlying mechanisms need to be further verified.
In this study, three key monocyte-related genes, SERPINA1, FUCA2, and HP, were identified from the PPI network. Among these genes, only Haptoglobin (HP) is known to be directly related to the progression and activity of tuberculosis. In an acute-phase response, haptoglobin protein participates in the pathophysiological processes of tissue damage repair, anti-infection, and maintenance of internal environment stability. HP expression is significantly upregulated in TB pleurisy [Citation37]. The clinical sample verification in this study also showed that the HP levels in the PBMCs of patients with active TB were higher than those in patients with latent tuberculosis and healthy controls. We speculated that the increased HP levels in active TB were related to tissue hypoxia. When the tissue experienced hypoxic conditions, many red blood cells were lysed, and correspondingly, the blood hemoglobin content increased. To take up excessive hemoglobin in the body, the expression of haptoglobin rises concomitantly. Patients with active TB were in a hypersensitive state. Serine protease inhibitor A1 (SERPINA1) has a highly conserved protein structure, and its proportion contributes to more than 90% of the total plasma protease inhibitory ability. Arya et al. [Citation38] showed that SERPINA1 was highly expressed in active tuberculosis through the iTRAQ-I experiment, which was confirmed by Western blotting. As an acute-phase reactive protein, SERPINA1 is primarily synthesized in liver cells, but can also be produced by epithelial cells, monocytes, and macrophages. Active tuberculosis is also an infection that causes chronic pulmonary inflammation over a prolonged period [Citation39]. This could explain why SERPINA1 expression levels in PBMCs from patients with active pulmonary tuberculosis were significantly higher than those in patients with latent pulmonary tuberculosis and healthy individuals. However, the underlying molecular mechanism regulating SERPINA1 in tuberculosis remains unknown and requires further investigation. Alpha-l-fucosidase specific antibody (FUCA2) is an acid hydrolase that catalyzes fucosyl glycoproteins and glycolipids. FUCA2 is widely expressed in the tissue types, blood, and body fluids of humans and animals [Citation40] and plays an important role in inflammation. Sobkowicz et al. [Citation41] showed that upon stimulation of BEAS-2B cells by interferon-γ, FUCA2 was overexpressed, and its expression was regulated by the Th1 cytokine INF-γ. Several studies had shown that IFN-γ played a central role in the anti-tuberculosis immune response, and its level was generally elevated in the peripheral blood of patients with active tuberculosis [Citation42,Citation43]. In this study, the increase of FUCA2 mRNA in the peripheral blood of patients with active pulmonary tuberculosis could also be related to the regulation of IFN-γ.
Although the roles of FUCA2 and SERPINA1 in tuberculosis have not been determined, we found that the expression patterns of these key monocyte-related genes in latent and active tuberculosis were consistent in all independent data set validations. These genes were also reported to be related to the progression of several inflammatory diseases, including asthma and tumors [Citation40,Citation41,Citation44,Citation45]. To further verify the role of key monocyte-related genes in distinguishing latent and active tuberculosis, a three-gene signature based on monocyte-related genes was constructed. This feature showed good performance in determining latent tuberculosis from active tuberculosis. As an obligate intracellular pathogen, M. tuberculosis has numerous adaptive mechanisms that modify cellular processes to fight against the host immune response. In latent TB infection, M. tuberculosis benefits from immune changes that occur in the host cells (monocytes or macrophages) during mycobacterial infection [Citation46]. These changes provide a favorable environment for M. tuberculosis in the host cells and promote mycobacterial survival, growth, and latency. Thus, the genetic characteristics of monocyte-related genes may help distinguish latent tuberculosis from active TB.
Several studies had used the CIBERSORT algorithm to study, diagnose, and potentially treat chronic diseases [Citation47,Citation48] by directly screening key biomarkers and investigating immune infiltration between cases and controls. In our study, the CIBERSORT algorithm and singcore method were combined to screen the hub monocyte-related genes, which could help to distinguish between latent tuberculosis infection and active TB. In addition to the validity of the results, we carried out sample validation using a small number of samples (10 LTBI samples, 25 healthy control samples, 15 ATB samples), and the results were similar. However, this study had a few limitations. First, the monocyte abundance was estimated using the CIBERSORT algorithm and LM22 mixture as the reference; the latter was derived from circulating leukocytes, and not bulk tissues. Second, several immune cell types alter their patterns of gene expression during long-term TB infection. Although CIBERSORT was a superior and widely used method quantifying closely related cell subtypes in complex tissues, transcriptional biases, including unknown mixture content and noise, might result in some inaccuracies in the deconvolution results. Third, the current study lacked cell- and animal-based experiments. Although the expression of hub DEMonRGs was verified in multiple GEO data, the specific molecular mechanisms underlying these gene functions are largely unknown and should be examined in future experiments.
5. Conclusion
In conclusion, this comprehensive study provides a systematic perspective on monocyte-related genes in latent and active TB. Several molecular mechanisms underlying the link between monocytes and TB have been discussed. In addition, three genes may play a key role in active TB. These results provide a better understanding of the functional mechanisms of monocytes in TB. These findings may have important implications for candidate biomarkers for the diagnosis and treatment of tuberculosis.
Ethics statement
This study was approved by the Ethics Committee of the First Affiliated Hospital of Chengdu Medical College (approval number2021CYFYIRB-BA-14-01). All procedures involving human participants in this study were in compliance with the Declaration of Helsinki (revised in 2013). Informed consent was obtained from all patients.
Author contribution
Jie He conceived and designed the study. Yu Li performed the study and contributed to data management and analysis. Yaju Deng wrote the paper, with key intellectual content revised by Jie He. All authors read and approved the final submission.
Supplemental Material
Download Zip (2.8 MB)Supplemental data
Supplemental data for this article can be accessed here.
Disclosure statement
No potential conflict of interest was reported by the author(s).
Data availability statement
The datasets analyzed during the present study are available from GEO database (http://www.ncbi.nlm.nih.gov/geo/). For further inquiries, please contact the corresponding author.
Additional information
Funding
Related Research Data
References
- Ndzi EN, Nkenfou CN, Pefura EWY, et al. Tuberculosis diagnosis: algorithm that may discriminate latent from active tuberculosis. Heliyon. 2019;5(10):e02559.
- Dutta NK, Tornheim JA, Fukutani KF, et al. Integration of metabolomics and transcriptomics reveals novel biomarkers in the blood for tuberculosis diagnosis in children. Sci Rep. 2020;10(1):19527.
- Islam MS, Chughtai AA, Nazneen A, et al. A tuberculin skin test survey among healthcare workers in two public tertiary care hospitals in Bangladesh. PLoS One. 2020;15(12):e0243951.
- Organization. WH. The End TB strategy, Global Strategy and Targets for Tuberculosis Prevention, Care and Control After 2015.
- Hassan AS, Ahmed JH, Al-Haroon SS. A study of the effect of Nigella sativa (Black seeds) in isoniazid (INH)-induced hepatotoxicity in rabbits. Indian J Pharmacol. 2012;44(6):678–682.
- Liu S, Jia H, Hou S, et al. Recombinant Mtb9.8 of Mycobacterium bovis stimulates TNF-α and IL-1β secretion by RAW264.7 macrophages through activation of NF-κB pathway via TLR2. Sci Rep. 2018;8(1):1928.
- Liu Q, Ou Q, Chen H, et al. Differential expression and predictive value of monocyte scavenger receptor CD163 in populations with different tuberculosis infection statuses. BMC Infect Dis. 2019;19(1):1006.
- Wayengera M, Mwebaza I, Welishe J, et al. Immuno-diagnosis of Mycobacterium tuberculosis in sputum, and reduction of timelines for its positive cultures to within 3 h by pathogen-specific thymidylate kinase expression assays. BMC Res Notes. 2017;10(1):368.
- Sampath P, Moideen K, Ranganathan UD, et al. Monocyte subsets: Phenotypes and function in tuberculosis infection. Front Immunol. 2018;9:1726.
- Serbina NV, Jia T, Hohl TM, et al. Monocyte-mediated defense against microbial pathogens. Annu Rev Immunol. 2008;26(1):421–452.
- Sun T, Wu B, Wang J, et al. Evaluation of the diagnostic efficacy of Monocyte parameters and MCP-1 to distinguishing active tuberculosis from latent tuberculosis. Clin Lab. 2019;65(7). DOI:10.7754/Clin.Lab.2018.181115.
- Estévez O, Anibarro L, Garet E, et al. An RNA-seq based machine learning approach identifies latent tuberculosis patients with an active tuberculosis profile. Front Immunol. 2020;11:1470.
- Cai Y, Yang Q, Tang Y, et al. Increased complement C1q level marks active disease in human tuberculosis. PLoS One. 2014;9(3):e92340.
- Cao R, Yuan L, Ma B, et al. An EMT-related gene signature for the prognosis of human bladder cancer. J Cell Mol Med. 2020;24(1):605–617.
- Newman AM, Liu CL, Green MR, et al. Robust enumeration of cell subsets from tissue expression profiles. Nat Methods. 2015;12(5):453–457.
- Xia M, Wu Q, Chen P, et al. Regulatory T cell-related gene biomarkers in the deterioration of Atherosclerosis. Front Cardiovasc Med. 2021;8:661709.
- Simon SL, Hoffman FO, Hofer E. The two-dimensional Monte Carlo: a new methodologic paradigm for dose reconstruction for epidemiological studies. Radiat Res. 2015;183(1):27–41.
- Huang Da W, Sherman BT, Lempicki RA. Systematic and integrative analysis of large gene lists using DAVID bioinformatics resources. Nat Protoc. 2009;4(1):44–57. 10.1038/nprot.2008.211.
- Kimes PK, Liu Y, Neil Hayes D, et al. Statistical significance for hierarchical clustering. Biometrics. 2017;73(3):811–821.
- Berry MP, Graham CM, McNab FW, et al. An interferon-inducible neutrophil-driven blood transcriptional signature in human tuberculosis. Nature. 2010;466(7309):973–977.
- Kaforou M, Wright VJ, Oni T, et al. Detection of tuberculosis in HIV-infected and -uninfected African adults using whole blood RNA expression signatures: a case-control study. PLoS Med. 2013;10(10):e1001538.
- Anderson ST, Kaforou M, Brent AJ, et al. Diagnosis of childhood tuberculosis and host RNA expression in Africa. N Engl J Med. 2014;370(18):1712–1723.
- Foroutan M, Bhuva DD, Lyu R, et al. Single sample scoring of molecular phenotypes. BMC Bioinformatics. 2018;19(1):404.
- Johnston MG, Faulkner C. A bootstrap approach is a superior statistical method for the comparison of non-normal data with differing variances. New Phytol. 2021;230(1):23–26.
- Bergot E, Abiteboul D, Andréjak C, et al. Practice recommendations for the use and interpretation of interferon gamma release assays in the diagnosis of latent and active tuberculosis. Rev Mal Respir. 2018;35(8):852–858.
- Nahid P, Mase SR, Migliori GB, et al. Treatment of drug-resistant tuberculosis. an official ATS/CDC/ERS/IDSA clinical practice guideline. American Journal of Respiratory and Critical Care Medicine. 2019;200(10):e93–e142.
- Lund PK, Joø GB, Westvik AB, et al. Isolation of monocytes from whole blood by density gradient centrifugation and counter-current elutriation followed by cryopreservation: six years’ experience. Scand J Clin Lab Invest. 2000;60(5):357–365.
- Livak KJ, Schmittgen TD. Analysis of relative gene expression data using real-time quantitative PCR and the 2(-Delta Delta C(T)) Method. Methods. 2001;25(4):402–408.
- Janssen S, Schutz C, Ward A, et al. Mortality in severe human immunodeficiency virus-tuberculosis associates with innate immune activation and dysfunction of monocytes. Clin Infect Dis. 2017;65(1):73–82.
- Tan HY, Yong YK, Shankar EM, et al. Aberrant Inflammasome Activation Characterizes Tuberculosis-Associated Immune Reconstitution Inflammatory Syndrome. J Immunol. 2016;196(10):4052–4063.
- Druszczynska M, Wlodarczyk M, Janiszewska-Drobinska B, et al. Monocyte signal transduction receptors in active and latent tuberculosis. Clin Dev Immunol. 2013;2013:851452.
- Mootoo A, Stylianou E, Arias MA, et al. TNF-alpha in tuberculosis: a cytokine with a split personality. Inflamm Allergy Drug Targets. 2009;8(1):53–62.
- Quesniaux VF, Jacobs M, Allie N, et al. TNF in host resistance to tuberculosis infection. Curr Dir Autoimmun. 2010;11:157–179.
- Clay H, Volkman HE, Ramakrishnan L. Tumor necrosis factor signaling mediates resistance to mycobacteria by inhibiting bacterial growth and macrophage death. Immunity. 2008;29(2):283–294.
- Roca FJ, Whitworth LJ, Redmond S, et al. TNF induces pathogenic programmed macrophage necrosis in Tuberculosis through a Mitochondrial-Lysosomal-Endoplasmic Reticulum Circuit. Cell. 2019;178(6):1344–1361.e1311.
- Zhang L, Jiang X, Pfau D, et al. Type I interferon signaling mediates Mycobacterium tuberculosis-induced macrophage death. J Exp Med. 2021;218(2). DOI:10.1084/jem.20200887.
- Gao J, Song L, Li D, et al. Clinical value of haptoglobin and soluble CD163 testing for the differential diagnosis of tuberculous and malignant pleural effusions. Medicine (Baltimore). 2019;98(42):e17416.
- Arya R, Dabral D, Faruquee HM, et al. Serum Small Extracellular Vesicles Proteome of Tuberculosis Patients Demonstrated Deregulated Immune Response. Proteomics Clin Appl. 2020;14(1):e1900062.
- Zoller T, Mfinanga EH, Zumba TB, et al. Chronic airflow obstruction in Tanzania - a cross-sectional study. BMC Pulm Med. 2018;18(1):11.
- Waidely E, Al-Youbi AO, Bashammakh AS, et al. Alpha-l-Fucosidase Immunoassay for Early Detection of Hepatocellular Carcinoma. Anal Chem. 2017;89(17):9459–9466.
- Sobkowicz AD, Gallagher ME, Reid CJ, et al. Modulation of expression in BEAS-2B airway epithelial cells of α-L-fucosidase A1 and A2 by Th1 and Th2 cytokines, and overexpression of α-L-fucosidase 2. Mol Cell Biochem. 2014;390(1–2):101–113.
- Zhang M, Xiong D, Li H, et al. Diagnostic value of T-Spot TB combined with INF-γ and IL-27 in tuberculous pleurisy. Exp Ther Med. 2018;15(2):1871–1874.
- Kim JY, Park JH, Kim MC, et al. Combined IFN-γ and TNF-α release assay for differentiating active tuberculosis from latent tuberculosis infection. J Infect. 2018;77(4):314–320.
- Kwon CH, Park HJ, Choi JH, et al. Snail and serpinA1 promote tumor progression and predict prognosis in colorectal cancer. Oncotarget. 2015;6(24):20312–20326.
- Hadzik-Blaszczyk M, Zdral A, Zielonka TM, et al. SERPINA1 Gene Variants in Granulomatosis with Polyangiitis. Adv Exp Med Biol. 2018;1070:9–18.
- Wawrocki S, Kielnierowski G, Rudnicka W, et al. Interleukin-18, Functional IL-18 Receptor and IL-18 Binding Protein Expression in Active and Latent Tuberculosis. Pathogens. 2020;9(6):451.
- Xue G, Hua L, Zhou N, et al. Characteristics of immune cell infiltration and associated diagnostic biomarkers in ulcerative colitis: results from bioinformatics analysis. Bioengineered. 2021;12(1):252–265.
- Zeng Y, Li N, Zheng Z, et al. Screening of key biomarkers and immune infiltration in Pulmonary Arterial Hypertension via integrated bioinformatics analysis. Bioengineered. 2021;12(1):2576–2591.