
ABSTRACT
Stromal and immune cells are major components of tumor microenvironment (TME) and affect the growth and development of thyroid carcinoma (THCA). However, data on the exact mechanisms that define the relationship between the TME and THCA remain scant. We calculated stromal and immune cells scores and the proportion of tumor-infiltrating immune cells (TICs) by CIBERSORT and ESTIMATE based on the THCA gene expression data from the Cancer Genome Atlas (TCGA). In addition, we evaluated differentially expressed genes (DEGs) from high- and low-score groups and performed functional enrichment analysis. Furthermore, our data show a significant correlation between plasma complement factor B (CFB) and PTC development and prognosis. Gene Set Enrichment Analysis (GSEA) demonstrated that the CFB was mainly enriched in immune response pathways. The expression of CFB was positively correlated with T cells CD8, Macrophages M1, Plasma cells, T cells CD4 memory activated, T cells follicular helper and T cells regulatory (Tregs), whereas negatively correlated with Eosinophils, Macrophages M0, Macrophages M2, Mast cells resting, T cells CD4 memory resting in the TME. Finally, the expression level of CFB was verified by other cohorts from Gene Expression Omnibus (GEO) database and quantitative Real-Time PCR (qRT-PCR) analyses, which was consistent with the results of bioinformatic analysis. Taken together, our data demonstrated that the CFB could be a prognostic marker for THCA and its expression influences the infiltration of immune cells.
Introduction
Thyroid carcinoma (THCA), derived from follicular thyroid cells, is the most common endocrine system malignancy worldwide [Citation1–3]. The morbidity of THCA has been increasing in the recent decades [Citation4]. Of all the THCA subtypes, papillary thyroid carcinoma (PTC) is the most common, and accounts for approximately 90% of all the THCA cases [Citation5]. However, compared to other forms of cancer, the course of PTC remains indolent and has low mortality [Citation6]. Besides, most patients experience relatively better prognosis following the standard treatment (surgery followed by either radioactive iodine or observation) [Citation7]. Nevertheless, some patients might develop cervical lymph node metastasis, which leads to locoregional recurrence [Citation8]. It is, therefore, crucial to identify patients with aggressive disease in order to administer timely treatment [Citation9]. Thus, understanding the THCA carcinogenesis would help inform the development of effective diagnostic and therapeutic strategies.
Increasing evidences have shown the TME is of great importance in the tumor progression, treatment and clinical outcome [Citation10,Citation11]. TME is a complex and continuously evolving system. The occurrence, growth and metastasis of tumors is strongly dependent on the internal environment of tumor cells. It not only includes the structure, function and metabolism of tumor tissues, but also relates to the internal environment of tumor cells themselves [Citation12,Citation13]. Accordingly, the TME significantly influences tumor therapeutic response and clinical outcomes [Citation14]. The TME is mainly composed of stromal cells, soluble molecules and immune cells [Citation15]. Both the immune and stromal cells have been proposed to be valuable in tumor diagnosis and evaluation of disease prognosis [Citation16]. However, data on the role of the TME stromal cells on tumor progression remains scant. Besides, previous studies have indicated that tumor-infiltrating immune cells (TICs) in TME could serve as prognostic markers in cancer with various bioinformatics tools, such as lung cancer [Citation17], endometrial carcinoma [Citation18] and hepatocellular carcinoma [Citation19]. The interaction has been valuable for developing innovative THCA-directed immunotherapies. Recent studies show that TME components significantly affect THCA growth and progression [Citation20]. Therefore, it is imperative to find out TME-related biomarker to improve the survival and prognosis of THCA.
In this study, we obtained 570 transcriptome data and 509 clinical datasets from TCGA database. We employed ESTIMATE and CIBERSORT algorithms to compute TME-specific immune and stromal scores in THCA. The proportion of the TICs in every THCA sample was calculated from The Cancer Genome Atlas (TCGA) database. We identified that the plasma complement factor B (CFB) is a TME-related prognostic biomarker for THCA [Citation21]. High CFB expression indicated better clinical prognosis and infiltration of TICs. Furthermore, GEO database and qRT-PCR analyses also validated the expression of CFB. Therefore, we hypothesized that CFB serves as a potential prognostic marker for patients with THCA. We aimed to explore the potential role of CFB in the prognosis and TME. Furthermore, our goal was to provide a potential therapeutic target for THCA.
Methods and Materials
Data collection
Transcriptome RNA-seq data (FPKM) from 570 THCA cases (58 normal thyroid samples and 512 thyroid tumor samples) and the corresponding clinical data were downloaded from The Cancer Genome Atlas (TCGA) (https://tcga-data.nci.nih.gov/tcga/).
ESTIMATE
We used ESTIMATE (Estimation of Stromal and Immune cells in Malignant Tumor tissues using Expression data) in R language (version 4.0.3) to predict the tumor purity and presence of infiltrating stromal/immune cells in the tumor tissues using gene expression data [Citation21,Citation22]. We generated stromal scores (amount of stroma cells in tumor tissues), immune scores (the infiltration of immune cells in tumor tissues) as well as estimate scores (tumor purity) [Citation23].
Generation of differentially expressed genes (DEGs) and functional enrichment analysis
A total of 570 tumor samples were sorted into high- or low-score based on the median ImmuneScores or StromalScores. Using ‘limma’ package in R language (version 4.0.3), we generated DEGs between the high- and low-immune/stromal score groups. DEGs with a false discovery rate (FDR) <0.05 and fold change ≥1, after transformation (log2FC) (high-score group/low-score group) were considered significant. We then constructed Venn plots to screen the intersected DEGs.
Gene Ontology (GO) and Kyoto Encyclopedia of Genes and Genomes (KEGG) pathway enrichment analyses were performed using clusterProfiler, org.Hs.eg.db, enrichplot and ggplot2 packages in R language version 4.0.3. Enrichment data with a P-value<0.05 and q-value<0.05 were considered to be statistically significant [Citation24].
Difference analysis of the scores with Clinical stages
The THCA clinical samples were downloaded from the TCGA database. All the statistical analyses were performed using R language. We used the Wilcoxon rank sum test (for ranked data with two categories) or Kruskal–Wallis test (three or more categories) to evaluate the significance of the clinical stages against pathological stages. The data were compared with the immune scores, stromal scores or ESTIMATE scores.
PPI Network and COX Regression Analysis
The protein–protein interaction (PPI) network was analyzed using STRING database (https://string-db.org), followed by reconstruction with Cytoscape version 3.8.2 [Citation25]. We used nodes with a highest confidence of interaction score of no less than 0.99 to build the PPI network.
COX regression analysis was performed by survival package in R language, then we screened out the statistically significant genes by the univariate COX regression analysis (P-value < 0.05).
Gene Set Enrichment Analysis (GSEA)
C2.cp.kegg.v7.1.symbols.gmt [Curated] and c5.all.v7.2.symbols.gmt [Gene ontology] were downloaded from Molecular Signatures Database as the target sets for the execution of GSEA. The GSEA of the whole transcriptome from the tumor sample was performed using gsea-4.1.0 (Number of permutations: 1000; Phenotype labels: h _versus _l). Gene sets with FDR q < 0.05 were considered as significant [Citation26].
CIBERSORT
CIBERSORT, a deconvolution algorithm, was used to estimate the composition of 21 immune cells in all the tumor samples. We performed 1,000 permutations and retained samples with a p-value < 0.05, which were considered statistically significant. The sum of various immune cells was 1.
GEO database verification
The datasets of PTC patients were downloaded from the Gene Expression Omnibus (GEO) database (https://www.ncbi.nlm.nih.gov/geo/). We selected four mRNA datasets (GSE33630, GSE29265, GSE35570, and GSE27155) of PTC to verify the expression level of CFB in this study.
Quantitative real-time PCR (qRT-PCR)
Sixty-five matched tumorous and adjacent normal tissue specimens of thyroid cancer were collected from The First Affiliated Hospital of China Medical University. The clinicopathological parameters of 65 thyroid cancer patients are shown in . The total RNA was extracted from tissue samples using RNAiso (Takara, Dalian, China), then RNA was reverse transcribed into cDNA with the QuantiTect Reverse Transcription Kit (Takara, Shiga, Japan). Quantitative Real-Time PCR (qRT-PCR) analyses were performed by SYBR-Green (Takara, Shiga, Japan) to validate gene expression, and the level of GAPDH served as an internal control. The relative expressions were calculated based on the comparative Ct (2−ΔΔCt) method. The primer sequences for qRT-PCR were synthesized by Sangon Biotech (Shanghai, China), including GAPDH-F (5ʹ GTCTCCTCTGACTTCAACAGCG 3ʹ), GAPDH-R (5ʹ ACCACCCTGTTGCTGTAGCCAA 3ʹ), CFB-F (5ʹ GTCTCCTCTGACTTCAACAGCG 3ʹ), CFB-R (5ʹ GTCTCCTCTGACTTCAACAGCG 3ʹ)
Table 1. CFB expression associated with clinicopathological variables (N = 65)
Results
In our study, we employed ESTIMATE and CIBERSORT algorithms to compute immune and stromal scores in thyroid carcinoma. Subsequently, we performed function enrichment analysis, Cox regression analysis, and tumor infiltrating immune cells. The plasma complement factor B (CFB) was identified and Kaplan–Meier survival analysis suggested that high CFB expression had a better clinical prognosis and infiltration of immune cells. Therefore, CFB might provide a potential prognostic marker in patients with THCA.
Characterization of THCA patients and clinical correlation with stromal or immune scores
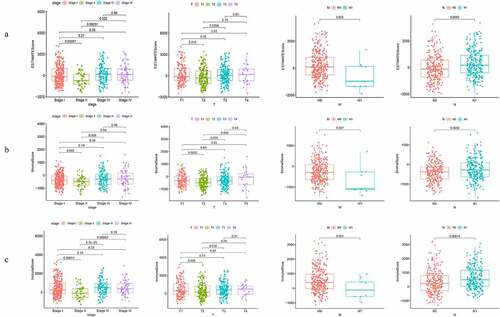
A total of 570 THCA samples were obtained from the TCGA database. Stromal scores, immune scores, and ESTIMATE scores in the TME were generated based on the ESTIMATE algorithm. Our univariate analysis demonstrated that the clinicopathological characteristics were significantly associated with the stromal scores and immune scores. There were statistically significant differences between stromal score, immune score, and estimate score in T2 patients from that in T1 or T3 patients. Furthermore, there were significant differences between the estimate score, stromal score, and immune score in stage II and stage I, III, or IV, other clinical stages did not show any significant differences (). The estimate score and stromal score of the M0 stage were higher than that of the M1 stage (), p = 0.035 and 0.027, respectively). There were no significant differences among other clinical stages in the immune score. The estimated score, stromal score, and immune score differed significantly between the N0 and the N1 stage (), p = 0.0003, 0.0034, and 0.00014, respectively). Besides, no statistically significant differences were observed in the stromal score, immune score, and estimate score between the patients’ age and gender (). These data showed that the proportion of immune and stromal cells was associated with the growth and progression of THCA.
Figure 1. Correlation of StromalScore and ImmuneScore with clinicopathological staging characteristics
DEGs and Functional Enrichment Analysis
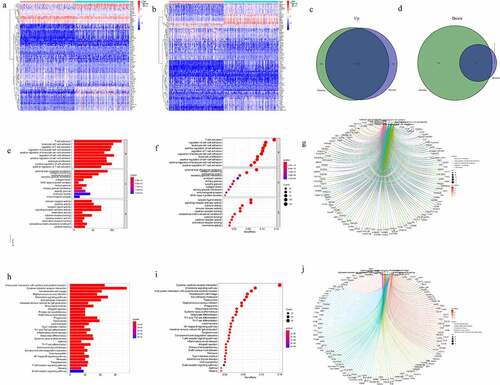
To identify the exact alterations in gene expression in the TME, the THCA patients were categorized into high- and low-score groups based on the stromal/immune cells. After performing the differential expression analysis of the groups as categorized by the stromal scores, we obtained a total of 1031 DEGs. Among them, 79 genes were down-regulated while 952 genes were up-regulated (). Similarly, differential analysis of the high- and low-immune score patients showed 1294 DEGs consisting of 318 downregulated genes and 976 upregulated genes. In addition, the Venn diagrams, drawn from an intersection of the DEGs between stromal and immune score groups, showed a total of 72 downregulated genes and 818 upregulated genes (). The DEGs were listed in Supplementary material 1. The DEGs might have been responsible for the TME status. All the 890 DEGs were used to conduct GO and KEGG functional enrichment analysis via the clusterProfiler R package in R language. GO enrichment data showed that the DEGs were significantly mapped into T cell activation and lymphocyte differentiation (). In addition, the KEGG enrichment analysis suggested that most of the pathways were associated with immune responses, such as cytokine–cytokine receptor interaction and chemokine signaling pathway ().
Figure 2. High score groups and low score groups and enrichment analysis of GO and KEGG for DEGs
PPI Network Analysis and Univariate COX Regression Analysis
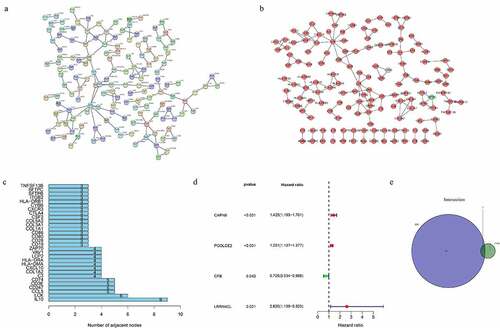
To further explore the relationship between the DEGs, we used STRING online tool and Cytoscape software (version 3.8.2) to perform a PPI network (). The top 30 genes with maximum number of nodes in the PPI network were presented as bar plots ()). Univariate COX regression analysis of the 890 immune-related DEGs showed that 4 genes were potential prognostic or risk factors for THCA ()). Furthermore, an intersection analysis of the top 100 genes in PPI network and the 4 prognostic genes showed CFB as the only one core target gene ()).
Figure 3. Protein–protein interaction network and univariate Cox regression analysis
CFB Expression Levels, Survival, and Clinical Correlation Analysis
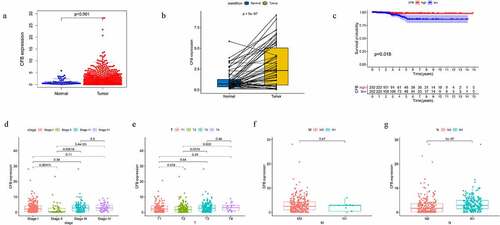
To evaluate the role of CFB expression in clinical disease manifestations, we profiled the expression of CFB in normal and tumor tissues using ‘limma’ package in R language (Wilcoxon rank sum test, P < 0.001). The CFB expression in normal tissues was significantly lower than in tumor tissues ()). Furthermore, the CFB expression in paired tumor tissues was significantly higher than the expression level in adjacent normal tissues ()). To perform survival analysis, all the THCA cases were divided into CFB high and CFB low-expression groups based on the CFB median expression value. The survival analysis indicated that THCA patients with higher CFB expression had a longer survival compared to those with lower CFB expression ()). Besides, our clinical correlation analysis of CFB showed that, except for the low CFB expression in stage II compared to stage I or III, there was no significant difference in the other clinical stages ()). In addition, the expression level in N1 was higher than that in N0 ()). M0 and M1 did not show any significant differences in the CFB protein expression ()). Furthermore, our data showed that there was significant difference between the T2 and T3 or T4 groups ()).
Figure 4. CFB expression levels and the survival and clinical correlation analysis of THCA patients
GSEA
To determine significantly enriched signaling pathways, we performed GSEA in the high-expression and low-expression groups and then used FDR q-value, nominal p-value, and FWER p-value for data interpretation. Our KEGG enrichment data showed that the CFB gene was highly expressed in signaling pathways such as antigen processing and presentation, autoimmune thyroid disease, cell adhesion molecules cams, intestinal immune network for IGA production, leishmania infection, natural killer cell mediated cytotoxicity, Escherichia coli infection, systemic lupus erythematosus, type 1 diabetes mellitus, or viral myocarditis (Supplementary Figure S1a). On the other hand, the GO enrichment analysis showed upregulated CFB expression in pathways such as adaptive immune response, interferon gamma mediated signaling pathway, positive regulation of T cell mediated cytotoxicity, positive regulation of T cell mediated immunity, regulation of leukocyte mediated cytotoxicity, regulation of syncytium formation by plasma membrane fusion, regulation of T cell mediated cytotoxicity, regulation of T cell mediated immunity, T cell activation involved in immune response or T cell mediated immunity (Supplementary Figure S1b). These results indicated that CFB may be a potential indicator for the TME status.
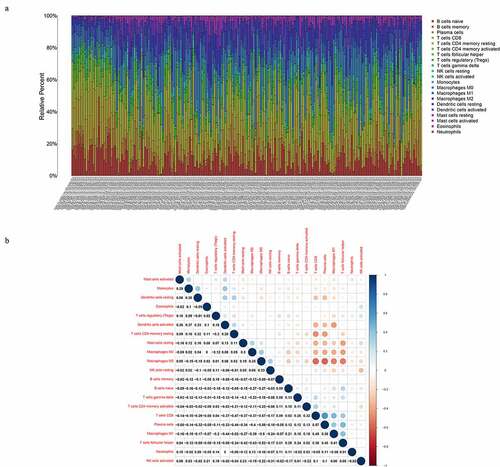
Tumor-infiltrating immune subsets in the TME
CIBERSORT algorithm be used to calculate the proportion of the tumor-infiltrating immune cells in the TME among the THCA cases. ) shows the proportion of the 21 immune cells in every sample, and the sum of various immune cells was 1 in every bar plot. Besides, the correlation analyses indicated that CD8 T cells displayed a strong positive correlation with Plasma cells (Cor = 0.57) ()). On the contrary, plasma cells were negatively correlated with Macrophages M0 (Cor = −0.58).
Figure 5. TIC profile and correlation analysis in TME
Effect of the expression of CFB on TIC levels and the Correlation between the CFB expression and the TICs
To explore the potential functions of CFB in the TME, we classified the patients into high- and low-expression groups based on the expression of CFB. Our analysis showed that a total of 10 TICs were perturbed by the expression of CFB ()). B cells naïve (p = 0.034), plasma cells (p < 0.001), T cells CD4 memory activated (p < 0.001), T cells follicular helper (p = 0.004), T cells regulatory (p = 0.019) and Macrophages M1 (p < 0.001) were positively correlated with high CFB expression. However, Macrophages M0 (p < 0.001), Macrophages M2 (p = 0.002), Mast cells resting (p = 0.003) and Eosinophils (p = 0.030) were significantly upregulated in the low-expression group.
Figure 6. Correlation of immune cell infiltration levels with CFB expression
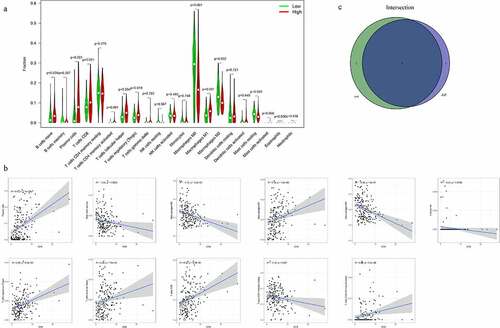
In addition, the data indicated a correlation between the CFB expression and TICs in the THCA patients ()). The CFB gene was positively correlated with T cells CD8, Macrophages M1, Plasma cells, T cells CD4 memory activated, T cells follicular helper or T cells regulatory (Tregs), but negatively correlated with Eosinophils, Macrophages M0, Macrophages M2, Mast cells resting or T cells CD4 memory resting.
Consequently, to identify the most closely related immune cells, we performed the intersection analysis based on both the difference analysis and correlation tests with Venn diagram. Our data showed significant correlation between the Plasma cells, T cells CD4 memory activated, T cells follicular helper, T cells regulatory (Tregs), Macrophages M0, Macrophages M1, Macrophages M2, Mast cells resting or Eosinophils with CFB expression ()).
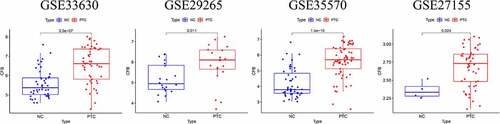
GEO database verification
We downloaded four datasets from GEO to further verify the accuracy of the previous results from TCGA analysis. The expression of CFB was significantly higher in PTC compared with than that in normal thyroid samples in GSE33630, GSE29265, GSE35570, and GSE27155 (, P < 0.05). The results of GEO datasets were essential in agreement with the findings of the TCGA database. The survival information of CFB in PTC could unfortunately not be obtained from GEO datasets.
Figure 7. Expression of CFB in different GEO datasets
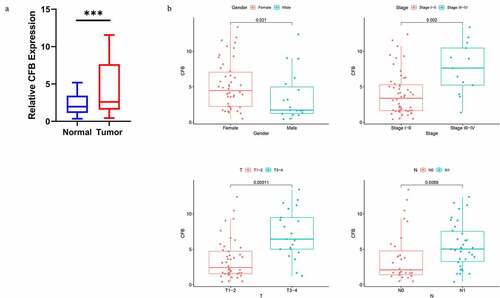
Association between CFB expression and clinicopathologic features
The mRNA expression of CFB was validated in 65 pairs tumorous and adjacent normal tissues obtained from THCA patients using qRT-PCR analysis. The qRT-PCR result indicated that the mRNA expression of CFB was significantly higher in tumor tissues compared to adjacent normal tissues (), p < 0.001). The CFB expression was higher in the high pathologic stage (P = 0.002), T stage (P = 0.00011), N stage (P = 0.0088). The expression level of CFB in female was higher than that in male (P = 0.021) ()).
Figure 8. qRT-PCR verification of CFB expression between THCA tissues and adjacent normal tissues
Discussion
THCA is the most common form of endocrine cancer and surgery is a standard strategy for the treatment of THCA. However, recurrent laryngeal nerve (RLN) palsy is a serious complication of thyroid surgery. Intraoperative neuromonitoring (IONM) during thyroid surgery has gained popularity, and it can help clinicians predict vocal cord (VC) function outcome and plan intraoperative and postoperative treatments. At present, IONM is increasingly being used by thyroid surgeons as a safe and effective technique to assist in RLN identification and potentially reduce the risk of injury [Citation27]. Although THCA patients have a better prognosis after surgery, cervical lymph node metastasis (LNM) in THCA is very common. The role of lymph node dissection in the treatment of THCA has been controversial. There is agreement in neck surgeons about the extension of therapeutic lymph node dissection in N+ PTC patients, and in the prophylactic treatment of N0 ‘high risk’ patients [Citation28]. In recent years, it has been an increase of incidental thyroid carcinomas (ICs), and majority of ICs are microcarcinoma (MC) (smaller than or equal to 1 cm). It has little biological aggressiveness; therefore, a close follow-up endocrine surgery might be acceptable [Citation29].
Previous studies showed an association between TME and the tumor development [Citation17,Citation30]. Besides, TME was shown to promote tumor inflammation and angiogenesis [Citation31,Citation32]. The prognosis of cancer patients depends on the purity of tumor TME, which is dependent on the individual components [Citation33]. Stromal and immune cells are two main types of TME components and have been proposed to aid in tumor diagnosis, prognosis, and survival analysis [Citation34–36]. Furthermore, complement, the constituent of innate immunity, is present in the TME. The functions of complement include clearance of pathogens and maintenance of homeostasis and could contribute to anti-tumoral role in certain cancers [Citation37].
In this study, we intend to explore TME-related gene signature associated with THCA patient survival and outcomes. We performed ESTIMATE to acquire the stromal and immune scores in TME, then identified TME-related genes from TCGA database to determine the correlation with clinical information. The data showed that the genes were significantly associated with clinical stage and TNM stages. We then employed GO and KEGG enrichment analysis to evaluate the potential roles of 2325 DEGs in the high- or low-score groups of stromal and immune cells. The GO analysis showed that most of the DEGs regulated biological processes, such as T cell activation and lymphocyte differentiation in the TME. On the other hand, the KEGG analysis suggested that most of the DEGs triggered immune responses. In addition, to understand the interactions of the DEGs, we constructed the PPI network. The COX regression analysis was performed to understand predictive values for prognosis in the THCA patients. We obtained four related genes that were thought to have significant predictive values. The genes could be considered as potential biomarkers for THCA. The intersection of the four genes with the top 100 genes in the PPI network nodes resulted into the identification of plasma Complement Factor B (CFB). Unlike in normal tissues, the CFB gene was significantly upregulated in the TME of THCA patients. Besides, the high expression of the CFB gene was associated with longer survival and considerably better prognosis. On the other hand, to further dissect the functions of the CFB in the TME, we performed GSEA analysis. The 10 most enriched signaling pathways in the high- or low-expression phenotypes of CFB were determined. The data showed that CFB could be a potential marker in the TME status. Additionally, nine kinds of TICs were associated with CFB expression. The TICs included plasma cells, T cells CD4 memory activated, T cells follicular helper, T cells regulatory (Tregs), Macrophages M0, Macrophages M1, Macrophages M2, Mast cells resting and Eosinophils. CFB low-expression group had significantly higher proportions of M0 macrophages and M2 macrophages. CFB high-expression group had the higher proportions of M1 macrophages. Tumor-infiltrating macrophages played an essential role in tumor behavior. M1 macrophages secrete cytokines, killing tumor cells in the TME. M2 macrophages secrete anti-inflammatory factors, it could promote tumor growth and metastasis [Citation38]. Our study showed that more M1 macrophages infiltrated in CFB high-expression group, which implied that tumor-infiltrated macrophages exerted immune functions to exhibit anti-tumor effects. Other reports have shown high expression of CFB in pancreatic cancer and cutaneous squamous cell carcinoma, thus confirming the association between the CFB expression and carcinogenesis [Citation39,Citation40].
To date, the correlation between THCA and the CFB expression remains unclear. Here, we evaluated TME and TICs to identify the possible role of the CFB in the growth and progression of THCA [Citation41,Citation42]. However, previous studies have reported gene signatures that define the growth and progression of THCA. IL1RN may promote thyroid cancer progression through immune-related pathways, and it could be a potential biomarker correlated to the diagnosis and prognosis of THCA [Citation43]. Besides, ADORA1 was overexpressed and played an oncogenic role in PTC. Therefore, it can be a diagnostic and a prognostic biomarker [Citation44]. In this study, we focused on the gene signatures in complex TME, which affected the progression and prognosis of THCA. The expression of CFB was closely associated with the prognosis of THCA. Thus, CFB might be used as a potential marker for the prognosis of THCA.
However, it was difficult to precisely determine the mechanisms of CFB on TME or TICs in THCA patients. Besides, clinical information from the TCGA database was incomplete, thus we did not perform a comprehensive prognostic evaluation.
Conclusions
Taken together, we explored the role of TME in THCA and identified CFB, which could be used as a potential and promising marker for patients with THCA.
Authors’ contributions
WP performed the data analysis and wrote the manuscript. JS performed the experiments. SW and ZH reviewed and revised the manuscript. All authors read and approved the final manuscript.
Declarations
Ethics approval and consent to participate
The research was approved by the Institutional Research Ethics Committees of the First Affiliated Hospital of China Medical University.
Availability of Data and Materials
Gene expression profiles and clinical data of THCA in this study are available from the public database (TCGA, https://portal.gdc.cancer.gov/ and GEO, https://www.ncbi.nlm.nih.gov/geo/).
Declarations
The authors declare that the research was conducted in the absence of any commercial or financial relationships that could be construed as a potential conflict of interest.
Acknowledgements
We acknowledge the Cancer Genome Atlas (TCGA) database and the Gene Expression Omnibus (GEO) database for uploading their meaning datasets.
Disclosure statement
No potential conflict of interest was reported by the author(s).
Additional information
Funding
References
- Bray F, et al. Global cancer statistics 2018: GLOBOCAN estimates of incidence and mortality worldwide for 36 cancers in 185 countries. CA Cancer J Clin. 2018;68:394–424. doi:10.3322/caac.21492.
- Scoazec JY, Couvelard A, Réseau T. [Classification of pancreatic neuroendocrine tumours: changes made in the 2017 WHO classification of tumours of endocrine organs and perspectives for the future]. Ann Pathol. 2017;37:444–456.
- Ito Y, Nikiforov YE, Schlumberger M, et al. Increasing incidence of thyroid cancer: controversies explored. Nat Rev Endocrinol. 2013;9:178–184.
- Seib CD, Sosa JA. Evolving Understanding of the Epidemiology of Thyroid Cancer. Endocrinol Metab Clin North Am. 2019;48:23–35.
- Siegel R, Naishadham D, Jemal A. Cancer statistics, 2013. CA Cancer J Clin. 2013;63:11–30.
- Scharpf J. Achieving Active Surveillance for Thyroid Cancer-Not a Euphemism for Watching a Ticking Time Bomb. JAMA Otolaryngol Head Neck Surg. 2017;143:1021–1022.
- Vaccarella S, et al. Worldwide Thyroid-Cancer Epidemic? The Increasing Impact of Overdiagnosis. N Engl J Med. 2016;375:614–617. doi:10.1056/NEJMp1604412.
- Haugen BR, et al. 2015 American Thyroid Association Management Guidelines for Adult Patients with Thyroid Nodules and Differentiated Thyroid Cancer: the American Thyroid Association Guidelines Task Force on Thyroid Nodules and Differentiated Thyroid Cancer. Thyroid. 2016;26:1–133. doi:10.1089/thy.2015.0020.
- Raue F, Frank-Raue K. Thyroid Cancer: risk-Stratified Management and Individualized Therapy. Clin Cancer Res. 2016;22:5012–5021.
- Quail DF, Joyce JA. Microenvironmental regulation of tumor progression and metastasis. Nat Med. 2013;19(1423–1437). DOI:10.1038/nm.3394
- Fidler IJ. The pathogenesis of cancer metastasis: the ‘seed and soil’ hypothesis revisited. Nat Rev Cancer. 2003;3:453–458.
- Fan T, et al. Immune profile of the tumor microenvironment and the identification of a four-gene signature for lung adenocarcinoma. Aging (Albany NY). 2020;12. DOI:10.18632/aging.202269.
- Privat-Maldonado A, Bengtson C, Razzokov J, et al. Modifying the Tumour Microenvironment: challenges and Future Perspectives for Anticancer Plasma Treatments. Cancers (Basel). 2019;11. DOI:10.3390/cancers11121920.
- Şenbabaoğlu Y, et al. Tumor immune microenvironment characterization in clear cell renal cell carcinoma identifies prognostic and immunotherapeutically relevant messenger RNA signatures. Genome Biol. 2016;17(231). DOI:10.1186/s13059-016-1092-z
- Hanahan D, Coussens LM. Accessories to the crime: functions of cells recruited to the tumor microenvironment. Cancer Cell. 2012;21:309–322.
- Jiang Y, Han QJ, Zhang J. Hepatocellular carcinoma: mechanisms of progression and immunotherapy. World J Gastroenterol. 2019;25:3151–3167.
- Bi KW, Wei XG, Qin XX, et al. BTK Has Potential to Be a Prognostic Factor for Lung Adenocarcinoma and an Indicator for Tumor Microenvironment Remodeling: a Study Based on TCGA Data Mining. Front Oncol. 2020;10(424). DOI:10.3389/fonc.2020.00424
- Xu L, et al. The role of CCR2 in prognosis of patients with endometrial cancer and tumor microenvironment remodeling. Bioengineered. 2021;12:3467–3484. doi:10.1080/21655979.2021.1947631.
- Wang T, Chen B, Meng T, et al. Identification and immunoprofiling of key prognostic genes in the tumor microenvironment of hepatocellular carcinoma. Bioengineered. 2021;12:1555–1575.
- Jolly LA, et al. Fibroblast-Mediated Collagen Remodeling Within the Tumor Microenvironment Facilitates Progression of Thyroid Cancers Driven by BrafV600E and Pten Loss. Cancer Res. 2016;76:1804–1813. doi:10.1158/0008-5472.CAN-15-2351.
- Yoshihara K, et al. Inferring tumour purity and stromal and immune cell admixture from expression data. Nat Commun. 2013;4: 2612. DOI:10.1038/ncomms3612
- Chakraborty H, Hossain A. R package to estimate intracluster correlation coefficient with confidence interval for binary data. Comput Methods Programs Biomed. 2018;155(85–92). DOI:10.1016/j.cmpb.2017.10.023
- Yang SYC, et al. Landscape of genomic alterations in high-grade serous ovarian cancer from exceptional long- and short-term survivors. Genome Med. 2018;10(81). DOI:10.1186/s13073-018-0590-x
- Kanehisa M, Goto S. KEGG: kyoto encyclopedia of genes and genomes. Nucleic Acids Res. 2000;28:27–30.
- Shannon P, et al. Cytoscape: a software environment for integrated models of biomolecular interaction networks. Genome Res. 2003;13:2498–2504. doi:10.1101/gr.1239303.
- Subramanian A, et al. Gene set enrichment analysis: a knowledge-based approach for interpreting genome-wide expression profiles. Proc Natl Acad Sci U S A. 2005;102:15545–15550. doi:10.1073/pnas.0506580102.
- Calo PG, et al. Intraoperative neuromonitoring in thyroid surgery: is the two-staged thyroidectomy justified? Int J Surg. 2017;41(Suppl 1):S13–S20. doi:10.1016/j.ijsu.2017.02.001.
- Conzo G, et al. The current status of lymph node dissection in the treatment of papillary thyroid cancer. A literature review. Clin Ter. 2013;164:e343–346. doi:10.7417/CT.2013.1599.
- Pezzolla A, et al. [Incidental thyroid carcinoma: a multicentric experience]. Recenti Prog Med. 2010;101:194–198.
- Zhang S, et al. PD-L1 and CD4 are independent prognostic factors for overall survival in endometrial carcinomas. BMC Cancer. 2020;20:127. DOI:10.1186/s12885-020-6545-9
- van Den Meiracker AH, Danser AH, Sleijfer S, et al. Re: hypertension as a biomarker of efficacy in patients with metastatic renal cell carcinoma treated with sunitinib. J Natl Cancer Inst. 2011;103:1557. author reply 1558
- Cao J, et al. Screening and Identifying Immune-Related Cells and Genes in the Tumor Microenvironment of Bladder Urothelial Carcinoma: based on TCGA Database and Bioinformatics. Front Oncol. 2019;9:1533. DOI:10.3389/fonc.2019.01533
- Siegel RL, Miller KD, Jemal A. Cancer Statistics, 2017. CA Cancer J Clin. 2017;67:7–30.
- Wang J, et al. CD52 Is a Prognostic Biomarker and Associated With Tumor Microenvironment in Breast Cancer. Front Genet. 2020;11: 578002. DOI:10.3389/fgene.2020.578002
- Porcelli T, Sessa F, Luongo C, et al. Local ablative therapy of oligoprogressive TKI-treated thyroid cancer. J Endocrinol Invest. 2019;42(871–879). DOI:10.1007/s40618-019-1001-x
- Xu ZY, et al. Analysis of prognostic genes in the tumor microenvironment of lung adenocarcinoma. PeerJ. 2020;8:e9530. DOI:10.7717/peerj.9530
- Revel M, Daugan MV, Sautes-Fridman C, et al. Complement System: promoter or Suppressor of Cancer Progression? Antibodies (Basel). 2020;9. DOI:10.3390/antib9040057.
- Liu J, et al. ATP2C2 Has Potential to Define Tumor Microenvironment in Breast Cancer. Front Immunol. 2021;12:657950. DOI:10.3389/fimmu.2021.657950
- Riihila P, et al. Complement Component C3 and Complement Factor B Promote Growth of Cutaneous Squamous Cell Carcinoma. Am J Pathol. 2017;187:1186–1197. doi:10.1016/j.ajpath.2017.01.006.
- Kim SH, et al. Prognostic potential of the preoperative plasma complement factor B in resected pancreatic cancer: a pilot study. Cancer Biomark. 2019;24:335–342. DOI:10.3233/CBM-181847
- Cayrol F, Sterle HA, Díaz Flaqué MC, et al. Non-genomic Actions of Thyroid Hormones Regulate the Growth and Angiogenesis of T Cell Lymphomas. Front Endocrinol (Lausanne). 2019;10(63). DOI:10.3389/fendo.2019.00063
- Ferrari SM, et al. Immune and Inflammatory Cells in Thyroid Cancer Microenvironment. Int J Mol Sci. 2019;20. DOI:10.3390/ijms20184413.
- Xie Z, et al. Analysis of the expression and potential molecular mechanism of interleukin-1 receptor antagonist (IL1RN) in papillary thyroid cancer via bioinformatics methods. BMC Cancer. 2020;20:1143. DOI:10.1186/s12885-020-07620-8
- Lin X, et al. ADORA1 is a diagnostic-related biomarker and correlated with immune infiltrates in papillary thyroid carcinoma. J Cancer. 2021;12:3997–4010. DOI:10.7150/jca.50743