
ABSTRACT
Optic atrophy 3 (OPA3) is an integral protein of the mitochondrial outer membrane. The current study explored the expression of OPA3 in hepatocellular carcinoma (HCC), its association with the prognosis and its involvement in HCC cell proliferation and aerobic glycolysis. In addition, the transcription factors that activate its expression were screened and validated. Gene expression data in normal liver and liver cancer were acquired from the Genotype-Tissue Expression Project (GTEx) and The Cancer Genome Atlas (TCGA)-Liver Hepatocellular Carcinoma (TCGA-LIHC). Chromatin immunoprecipitation-seq data (GSM1010876) in Cistrome Data Browser was used for searching transcriptional factors binding to the OPA3 promoter. HCC cell lines HLF and JHH2 were used for in-vitro and in-vivo studies. Results showed that OPA3 is significantly upregulated in HCC and associated with unfavorable prognosis. OPA3 knockdown impaired HCC cell growth in vitro and in vivo. Besides, it decreased glucose uptake, lactate production, intracellular ATP levels, and extracellular acidification rate (ECAR) of HLF and JHH2 cells. MYB Proto-Oncogene Like 2 (MYBL2) can bind to the promoter of OPA3 and enhance its transcription. MYBL2 knockdown decreased aerobic glycolysis in HCC cells. OPA3 overexpression reversed these alterations. In conclusion, this study revealed a novel MYBL2-OPA3 axis that enhances HCC cell proliferation and aerobic glycolysis.
Introduction
Hepatocellular carcinoma (HCC) is one of the most common malignancies globally and is the 5th and 7th leading cause of cancer-related death in men and women, respectively [Citation1]. It accounts for over 75% of all primary liver cancers [Citation1]. Since HCC in the early-stages is often asymptomatic, patients are usually diagnosed at intermediate or advanced stages, thus missing the best opportunities for curative treatments [Citation2]. Local recurrence and distant metastasis are major causes of cancer-related death. For all HCC cases, the estimated 5-year survival rate is only 18% [Citation3].
Aerobic glycolysis is a hallmark of HCC [Citation4,Citation5]. HCC cells have increased glucose uptake and are prone to utilize glycolysis but not oxidative phosphorylation as a major energy source, even under normoxic conditions [Citation6]. This metabolic alteration is known as the Warburg effect [Citation6]. Although the efficiency of adenosine triphosphate (ATP) production is significantly lower in aerobic glycolysis, it accounts for around 47–70% of ATP supply in different tumors [Citation6]. Elevated aerobatic glycolysis is directly associated with a series of malignant tumor behaviors, such as cell proliferation, epithelial-to-mesenchymal transition, invasion, angiogenesis, metastasis, and chemo-/radio-resistance [Citation4,Citation7]. The mechanisms underlying abnormally activated aerobic glycolysis in HCC cells are complex. Dysregulated glycolytic rate-limiting enzymes and proteins, such as hexokinase 2 (HK2), phosphofructokinase 1 (PFK1), Phosphoglycerate Kinase 1 (PGK1), and glucose transporter 1 (GLUT1) play critical roles in energy metabolism reprogramming [Citation4,Citation8]. Some recent studies found that mitochondrial fission is associated with enhanced aerobic glycolysis [Citation9–11].
Optic atrophy 3 (OPA3) has been characterized as an integral mitochondrial outer membrane protein [Citation12]. It might be a regulator of lipid metabolism, coupling lipid uptake with lipid processing in the liver [Citation13]. One previous study found that OPA3 has a critical role in modulating mitochondrial fission [Citation12]. Its overexpression induces mitochondrial fragmentation, whereas its knockdown increases highly elongated mitochondria [Citation12]. One recent study revealed that in K-ras-driven pancreatic cancer, OPA3 expression could be upregulated by K-ras activation, thereby promoting the alteration in cellular energy metabolism [Citation14]. However, the expression of OPA3, its functional role, and the mechanisms underlying its dysregulation in HCC remain poorly understood.
MYB Proto-Oncogene Like 2 (MYBL2) belongs to the MYB family of transcription factor genes [Citation15]. It can be phosphorylated by cyclin A/cyclin-dependent kinase 2 (CDK2) during the S-phase [Citation16]. Via binding to the gene promoters, it can act transcriptional activator or repressor, regulating the expression of multiple genes regulating cell cycle progression, proliferation, and differentiation of multiple cancers [Citation15,Citation17].
In this study, we aimed to explore the regulatory effect of OPA3 on HCC tumor growth and glycolysis. Then, we screened the transcriptional factors that bind to the OPA3 promoter and regulate its transcription.
Materials and methods
Bioinformatic analysis
Gene expression data, including transcript expression in primary liver cancer cases (n = 369) and adjacent normal tissues (n = 50) were extracted from The Cancer Genome Atlas (TCGA)-Liver Hepatocellular Carcinoma (TCGA-LIHC). Besides, its expression in normal liver tissues was acquired from Genotype-Tissue Expression Project (GTEx) (n = 110). Data extraction was performed using the UCSC Xena Browser (https://xenabrowser.net/) [Citation18], from the TCGA-Therapeutically Applicable Research to Generate Effective Treatments (TARGET)-GTEx dataset. To assess the association between gene expression and survival outcome (overall survival, OS and progression-free survival, PFS), survival data from HCC patients with primary tumors were also extracted. Youden Index [Citation19] for death detection (the gene expression point with the maximum value of area under the curve) was identified in receiver operating characteristic (ROC) analysis. This index was applied as the cutoff for patient separation in Kaplan-Meier (K-M) survival analysis. Immunohistochemistry (IHC) in HCC tissues was obtained from the Human Protein Atlas (HPA) [Citation20].
The potential transcription factors and chromatin regulators with binding in the promoter region of OPA3 in HepG2 were retrieved by using one previous ChIP-seq data (GSM1010876) [Citation21] recorded in the Cistrome Data Browser (http://cistrome.org/db/#/) [Citation22].
Cell culture and treatment
Normal liver parenchyma cells (CP-H043) were obtained from Procell (Wuhan, China). HCC cell lines HLF and JHH2 were purchased from Cobioer (Nanjing, China). Another two HCC lines, Huh1 and HepG2 were obtained from the American Type Culture Collection (Manassas, VA, USA). These cells were cultured according to the recommended methods according to the providers’ instructions. Three OPA3 and two MYBL2 shRNAs were generated based on the predesigned shRNA sequences obtained from Sigma-Aldrich (St. Louis, MO, USA) and the pLKO.1-puro backbone. The shRNA sequences are as following: shOPA3#1, 5ʹ-CGAGTTCTTCAAGACCTATAT-3ʹ; shOPA3#2, 5ʹ-GAAGCTGCTATACTTGGGCAT-3ʹ; shOPA3#3, 5ʹ-ACTGTATCACTGGGTGGAGAT-3ʹ; shMYBL2#1, 5ʹ- CCCAGATCAGAAGTACTCCAT-3ʹ; shMYBL2#2, 5ʹ- GCTTGGTGTGACCTGAGTAAA-3ʹ. Lentiviral OPA3 (NM_025136) overexpression particles (OPA3-OE) were generated based on the pLenti-CMV-puro backbone. Each shRNA or overexpression vector was co-transfected into 293 T cells with the packaging plasmids pMDLg/pRRE and pRSV-Rev and the envelope plasmid pMD2.G, using FuGENE 6 transfection reagent (Promega, Madison, WI, USA). HLF and JHH2 cells were infected with lentivirus in the presence of polybrene (8 µg/ml). 36 h after infection, the cells were selected via adding puromycin (0.7 μg/mL) for another 36 h to eliminate the non-infected cells.
Quantitative reverse transcriptase PCR (qRT-PCR) assay
QRT-PCR assay was performed following the protocols introduced previously [Citation23]. Total RNA was extracted with TRIzol reagent (ThermoFisher, Waltham, MA, USA) and was reversely transcribed into cDNA using High-Capacity cDNA Reverse Transcription Kit (ThermoFisher), following the manufacturer’s protocols. qRT-PCR was conducted using 7900HT Fast Real-Time PCR System (ThermoFisher), with TaqMan Gene Expression Master Mix (ThermoFisher). Relative gene expression was analyzed using the 2−ΔΔCt method, using ACTB expression as a reference control. The following primer sequences were used: OPA3, 5′-CCGCTTGCCAACCGTATTAAGG-3′ (forward) and 5′-TCCTCGTTCAGCGGCTTGATGA-3′ (reverse); MYBL2, 5′-CACCAGAAACGAGCCTGCCTTA-3′ (forward) and 5′-CTCAGGTCACACCAAGCATCAG-3′ (reverse); ACTB, 5′- CACCATTGGCAATGAGCGGTTC-3′ (forward) and 5′- AGGTCTTTGCGGATGTCCACGT-3′ (reverse).
Western blotting
Cell samples were washed and lysed with RIPA buffer with protease inhibitor cocktail. Total protein concentration was measured using the Pierce BCA Assay Kit (ThermoFisher). 25 μg protein samples were loaded to each lane and were separated by sodium dodecyl sulfate-polyacrylamide gel electrophoresis (SDS-PAGE) (10%) and transferred onto polyvinylidene fluoride (PVDF) membranes. Membranes were blocked and then probed with the indicated primary antibody at 4°C overnight. The membranes were washed in Tris-buffered saline, 0.1% Tween 20 (TBST), before 1 h incubation with the secondary anti-rabbit or anti-mouse IgG labeled with horseradish peroxidase (HRP) at room temperature. β-actin antibody was used as a protein-loading control. Protein signals were developed using the SuperSignal West Dura Extended Duration Substrate (ThermoFisher) [Citation24]. The following primary antibodies were used: anti-OPA3 (1:1000, 15,638-1-AP, Proteintech, Wuhan, China), anti-MYBL2 (1:1000, 18,896-1-AP, Proteintech), anti-GLUT1 (1:2000, 21,829-1-AP, Proteintech), anti-HK2 (1:2000, 22,029-1-AP, Proteintech), anti-PGK1 (1:1000, 17,811-1-AP, Proteintech), anti-PGAM1 (1:2000, 16,126-1-AP, Proteintech), anti-LDHA (1:4000, 19,987-1-AP, Proteintech), and anti-β-actin (1:2000, 20,536-1-AP, Proteintech).
Cell Counting Kit-8 (CCK-8) assay of cell viability and colony formation assay
HLF and JHH2 cells with or without lentiviral mediated OPA3 knockdown were plated in 96-well plates at a density of 1.5 × 10³ cells per well and were cultured for different periods (24 h, 48 h, and 72 h). At the indicating time points, CCK-8 reagent (Beyotime, Shanghai, China) was added for 2 h. Then, the optical density (OD) values were measured at 450 nm. The results are representative of at least three independent experiments. Cell viability curves were generated based on three technical repeats [Citation25].
For colony formation assay, HLF (500 cells/well) and JHH2 (500 cells/well) cells were plated in 6-well plates. Media were refreshed every other day. After 14 days of culture, the colonies were fixed in methanol for 30 min and stained using crystal violet solution. The numbers of colonies were counted and analyzed by ImageJ software.
Xenograft tumor models
Animal studies were approved by The Animal Care and Use Committee of Hospital of Chengdu University of Traditional Chinese Medicine, China. 24 male nude mice (BALB/c nu/nu) aged between 4–6 weeks were purchased from Vital River Laboratories (Beijing, China). The mice were randomly divided into four groups (n = 6 per group). 5 × 10⁶ cells in 100 μl phosphate-buffered saline (PBS) and Matrigel (v/v = 1:1) with or without lentiviral mediated OPA3 knockdown were subcutaneously implanting into the nude mice. The size of the tumor was measured every 3 days. Tumor volume was calculated using the following formula: V = 0.5 × length × width2. Mice were sacrificed after 30 days, and then tumors were removed and sectioned. Ki-67 staining and DNA counterstain with 4′,6-diamidino-2-phenylindole (DAPI) was performed on the tumor sections [Citation26].
Immunofluorescent (IF) staining
IF staining was conducted following the method described previously [Citation27]. HLF and JHH2 cells grown on coverslips were fixed in 4.0% polyformaldehyde, washed with PBS, and then treated with permeabilization solution (PBS, 0.25% Triton X-100) for 10 min. After washing, cells were blocked with 3% bovine serum albumin in PBS for 1 h at room temperature. Then, the coverslips were incubated with anti-MYBL2 (1:200, 18,896-1-AP, Proteintech) overnight at 4°C, followed by incubation with an Alexa Fluor 488-labeled goat anti-rabbit IgG at room temperature for 1 h. Nuclei were counterstained using 2 μg/ml of DAPI in PBS for 5 min. Coverslips were mounted. IF images were captured using a fluorescence microscopy (IX81, Olympus, Tokyo, Japan).
Chromatin immunoprecipitation (ChIP)
ChIP experiments were conducted following the methods described previously [Citation28]. In brief, cells were fixed in 1% formaldehyde and then quenched with 125 mM glycine for 5 min. Cells were lysed in a cell lysis buffer. Samples were then sonicated until most DNA was sheared to 200 to 500 bp. Chromatin from 3 × 10⁶ cells was incubated with 8 µg anti-MYBL2 (18,896-1-AP, Proteintech) to precipitate target regions. The same amount (8 µg) of normal rabbit IgG antibody (30,000-0-AP, Proteintech) was used as a negative control for nonspecific binding. Each experiment was replicated three times. Relative expression was normalized as a percentage of input (total chromosomal DNA). The % input for each output fraction was calculated according to the formula: %Input = [2(CtInput-CtOutput) × DF] × 100%, in which DF refers to input dilution factor). The following primers were used for ChIP-qPCR: amplicon 1, 5′-CCCAGGTTCAAGCGATTCT-3′ (forward) and 5′- CGTGAAATCCCATCTCCACTAA-3′ (reverse); amplicon 2, 5′-GTGACATCACGAAGGAGTACAG-3′ (forward) and 5′-TGCAAATATACACGGAAGTGAGG-3′ (reverse). The results are representative of at least three independent experiments.
Dual-luciferase assay
The integrated promoter sequence of OPA3 (Supplementary ) and the mutant promoter segments were chemically synthesized and cloned into the pGL3-basic luciferase vector (Promega). Luciferase constructs were co-transfected with pRL-TK (Renilla luciferase, Promega) using FuGENE 6 transfection reagent (Promega) into HLF and JHH2 cells with or without MYBL2 knockdown. Cells were harvested 24 h following transfection, and luciferase expression was measured using the Dual-Luciferase Reporter Assay System (Promega). Firefly activity was normalized to pRL-TK to control for transfection efficiency [Citation28]. The results are representative of at least three independent experiments.
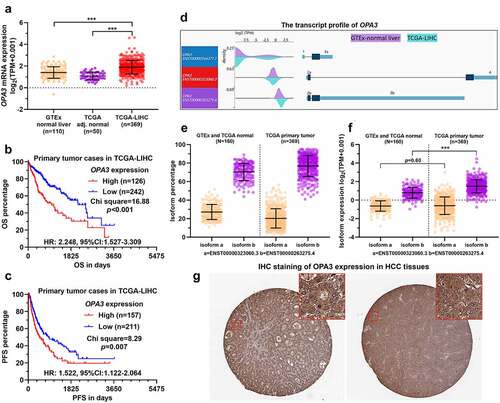
Figure 1. OPA3 upregulation was associated with poor prognosis of patients with HCC A. Characterization of OPA3 mRNA expression in HCC tissues from TCGA (n = 369), HCC adjacent normal tissues from TCGA (n = 50) and normal liver tissues (n = 110) from GTEx. Welch’s unpaired t-test was performed. B-C. K-M survival analysis of the difference in OS (b) and PFS (c) between HCC cases with high and low OPA3 mRNA expression. Patients were separated into two groups according to the Youden Index in ROC analysis for death detection. Log-rank (Mantel-Cox) test was performed. D. A wave diagram showing the exonic expression of three OPA3 transcripts in HCC tissues from TCGA (n = 369) and normal liver tissues (n = 110) from GTEx. E-F. Characterization of OPA3 isoform expression (ENST00000323060.3 and ENST00000263275.4), in terms of isoform percentage (e) and normalized isoform expression (f). Welch’s unpaired t-test was performed. G. IHC staining of OPA3 in human HCC tissues. Images were retrieved from the HPA via the following links: https://www.proteinatlas.org/ENSG00000125741-OPA3/pathology/liver+cancer#ihc.
Measurement of glycolysis relevant indicators
Quantitative kits were used to measure glucose uptake (ab136955, Abcam, Cambridge, UK), L-lactate production (ab65331, Abcam), intracellular ATP (ab113849, Abcam) level, following the manufacturer’s protocols. Extracellular acidification rate (ECAR) and oxygen consumption rate (OCR) were measured using the glycolytic stress test kit and cell mito stress test kit, respectively (Cat. #103,020-100 and 103,015–100, Seahorse Bioscience, Agilent, Santa Clara, CA, USA), with a Seahorse XF96 Flux Analyzer (Seahorse Bioscience), according to the manufacturer’s instruction. The experiment was repeated three times with three repeats [Citation29].
Statistical analysis
Results are presented as mean ± SD from three independent experiments unless otherwise indicated. Statistical analysis was performed using GraphPad Prism 8.10. The difference between K-M survival curves was analyzed using the Log-rank test. Unpaired Welch’s t-test and one-way ANOVA were applied to analyze differences in expression among the groups. Correction analysis was performed by calculating Pearson’s correlation coefficients. p-values < 0.05 were considered significant.
Results
OPA3 upregulation was associated with poor prognosis of patients with HCC
This study aimed to explore the regulatory effect of OPA3 on HCC tumor growth and aerobic glycolysis and the transcriptional factors regulating OPA3 transcription. Based on RNA-seq data extracted from TCGA and GTEx, we checked the expression and transcript profile of OPA3 in HCC and normal tissues. Results showed that OPA3 expression was significantly higher in the tumor group (n = 369) than in the adjacent normal (n = 110) and GTEx-normal (n = 50) groups ()). Then, we generated K-M curves to compare the differences in OS and PFS between patients with high and low OPA3 expression. The Youden index for death and progression detection in ROC analysis was used as the cutoff to separate patients (Supplementary ). AUC of OPA3 for detecting death and progression were 0.540 (95%CI: 0.476–0.604, p = 0.207) and 0.513 (95%CI: 0.454–0.573, p = 0.657) respectively (Supplementary ). Therefore, OPA3 expression might not be a biomarker with independent prognostic value.
Figure 2. OPA3 upregulation increases HCC tumor growth in-vitro and in-vivo A-B. Characterization of OPA3 mRNA expression by qRT-PCR (a) and protein expression by Western blotting (b) in normal liver parenchyma cells (CP-H043), and HCC cell lines, including Huh1, HLF, JHH2, and HepG2. One-way ANOVA with post-hoc Dunnett’s multiple comparisons test was performed by setting CP-H043 as the control group. C-D. OPA3 mRNA expression (c) and protein expression (d) in HLF and JHH2 cells after lentiviral mediated OPA3 knockdown (36 h) and transient (36 h) puromycin selection. For detecting the difference in mRNA expression, one-way ANOVA with post-hoc Dunnett’s multiple comparisons test was performed by setting shNC as the control group. E-F. CCK-8 assay was performed to measure the viability of HLF (e) and JHH2 (f) cells after lentiviral mediated OPA3 knockdown. *, comparison between shNC and shOPA3#1; #, comparison between shNC and shOPA3#2. Welch’s unpaired t-test was performed. G-J. Representative images and quantitation of colony formation assay was performed to measure the colony formation of HLF (E) and JHH2 (F) cells after lentiviral mediated OPA3 knockdown. Welch’s unpaired t-test was performed. K-Q. Representative images (k and o), growth curves (l and p) and IHC staining of Ki-67 (m and q) of xenograft tumors derived from HLF (k-m) and JHH2 (o-q) cells after lentiviral mediated OPA3 knockdown. Welch’s unpaired t-test was performed. Data are shown as means ± SD, n = 3 (except for animal studies, where n = 6). Scale bar = 50 μm. ** and ##, p < 0.01; *** and ### p < 0.001.

Survival analysis indicated the patients with high OPA3 expression (n = 126) had remarkedly worse OS (HR = 2.248, 95%CI: 1.527–3.309, p < 0.001) compared to the low OPA3 expression (n = 242) counterparts ()). The high OPA3 expression groups (n = 157) also had significantly worse PFS (HR = 1,522, 95%CI: 1.122–2.064, p = 0.007, )). Among the two protein-coding transcripts, isoform b (ENST00000263275) was the dominant form in normal and tumor groups (). In addition, only isoform b was significantly upregulated in the HCC group ()). With IHC data retrieved from the HPA database, we confirmed positive medium to high OPA3 expression at the protein level in HCC tissues ()).
OPA3 upregulation increases HCC tumor growth in-vitro and in-vivo
By performing qRT-PCR and Western blot assay, we examined OPA3 expression in normal liver parenchyma cells (CP-H043), and HCC cell lines, including Huh1, HLF, JHH2, and HepG2. Results confirmed elevated OPA3 expression at both mRNA and protein levels in HCC cell lines (). Then, HLF and JHH2 cells, which were characterized as the mtDNA-less type [Citation30] used as representative cell lines for further studies. In these cells, high MYBL2 and FOXM1 expression and their binding are critical for sustaining cell proliferation [Citation30]. Besides, these cell lines exhibit high glycolysis levels and are more resistant to mitochondrial inhibitors and biguanide drugs [Citation31]. Therefore, they are optimal cell models for this study. Both cell lines were infected with OPA3 shRNA (). In vitro studies showed that OPA3 knockdown significantly suppressed the viability (), colony formation () of HLF and JHH2 cells. In vivo xenograft tumor studies showed that HLF and JHH2 cells with OPA3 knockdown had significantly slower tumor growth rates (, O-P), as well as a smaller proportion of Ki-67 positive cells () and q). When mice were sacrificed, no significant difference was observed in body weight among the tumor-bearing mice groups.
OPA3 expression was transcriptionally activated by MYBL2 in HCC cells
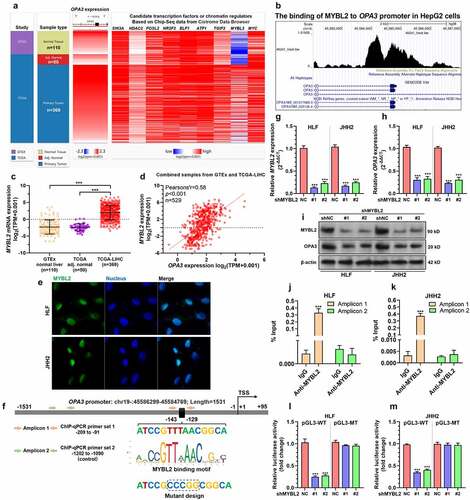
To explore the mechanisms underlying OPA3 dysregulation, we identified multiple potential transcription factors and chromatin regulators with binding in the promoter region of OPA3 DNA in HepG2 cells, based on ChIP-seq data (GSM1010876) [Citation21] recorded in the Cistrome Data Browser. Some candidates, including SIN3A, HDAC2, FOSL2, ELF1, ATF1, GABP, TGIF2, MYBL2, and MYC were identified. Their expression profiles in normal liver, HCC, and HCC adjacent normal tissues were provided in ). MYBL2, which had strong binding to the OPA3 promoter (), triggered our interest. It had quite distinctive expression profiles in normal and HCC tissues ()). Both normal liver (n = 110) and tumor-adjacent normal tissues (n = 50) had very low MYBL2 expression (mean log2(TPM+0.001) around −2) ()). LIHC tissues had approximately 16-fold higher MYBL2 expression (mean log2(TPM+0.001) around 2) compared to the normal groups ()). Correlation analysis confirmed a strong positive correlation (Pearson’s r = 0.58, p < 0.001) between MYBL2 and OPA3 expression in the normal liver than HCC tissues ()). IF staining indicated that MYBL2 is expressed in the nuclei of HCC cells ()). Via promoter scanning, we found a high potential MYBL2 binding site at −143 to −129 in the OPA3 promoter ()). Therefore, we decided to verify the transcriptional activating effect of MYBL2 on OPA3 expression in HCC cells. Both HLF and JHH2 cells were subjected to lentiviral mediated MYBL2 knockdown () and i). MYBL2 knockdown significantly reduced OPA3 expression at the mRNA and protein levels (). Then, ChIP-qPCR analysis was conducted using anti-MYBL2 and IgG control, using the lysates of HLF and JHH2 cells. Results confirmed a significantly higher enrichment of amplicon 1 (covering the predicted MYBL2 binding site) in the anti-MYBL2 group than the IgG control group (). In comparison, no significant difference was observed in the enrichment of amplicon 2 between anti-MYBL2 and the IgG control groups (). Luciferase reporter plasmids carrying integrated wild-type OPA3 promoter (pGL3-WT) or mutant OPA3 promoter (), pGL3-MT) were generated and were transfected into HLF and JHH2 cells with or without MYBL2 knockdown. MYBL2 knockdown significantly reduced the luciferase expression of pGL3-WT, but not pGL3-MT in both cell lines ().
Figure 3. OPA3 expression was transcriptionally activated by MYBL2 in HCC cells A. A heatmap showing the expression profiles of potential transcription factors and chromatin regulators with binding in the promoter region of OPA3 in HepG2 cells, based on ChIP-seq data (GSM1010876) recoded in the Cistrome Data Browser. B. The ChIP-Seq data (GSM1010876) from the Cistrome browser showed the binding of MYBL2 to the OPA3 promoter in HepG2 cells. C. Characterization of MYBL2 mRNA expression in HCC tissues from TCGA (n = 369), HCC adjacent normal tissues from TCGA (n = 50) and normal liver tissues (n = 110) from GTEx. Welch’s unpaired t-test was performed. D. Pearson’s analysis showing the correlation between expression of OPA3 and MYBL2 in normal liver and HCC tissues. E. IF staining of MYBL2 (blue) expression in HLF and JHH2 cells. F. A schematic image showing OPA3 promoter structure, MYBL2 binding motif, the predicted binding site and the position of primers designed for ChIP-qPCR assay. The mutant design for the dual-luciferase assay was also provided. G-I. MYBL2 and OPA3 mRNA expression (g-h) and protein expression (i) in HLF and JHH2 cells after lentiviral mediated MYBL2 knockdown (36 h) and transient (36 h) puromycin selection. Welch’s unpaired t-test was performed. J-K. ChIP-qPCR was performed to examine the relative enrichment (% of input) of the OPA3 promoter fragments (amplicon 1 and 2) in the DNA samples immunoprecipitated by anti-MYBL2 in HLF (j) and JHH2 (k) cell lysates. Welch’s unpaired t-test was performed. L-M. Dual-luciferase assay was conducted to measure the luciferase expression of pGL3-WT carrying wild-type OPA3 promoter and pGL3-MT reporter plasmids carrying mutant OPA3 promoter in HLF (l) and JHH2 (m) with or without MYBL2 knockdown. Welch’s unpaired t-test was performed. Data are shown as means ± SD, n = 3. ***p < 0.001.
The MYBL2-OPA3 axis enhances the aerobic glycolysis of HCC cells
Since OPA3 has been characterized as a mitochondrial protein involved in mitochondrial fragmentation [Citation12], we further explored whether it regulates aerobic glycolysis of HCC cells. Using quantitative assay kits, we confirmed that OPA3 knockdown decreased glucose uptake, lactate production, and intracellular ATP levels of HLF and JHH2 cells (). In addition, OPA3 knockdown significantly decreased ECAR of these two cell lines, which reflect reduced lactic acid production and hampered glycolytic capacity (). Since MYBL2 acts as an upstream regulator of OPA3 in HCC, we examined whether it modulates the aerobic glycolysis of HCC cells via OPA3. Both HLF and JHH2 cells were subjected to lentivirus-mediated MYBL2 knockdown, with or without OPA3 overexpression ()). Then, the alterations of some aerobic glycolysis-related transport and enzymes were examined by Western blotting. MYBL2 knockdown reduced the expression of GLUT1, PGK1, and PGAM1, the effect of which was reversed by OPA3 overexpression ()). In comparison, neither MYBL2 nor OPA3 had a regulative effect on HK2 and LDHA expression ()).
Figure 4. The MYBL2-OPA3 axis modulates aerobic glycolysis of HCC cells A-E. Measurement of glucose uptake (a), lactate production (b), intracellular ATP levels (c), and ECAR (d-e) of HLF and JHH2 cells with or without OPA3 knockdown. Welch’s unpaired t-test was performed. *, comparison between shNC and shOPA3#1; #, comparison between shNC and shOPA3#2. F. MYBL2, OPA3, GLUT1, HK2, PGK1, PGAM1 and LDHA protein expression in HLF and JHH2 cells after lentiviral mediated MYBL2 knockdown (36 h) and transient (36 h) puromycin selection alone or in combination with OPA3-OE. G-M. Measurement of glucose uptake (g), lactate production (h), intracellular ATP levels (i), ECAR (j and l) and OCR (k and m) of HLF and JHH2 cells with lentiviral mediated MYBL2 knockdown alone or in combination with OPA3-OE. Welch’s unpaired t-test was performed. * and #, p < 0.05; ** and ##, p < 0.01; *** and ### p < 0.001.
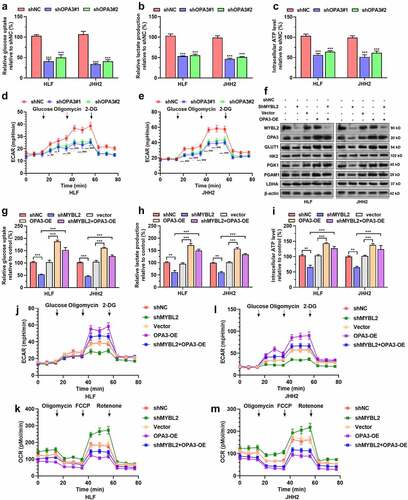
Colorimetric kit assays showed that MYBL2 knockdown significantly suppressed glucose uptake, lactate production, and intracellular ATP levels of HCC cells (). To further validate the regulatory effect of the MYBL2-OPA3 axis on aerobic glycolysis, we measured ECAR and OCR (a measure of oxygen utilization that reflects mitochondrial function) in the cells. MYBL2 knockdown significantly reduced ECAR and increased OCR (). OPA3 overexpression significantly elevated ECAR but lowered OCR (). In addition, the suppression of glycolysis caused by MYBL2 knockdown was largely abrogated by OPA3 overexpression (). These data suggested that OPA3 acted as a downstream effector of MYBL2 in modulating aerobic glycolysis.
Discussion
Bioinformatic analysis in the current study showed that OPA3 is significantly upregulated in HCC and associated with unfavorable prognosis. As an integral protein of the mitochondrial outer membrane, OPA3 expression can positively regulate mitochondrial fission [Citation12]. Increased mitochondrial fragmentation was quite common in lung, liver, colon, and breast cancer tissues [Citation29]. Mitochondrial dynamics can significantly alter tumor cell proliferation [Citation32]. Mitochondrial morphology shows stereotypical alterations during the cell cycle progression [Citation33]. They show tubulation during G1/S transition and present extensive fragmentation during mitosis [Citation34]. The latter stereotypical change ensures an equal distribution of mitochondria to the daughter cells. Besides, elevated mitochondrial fission can promote the survival of HCC cells both in vitro and in vivo predominantly by promoting G1/S transition, enhancing autophagy and suppressing mitochondria-dependent apoptosis [Citation35]. In this study, we explored the association between OPA3 expression and the proliferation of HCC cells and confirmed that OPA3 knockdown impaired HCC cell growth both in vitro and in vivo.
It is known that mitochondrial fragmentation can facilitate the elimination of mitochondria by mitophagy [Citation36]. Decreased mitochondrial mass partially contributes to the metabolic shift consisting of a reduction in oxidative respiration and a compensatory increase in glycolytic activity [Citation37]. Cancer cells showing Warburg-like physiology have a higher level of mitochondrial fragmentation than normal cells utilizing oxidative phosphorylation [Citation33]. OPA3 overexpression directly induces mitochondrial fragmentation [Citation12]. This alteration might be utilized by HCC cells as an adaptive strategy to elevate aerobic glycolysis. Our studies showed that OPA3 knockdown impaired aerobic glycolysis of HCC cells, which was reflected by decreased glucose uptake, lactate production, and ECAR. These findings imply that OPA3 might act as a regulator of energy metabolism in HCC.
By screening the transcriptional factors that stimulate its expression, we identified that MYBL2 could bind to the promoter of OPA3 and enhance its transcription. The oncogenic effects of MYBL2 in HCC have been widely reported [Citation38–40]. Its upregulation can enhance G1-S and G2-M cell cycle transition by activating a series of genes involved in signal transduction and cell proliferation [Citation38,Citation41]. The link between MYBL2 expression and electron transport chain (ETC) alteration had been reported in cancer cells [Citation42]. One recent study reported that in some mitochondrial DNA (mtDNA)-less HCC cells (such as HLF, JHH2, and JHH4), the high expression of MYBL2 and FOXM1 and their binding is critical for sustaining cell proliferation via maintaining the expression of cell cycle-related genes and suppressing the expression of p21 Cip1 [Citation30]. Elevated aerobic glycolysis supports protein synthesis, particularly in the G1 phase [Citation43]. Besides, it also limits the production of reactive oxygen species (ROS), which can be toxic for DNA replication [Citation43]. Therefore, these mechanisms also support MYBL2 mediated cell-cycle transition. In this study, we confirmed that MYBL2 knockdown significantly decreased aerobic glycolysis and the expression of some glycolysis-related regulators (GLUT1, PGK1, and PGAM1) in HCC cells. However, these effects were reversed by OPA3 overexpression. Therefore, we infer that besides the known regulation in cell-cycle, MYBL2 might also participate in energy metabolism in HCC cells via increasing the expression of OPA3.
This study also had some limitations. Although OPA3 has been characterized as a regulator of mitochondrial fragmentation, whether its upregulation serves as a causative mechanism of elevated mitochondrial fragmentation and aerobic glycolysis is not explored. In addition to promoting the proliferation of tumor cells, mitochondrial fission can induce an excessive release of mitochondrial DNA (mtDNA) into the cytosol (also known as mtDNA stress) can promote tumor-associated macrophage infiltration and HCC progression [Citation44]. Therefore, it is necessary to explore the regulatory effect of the MYBL2-OPA3 axis on the HCC microenvironment in the future. Besides, the potential phenotype differences between mt-DNA less and mt-DNA normal HCC cells were not compared. Furthermore, MYBL2 usually exerts transcriptional regulation via binding with FOXM1 [Citation17]. Whether the regulatory effects on aerobic glycolysis require FOXM1 should also be studied. The epigenetic mechanisms underlying OPA3 dysregulation might be quite complex. miRNA-mediated alterations might also be involved since OPA3 mRNA has eight predicted miR-619-5p binding sites [Citation45]. Relevant research could be performed in the future.
Conclusion
This study revealed a novel MYBL2-OPA3 axis that enhances HCC cell proliferation and aerobic glycolysis.
Data availability
The data and material used to support the findings of this study are available from the corresponding author upon request.
Supplemental Material
Download Zip (43.8 MB)Disclosure statement
No potential conflict of interest was reported by the author(s).
Supplementary material
Supplemental data for this article can be accessed here
Additional information
Funding
Related Research Data
References
- Siegel RL, Miller KD, Fuchs HE, et al. Cancer Statistics, 2021. CA Cancer J Clin. 2021;71(1):7–33.
- Reig M, Forner A, Avila MA, et al. Diagnosis and treatment of hepatocellular carcinoma. Update of the consensus document of the AEEH, AEC, SEOM, SERAM, SERVEI, and SETH. Med Clin (Barc). 2021;156:463 e461–463 e430.
- Ferrante ND, Pillai A, Singal AG. Update on the Diagnosis and Treatment of Hepatocellular Carcinoma. Gastroenterol Hepatol. 2020;16(10):506–516.
- Feng J, Li J, Wu L, et al. Emerging roles and the regulation of aerobic glycolysis in hepatocellular carcinoma. J Exp Clin Cancer Res. 2020;39(1):126.
- Shen H, Wu H, Sun F, et al. A novel four-gene of iron metabolism-related and methylated for prognosis prediction of hepatocellular carcinoma. Bioengineered. 2021;12(1):240–251.
- Koppenol WH, Bounds PL, Dang CV. Otto Warburg’s contributions to current concepts of cancer metabolism. Nat Rev Cancer. 2011;11(5):325–337.
- Liu YC, Lin P, Zhao YJ, et al. Pan-cancer analysis of clinical significance and associated molecular features of glycolysis. Bioengineered. 2021;12(1):4233–4246.
- Alves AP, Mamede AC, Alves MG, et al. Glycolysis Inhibition as a Strategy for Hepatocellular Carcinoma Treatment? Curr Cancer Drug Targets. 2019;19(1):26–40.
- Liang J, Yang Y, Bai L, et al. DRP1 upregulation promotes pancreatic cancer growth and metastasis through increased aerobic glycolysis. J Gastroenterol Hepatol. 2020;35(5):885–895.
- Li M, Shao J, Guo Z, et al. Novel mitochondrion-targeting copper(II) complex induces HK2 malfunction and inhibits glycolysis via Drp1-mediating mitophagy in HCC. J Cell Mol Med. 2020;24(5):3091–3107.
- Bao X, Zhang J, Huang G, et al. The crosstalk between HIFs and mitochondrial dysfunctions in cancer development. Cell Death Dis. 2021;12(2):215.
- Ryu SW, Jeong HJ, Choi M, et al. Optic atrophy 3 as a protein of the mitochondrial outer membrane induces mitochondrial fragmentation. Cell Mol Life Sci. 2010;67(16):2839–2850.
- Wells T, Davies JR, Guschina IA, et al. Opa3, a novel regulator of mitochondrial function, controls thermogenesis and abdominal fat mass in a mouse model for Costeff syndrome. Hum Mol Genet. 2012;21(22):4836–4844.
- Meng N, Glorieux C, Zhang Y, et al. Oncogenic K-ras Induces Mitochondrial OPA3 Expression to Promote Energy Metabolism in Pancreatic Cancer Cells. Cancers (Basel). 2019;12(1):65.
- Martinez I, Dimaio D. B-Myb, cancer, senescence, and microRNAs. Cancer Res. 2011;71(16):5370–5373.
- Joaquin M, Watson RJ. Cell cycle regulation by the B-Myb transcription factor. Cell Mol Life Sci. 2003;60(11):2389–2401.
- Sadasivam S, Duan S, DeCaprio JA. The MuvB complex sequentially recruits B-Myb and FoxM1 to promote mitotic gene expression. Genes Dev. 2012;26(5):474–489.
- Goldman MJ, Craft B, Hastie M, et al. Visualizing and interpreting cancer genomics data via the Xena platform. Nat Biotechnol. 2020;38(6):675–678.
- Fluss R, Faraggi D, Reiser B. Estimation of the Youden Index and its associated cutoff point. Biom J. 2005;47(4):458–472.
- Uhlen M, Oksvold P, Fagerberg L, et al. Towards a knowledge-based Human Protein Atlas. Nat Biotechnol. 2010;28(12):1248–1250.
- Gertz J, Savic D, Varley KE, et al. Distinct properties of cell-type-specific and shared transcription factor binding sites. Mol Cell. 2013;52(1):25–36.
- Zheng R, Wan C, Mei S, et al. Cistrome Data Browser: expanded datasets and new tools for gene regulatory analysis. Nucleic Acids Res. 2019;47(D1):D729–D735.
- Liu Y, Qin Z, Cai L, et al. Selection of internal references for qRT-PCR assays of human hepatocellular carcinoma cell lines. Biosci Rep. 2017;37(6). DOI:10.1042/BSR20171281
- Udawant S, Litif C, Lopez A, et al. PI3K Pathway Inhibition with NVP-BEZ235 Hinders Glycolytic Metabolism in Glioblastoma Multiforme Cells. Cells. 2021;10(11):3065.
- Li T, Quan H, Zhang H, et al. Silencing cyclophilin A improves insulin secretion, reduces cell apoptosis, and alleviates inflammation as well as oxidant stress in high glucose-induced pancreatic beta-cells via MAPK/NF-kb signaling pathway. Bioengineered. 2020;11(1):1047–1057.
- Yu H, Li M, He R, et al. Major Vault Protein Promotes Hepatocellular Carcinoma Through Targeting Interferon Regulatory Factor 2 and Decreasing p53 Activity. Hepatology. 2020;72(2):518–534.
- Jiang J, Lu Y, Li Z, et al. Ganetespib overcomes resistance to PARP inhibitors in breast cancer by targeting core proteins in the DNA repair machinery. Invest New Drugs. 2017;35(3):251–259.
- Wang EY, Cheng JC, Thakur A, et al. YAP transcriptionally regulates ErbB2 to promote liver cell proliferation. Biochim Biophys Acta Gene Regul Mech. 2018;1861(9):854–863.
- Li T, Han J, Jia L, et al. PKM2 coordinates glycolysis with mitochondrial fusion and oxidative phosphorylation. Protein Cell. 2019;10(8):583–594.
- Higurashi M, Maruyama T, Nogami Y, et al. High expression of FOXM1 critical for sustaining cell proliferation in mitochondrial DNA-less liver cancer cells. Exp Cell Res. 2020;389(1):111889.
- Lee HY, Nga HT, Tian J, et al. Mitochondrial Metabolic Signatures in Hepatocellular Carcinoma. Cells. 2021;10(8):1901.
- Mitra K. Mitochondrial fission-fusion as an emerging key regulator of cell proliferation and differentiation. Bioessays. 2013;35(11):955–964.
- Chen H, Chan DC. Mitochondrial Dynamics in Regulating the Unique Phenotypes of Cancer and Stem Cells. Cell Metab. 2017;26(1):39–48.
- Guo DD, Xie KF, Luo XJ. Hypoxia-induced elevated NDRG1 mediates apoptosis through reprograming mitochondrial fission in HCC. Gene. 2020;741:144552.
- Huang Q, Zhan L, Cao H, et al. Increased mitochondrial fission promotes autophagy and hepatocellular carcinoma cell survival through the ROS-modulated coordinated regulation of the NFKB and TP53 pathways. Autophagy. 2016;12(6):999–1014.
- Trotta AP, Chipuk JE. Mitochondrial dynamics as regulators of cancer biology. Cell Mol Life Sci. 2017;74(11):1999–2017.
- Lacombe M-L, Lamarche F, De Wever O, et al. The mitochondrially-localized nucleoside diphosphate kinase D (NME4) is a novel metastasis suppressor. BMC Biol. 2021;19(1):228.
- Frau M, Ladu S, Calvisi DF, et al. Mybl2 expression is under genetic control and contributes to determine a hepatocellular carcinoma susceptible phenotype. J Hepatol. 2011;55(1):111–119.
- Nakajima T, Yasui K, Zen K, et al. Activation of B-Myb by E2F1 in hepatocellular carcinoma. Hepatol Res. 2008;38(9):886–895.
- Guan Z, Cheng W, Huang D, et al. High MYBL2 expression and transcription regulatory activity is associated with poor overall survival in patients with hepatocellular carcinoma. Curr Res Transl Med. 2018;66(1):27–32.
- Wei T, Weiler SME, Toth M, et al. YAP-dependent induction of UHMK1 supports nuclear enrichment of the oncogene MYBL2 and proliferation in liver cancer cells. Oncogene. 2019;38(27):5541–5550.
- Mori K, Uchida T, Fukumura M, et al. Linkage of E2F1 transcriptional network and cell proliferation with respiratory chain activity in breast cancer cells. Cancer Sci. 2016;107(7):963–971.
- Icard P, Fournel L, Wu Z, et al. Interconnection between Metabolism and Cell Cycle in Cancer. Trends Biochem Sci. 2019;44(6):490–501.
- Bao D, Zhao J, Zhou X, et al. Mitochondrial fission-induced mtDNA stress promotes tumor-associated macrophage infiltration and HCC progression. Oncogene. 2019;38(25):5007–5020.
- Atambayeva S, Niyazova R, Ivashchenko A, et al. The Binding Sites of miR-619-5p in the mRNAs of Human and Orthologous Genes. BMC Genomics. 2017;18(1):428.