
ABSTRACT
Osteosarcoma (OS) is the most common primary malignant bone tumor. Prospero homeobox 1 (PROX1) is a key transcription factor involved in some cancers, but the role of PROX1 in OS is unclear. This study aimed to explore the clinical and biology significance of PROX1 in OS. Fifty-four OS tissues and matched nontumor tissues were collected to explore the relationship between PROX1 expression and clinical characteristics and prognosis. qRT-PCR and immunohistochemistry were used to investigate the expression patterns of PROX1 in OS tissues and cells. CCK-8, wound healing, and transwell assays were used to detect the effects of PROX1 on the proliferation, migration, and invasion of OS cells. Transcriptome sequencing, bioinformatics analysis and qRT-PCR were used to explore the regulatory network of PROX1. PROX1 was significantly higher in OS tissues and cells compared to normal tissues and cell lines. In OS patients, high expression of PROX1 was associated with Enneking stage (P < 0.001) and M classification (P < 0.001). High PROX1 expression predicted a poorer overall survival (P = 0.0047). Compared with untreated cells, OS cells overexpressing PROX1 showed higher proliferation, migration, and invasion abilities, while knockdown of PROX1 suppressed these abilities. The results of Kyoto Encyclopedia of Genes and Genomes pathway enrichment analysis revealed that the down regulated genes were mainly enriched in TNF signaling pathway, MAPK signaling pathway, and neuroactive ligand-receptor interaction. High PROX1 expression was significantly associated with poor overall survival in OS patients. PROX1 may be a promising prognostic marker and therapeutic target for OS patients.
Introduction
Osteosarcoma (OS) belongs to a malignant mesenchymal tumor in which tumor cells can directly differentiate into bone-like tissue or immature bone tissue. It is the most common primary intraosseous malignant tumor in children and adolescents [Citation1,Citation2]. Primary osteosarcomas are subtyped as surface and intramedullary/central OS [Citation3]. Osteosarcomas were subdivided into two categories including conventional OS (osteoblastic, chondroblastic, and fibroblastic types) and other rare variants (small cell, epithelioid, and telangiectatic types) based on the current WHO classification system. OS grows rapidly and shows high metastatic potential [Citation4]. The clinical prognosis of metastatic patients is not optimistic, and the 5-year survival rate is only 20% to 40% [Citation5]. Finally, most patients die of pulmonary metastasis progression [Citation6,Citation7]. Although the development of comprehensive systemic chemotherapy and surgical treatment for OS is very promising in the past 40 years, the therapy of OS still faces serious problems [Citation8]. Many studies have tried to assess the risk of metastasis or recurrence in patients with OS, but molecular markers for early diagnosis and accurate prognosis of OS patients have not been developed yet [Citation9]. Therefore, clarified biomarkers and molecular mechanisms of the occurrence and development of OS are crucial to OS therapy.
Prospero homeobox 1 (PROX1), which is evolutionarily conserved, is a key transcription factor during embryonic organ development [Citation10]. PROX1 is related to the differentiation, proliferation, and migration of stem cells during embryonic development [Citation11]. Dysfunction and abnormal expression of PROX1 are recently reported to promote the malignant progression of different cancer types by regulating tumor cell infiltration, migration, proliferation, differentiation, and apoptosis [Citation12]. PROX1 promotes the expansion of colorectal cancer (CRC) stem cell population to fuel tumor growth and ischemia resistance [Citation13]. Recent studies showed that PROX1 could inhibit the proliferation of hepatocellular carcinoma (HCC) cells and reduced PROX1 expression was associated with poor prognosis of HCC patients [Citation14]. However, the role of PROX1 in OS is unclear.
In this study, we aimed to explore the clinical and biological significance of PROX1 in OS. We analyzed the expression levels of PROX1 in OS, the relationship between PROX1 expression and clinical characteristics of OS patients, explored the relevance of PROX1 to the proliferation, migration, and invasion of OS cells, and investigated the biological significance of PROX1 in OS by transcriptome sequencing of knockdown PROX1 OS cells, bioinformatics analysis and qRT-PCR experiments. We hypothesized that PROX1 was highly expressed in OS patients, correlated with poor clinical features of patients, promoted osteogenesis and progression, and was a potential marker and therapeutic target for patients with OS patients.
Materials and methods
Tissue specimens
This study was based on a series of OS patients who underwent surgery in 2000–2016 at the Department of Surgery, the First Affiliated Hospital at Sun Yat-sen University. Formalin-fixed and paraffin-embedded (FFPE) tissue samples were obtained from the archives of the Department of Pathology. The OS tissues and adjacent non-cancerous tissues were retrieved from 54 conventional intramedullary osteosarcoma patients. These OS patients underwent tumor resection and conventional postoperative chemotherapy (methotrexate 12 g/m2, cisplatin 120 mg/m2, doxorubicin 75 mg/m2, and ifosfamide 9 g/m2) at the Musculoskeletal Oncology Center of Sun Yat-sen University (Guangzhou, China). The pathological diagnosis of these OS patients was determined according to the criteria of the World Health Organization (WHO) by two pathologists.
Immunohistochemistry (IHC)
The experimental steps were performed according to reference [Citation15]. The sections were deparaffinized in xylene and rehydrated using a series of graded alcohols, heated in citric buffer (pH 6.0) for 15 min in a microwave oven for antigen retrieval, and blocked with 3% hydrogen peroxide. The sections were incubated overnight with rabbit anti-human PROX-1 antibody (1/500, Abcam) in a humidified container at 4°C, after 1 hour of preincubation in 10% normal goat serum to prevent nonspecific staining. After overnight incubation at 4°C, the slides were incubated with general immunohistochemical secondary antibodies (Dako, Carpinteria, CA, USA) for 30 minutes at 37°C in a water bath and then visualized with DAB. The staining intensity was scored from grade 0 to 3 (0, negative; 1, pale yellow nuclear staining; 2, moderate yellow staining; 3, brown staining). The percentage of the stained area was scored as 3 (75%–100%), 2(25%–75%), 1(10%–25%), 0(0–10%). The final score (range 0–6) for PROX1 expression was calculated according to the sum of the intensity score and area scores. Cancer tissues possessing final scores of 0–3 and 4–6 were classified as exhibiting low and high expression, respectively. All specimens were independently evaluated by a pathologist.
Cell lines and culture conditions
The experimental steps were performed according to reference [Citation16]. The human OS cell lines (143B, U2OS, HOS, SAOS2) and human osteoblast cell line (hFOB1.19) were provided by the Cell Bank of Pathology Lab, The First Affiliated Hospital of Sun Yat-sen University. These cells were plated in Dulbecco’s Modified Eagle Medium (DMEM, Gibco, Grand Island, NY, USA), with 10% FBS (Gibco, Grand Island, New York, USA), 100 μg/μL streptomycin, and 100 μg/L penicillin in a humidified incubator at 37°C with 5% CO2. Then, cells were digested with EDTA that contains 0.25% trypsin (1 ~ 5 min in incubator) and passaged every 2 days.
siRNA knockdown
The 143B and U2OS cells prepared for transfection would be inoculated to a 6-well plate at a density of 1 × 10⁵ cells per well at a confluence of 30–50% one day in advance. Culture the cells in a FBS-free medium for starvation treatment about 2–3 hours before transfection. Then, cells were transfected with siRNA specific for PROX1, and a nontargeting siRNA (siCTRL) (Guangzhou RiboBio Co., Ltd.) with the Lipofectamine® RNAiMAX Transfection Reagent (Invitrogen, Carlsbad, CA) for at least 20 mins. The transfected cells were cultured in a humidified incubator at 37°C with 5% CO2 for 6 h, and then changed to a medium containing FBS. Culture for 24–72 h before other experiments. Cells were analyzed for siRNA uptake using an inverted fluorescence microscope (IX71; Olympus Corporation, Tokyo, Japan). The primer sequences (purchased from Guangzhou RiboBio Co., Ltd.) used for each target gene were as follows:
PROX1(sense5’-CGA GAA GCC CAA ACC AAA TG-3’, antisense5’-TGG TGG CTG CTT TGC TGT T-3’);
GAPDH (sense 5’-GAC TCA TGA CCA CAG TCC ATG C-3’, antisense 5’-AGA GGC AGG GAT GAT GTT CTG-3’) (internal control).
Quantitative real-time PCR (qRT-PCR) analysis
The experimental steps were performed according to reference [Citation17]. For gene transcription level analysis, Total RNA was extracted with TRIzol (Invitrogen, Carlsbad, CA), and the cDNA template was reverse transcribed using the Roche Transcriptor First Strand cDNA Synthesis Kit (Roche Diagnostics, Mannheim, Germany). qRT-PCR was performed with a FastStart Universal SYBR Green Master (ROX) (Roche Diagnostics, Mannheim, Germany) on a StepOne fast real-time PCR system (Applied Biosystems). GAPDH was used as the internal control to normalize the target gene expression level. All data represent three biologically independent samples. The primer sequences are detailed in . The relative expression of the target genes was determined using the 2−ΔΔct method.
Table 1. Primer sequences
Cell proliferation
The experimental steps were performed according to reference [Citation18]. For the cell growth experiment, 3,000 cells/well were seeded in triplicate in a 96-well plate with a complete culture medium. Cells were transfected with siRNA specific for PROX1 and controlled the next day. At 24, 36, 48, and 60 h post-transfection, Cell Counting Kit 8 (CCK8, Keygent, Suzhou, China) in PBS at 5 mg/ml was added into each well and cultured for 4 h at 37°C, and the results were analyzed by an Automatic Microplate Reader (BioTek, Vermont, USA) at 450 nm, before the 10 min, 150 μL DMSO treatment which used to terminate the reaction.
Wound-healing assay
After transfection for 48 h, cells (1 × 10⁶ cells/well) were grown in a culture medium with 10% FBS until reaching 100% confluence. A wound, which was caused by 100 μL pipette tips, was introduced across the diameter of each plate. Cell migration was observed by microscopy at 0 and 48 h later.
Transwell assay
Pre-cooled 24-well plate, transwell plate (Costar, Corning, NY, USA), and pipette at 4°C 2 h in advance of the experiment. The Matrigel (Trevigen, Gaithersburg, MD, USA) that is stored at −80°C should be taken out and placed at 4°C overnight to dissolve. Diluted dissolved Matrigel (10 mg/mL) with pre-cold and serum-free RMPI 1640 medium at 1:6. 100 μL Matrigel at working concentration was added into the upper chamber of the transwell plate and incubated at 37°C for 5 h. Removed the uncoagulated Matrigel gel, and added 100 μL serum-free culture medium to each well for hydration for 2 h. 50,000 cells at 24 h post-transfection were seeded in the upper chamber of the transwell plate per well and cultured for 24 h. The lower chamber of the transwell plate was plated with a complete growth medium. Fixed with methanol for 15 min, the cells in the upper chamber were stained with crystal violet dye. The number of invaded cells was photographed and counted under an inverted phase-contrast microscope.
Western blot analysis
The experimental steps were performed according to reference [Citation19]. Proteins were extracted from whole cell lysates prepared on ice plates using RIPA lysis buffer (Beyotime, Shanghai, China). The cell debris was removed by centrifugation. The supernatant was heated to 95°C for 5 min in a loading buffer containing 5% β-mercaptoethanol. Then, the protein samples were subjected to SDS–PAGE, and the fractionated proteins were transferred to PVDF membranes (Millipore, Bedford, MA, USA). Protein blots were blocked with 5–10% milk at R.T. for 1 h. After TBST washing, protein blots were then incubated with a specific primary antibody O/N at 4°C. After being washed with TBST, the protein blots were incubated with a specific secondary antibody for 1 h at R.T. Proteins were visualized using enhanced chemiluminescence (ECL) and analyzed with a chemiluminescence imaging analyzer (ImageQuant LAS 4000, GE Healthcare, USA). The primary antibodies were as follows: anti-PROX-1 antibody (1:1000, Abcam, CA, USA), anti-GAPDH (1: 3,000, Millipore Corp, #2118s, MA, USA).
RNA-seq library preparation and transcriptome sequencing
More than 1 μg total RNA of 143B cells that interfered with siRNA specific for PROX1 was selected for polyA+ RNA using Agencourt RNAClean XP Beads (Beckman #A63987). And paired-end next-generation sequencing libraries were prepared using Illumina-supplied universal adaptor oligos and PCR primers (NEB #E7530L). Samples were subjected to transcriptome sequencing (IIIumina NovaSeq PE150). Sequencing libraries were generated using NEBNext® Ultra™ RNA Library Prep Kit for Illumina® (#E7530L, NEB, USA) following the manufacturer’s recommendations and index codes were added to attribute sequences to each sample. The library fragments were purified with QiaQuick PCR kit and eluted with EB buffer, then terminal repair. A-tailings and adapters added were implemented. The target products were retrieved and PCR was performed, then the library was completed. RNA concentration of the library was measured using Qubit® RNA Assay Kit in Qubit® 3.0 to preliminary quantify and then dilute to 1ng/μL. Insert size was assessed using the Agilent Bioanalyzer 2100 system (Agilent Technologies, CA, USA), and the qualified insert size was accurate quantification using StepOnePlus™ Real-Time PCR System (Library valid concentration >10 nM). The clustering of the index-coded samples was performed on a cBot cluster generation system using NovaSeq 6000 (Illumina) according to the manufacturer’s instructions. After cluster generation, the libraries were sequenced on an Illumina platform and 150 bp paired-end reads were generated. The sequencing samples included four groups, namely, untreated, sh-control, shPROX1-1, and shPROX1-2 groups.
Functional enrichment analysis
DEGSeq was used for differential gene expression analysis to compare the gene expression of the knockdown group (shPROX1) and control group (sh-control) [Citation20]. The genes with |log2 FoldChange|≥0.5 and q < 0.05 were selected as DEGs. Then, DAVID database (V6.8, https://david.ncifcrf.gov/) was used to perform the Gene Ontology (GO) and Kyoto Encyclopedia of Genes and Genomes (KEGG) pathway enrichment analysis [Citation21]. GO analysis contained three parts, namely, BP (biological process), CC (cellular component), and MF (molecular function) analysis.
PPI network and module analysis
STRING database (V11.5, http://string-db.org/) was used to construct the PPI network of the DEGs based on a confidence score >0.4 [Citation22]. Then, the Cytoscape software (V 3.8.0) was conducted to analyze and visualize the networks [Citation23]. Besides, the Cytoscape plug-in Molecular Complex Detection (MCODE) was performed to capture the key modules of PPI network based on the parameters degree cutoff = 2, node score cutoff = 0.2, and K-core = 2 [Citation24].
Statistical analysis
Data are presented as mean ± standard deviation (SD) of 3 independent experiments and all data were processed using GraphPad Prism 8.0.1 (San Diego, CA, USA). χ2 test is used to analyze the difference in clinical characteristics of patients with OS. The Kaplan-Meier analysis was used to evaluate the survival curve of patients, and log-rank test was used to compare the difference between curves. Other experimental data were analyzed using t-test or ANOVA by SPSS 20.0. P < 0.05 indicates statistical significance.
Results
In this study, we aimed to explore the clinical significance of PROX1 expression and its role in OS. We found that PROX1 was significantly higher in OS tissues and cells compared to normal tissues and cell lines. In OS patients, high expression of PROX1 was associated with Enneking stage (P < 0.001) and M classification (P < 0.001). High PROX1 expression predicted a poorer overall survival (P = 0.0047). Compared with untreated cells, OS cells overexpressing PROX1 showed higher proliferation, migration, and invasion abilities, while knockdown of PROX1 suppressed these abilities. The results of enrichment analysis revealed that the down regulated genes were mainly enriched in ‘TNF signaling pathway’, ‘MAPK signaling pathway’, and ‘Neuroactive ligand-receptor interaction’.
Expression of PROX1 and characteristics of OS patients
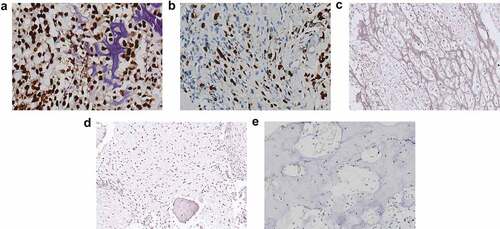
We performed immunohistochemistry (IHC) using 54 samples from follow-up patients diagnosed with conventional intramedullary OS, meanwhile, 10 samples from osteoblastoma patients were used as a negative control. The clinical information of the 54 OS patients, including gender, age, histological type, tumor size, M classification, histological classification, and Enneking stage, is summarized in . PROX1 expression was found to be significantly associated with age (P= 0.042), Enneking staging (P< 0.001), and M classification (P< 0.001). PROX1 was detected significantly positive expression among 35.2% (19 in 54 cases) OS cases (), ); moderately expression in the nucleus of tumor cells among 44.4% (24 in 54 cases) OS cases ()); weakly or negative expression in the nucleus of tumor cells among 20% (11 in 54 cases) OS cases ()). The expression of PROX1 was detected negative in the normal bone tissue adjacent to the tumor ()) and the control osteoblastoma group ()). Our data suggested that PROX1 was highly expressed in OS tissues.
Table 2. Relationship between PROX1 expression and clinical characteristics of OS patients
Figure 1. PROX1 expression was upregulated in OS tissues. (a) OS tissue with PROX1 high expression. (b) OS tissue with PROX1 moderately expression. (c) OS tissue with PROX1 weakly or negative expression. (d-e) The expression of PROX1 in normal bone tissue adjacent to the tumor and control OS group. OS, osteosarcoma.
High PROX1 expression was associated with the poor prognosis of OS patients
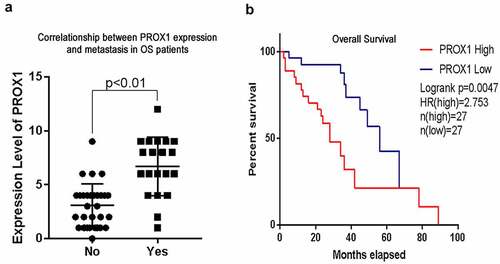
We compared the difference in PROX1 expression between patients with and without pulmonary metastasis. Compared with those who have no pulmonary metastasis, PROX1 increased in the tissues from patients with pulmonary metastasis ()). Kaplan-Meier survival analysis revealed that PROX1 overexpression was correlated with shorter overall survival compared to patients with negative or low PROX1 expression (P= 0.0047) ()). These results showed that PROX1 expression level in OS was negatively correlated with the overall survival of OS patients. High expression of PROX1 may be a reason for the poor prognosis of OS patients.
Figure 2. High PROX1 expression predicted poor prognosis in OS patients. (a) The correlationship between PROX1 expression and metastasis in OS patients. (b) The overall survival of OS patients with high and low expression of PROX1. OS, osteosarcoma.
PROX1 promotes the proliferation, migration, and invasion of human OS cells
We detected the relative expression level of PROX1 among OS cell lines by qRT-PCR and Western blot. Compared with hFOB1.19, the mRNA expression levels of PROX1 in 143B, U2, SAOS2, and HOS2 were significantly increased ()). Consistent with this, the protein level of PROX1 was also increased in OS cell lines ()). Moreover, the expression of PROX1 was varied among different OS cell lines, in which 143B showed the highest expression level.
Figure 3. Effects of PROX1 knockdown on cell proliferation in OS cells. (a-b) qRT-PCR and Western blot analysis showed PROX1 expression in human osteoblast cell line (hFOB1.19) and four glioma cell lines (143B, U2OS, HOS and SAOS2). (c) The relative siPROX1 expression in 143B cell. (d) Proliferation in 143B cell was detected by CCK8 assay. OS, osteosarcoma. (*p < 0.05, **p < 0.01, ***p < 0.001).
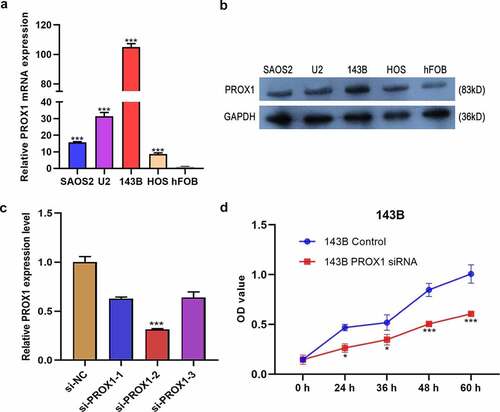
The previous data showed that PROX1 is negatively correlated with the poor prognosis of OS patients, which prompted us that PROX1 might play a significant role in OS progression. Thus, we studied the relationship between PROX1 expression and the proliferation, migration, and invasion of OS cells in vitro. Firstly, we detected the efficiency of siRNA knockdown. The si-PROX1-2 showed a good knockdown efficiency in 143B ()). MTT assay showed that PROX1 knockdown group had significantly decreased proliferation in 143B cells ()). However, in U2 cells, the PROX1 knockdown group showed no difference in proliferation with the control group (Figure S1).
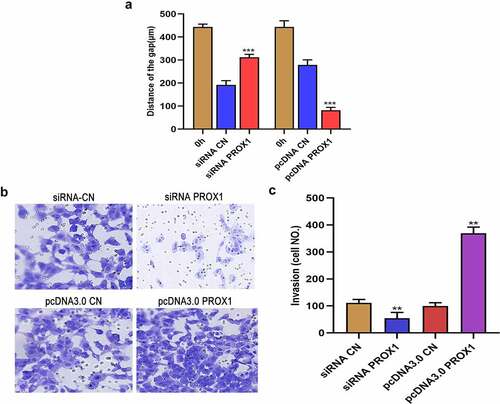
Wound healing test showed that PROX1 knockdown in 143B cell lines resulted in a larger wound area, while PROX1 overexpression resulted in a smaller wound area ()). The results of Transwell assay demonstrated that knockdown of PROX1 inhibited the migration of 143B cells, whereas the overexpression of PROX1 promoted the invasion of 143B cells (). These results indicated that the high expression of PROX1 in OS cells can promote tumor invasion and migration, which could lead to the development and metastasis of OS tumors.
Figure 4. Effects of PROX1 knockdown and overexpression on the migration and invasion of OS cells. (a) Wound healing assay was used to detect the cell migration ability after PROX1 knockdown or overexpression of 48 h in 143B cell. (b-c) Transwell assay showed the invasion of 143B cells after transfection with PROX1 siRNA or overexpression plasmid. OS, osteosarcoma.
The signal pathways related to PROX1
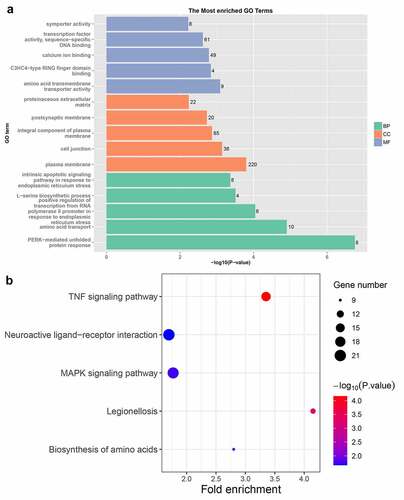
To further study the function of PROX1 in OS, we conducted transcriptome sequencing on 143B cells with PROX1 knockdown. We performed a hierarchical aggregation analysis of differentially expressed genes in different samples (). Compared with the control shRNA group, the shPROX1-1 group had 1066 up regulated and 1128 down regulated genes (Table S1). The shPROX1-2 group had 1395 up regulated and 1414 down regulated genes (Table S2). There were 1039 DEGs genes shared by the two groups, including 468 up regulated and 571 down regulated genes (Table S3, Figure S2). The results of GO analysis revealed that the DEGs were mainly enriched in ‘PERK-mediated unfolded protein response’, ‘plasma membrane’, and ‘amino acid transmembrane transporter activity’ ()). The results of KEGG analysis revealed that the pathways enriched by down regulated genes mainly included ‘TNF signaling pathway’, ‘MAPK signaling pathway’, and ‘Neuroactive ligand-receptor interaction’ ()).
Figure 5. The hierarchical aggregation analysis of DEGs in different samples. DEGs, differentially expressed genes.
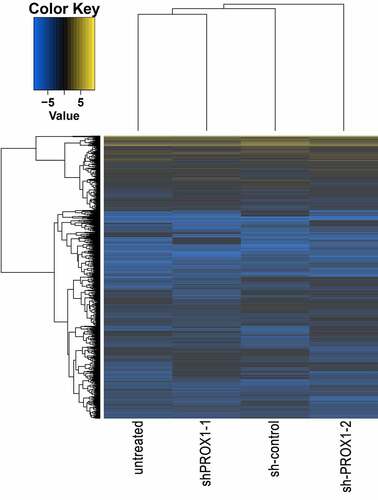
Figure 6. The results of GO and KEGG enrichment analysis of DEGs. (a) The results of GO analysis of DEGs. GO, gene ontology; BP, biological process; CC, cellular component; MF, molecular function. (b) KEGG enrichment analysis results of DEGs. KEGG, Kyoto Encyclopedia of Genes and Genomes. DEGs, differentially expressed genes.
PPI network construction and module analysis
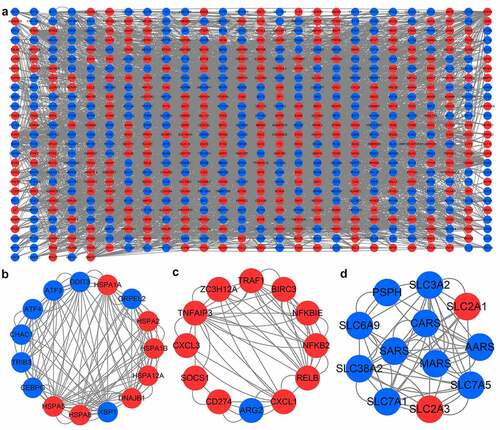
The PPI network contained 681 nodes and 3712 edges ()). Subsequently, the top three modules in PPI network were selected for the next analysis. MCODE in Cytoscape was used to perform module analysis. The module 1 included 15 nodes (HSPA2, ATF3, HSPA8, CHAC1, XBP1, DDIT3, GRPEL2, HSPA12A, TRIB3, HSPA1B, CEBPG, HSPA5, ATF4, DNAJB1, HSPA1A) and 120 edges ()). Module 2 included 12 nodes and 56 edges ()). Module 3 included 12 nodes and 54 edges ()). Then, we performed enrichment analysis on the genes in module 1. The genes in module 1 were mainly enriched in ‘protein processing in endoplasmic reticulum’, ‘estrogen signaling pathway’, and ‘MAPK signaling pathway’ (Figure S3).
Figure 7. PPI network and important modules of DEGs. (a) The PPI network of DEGs. The red circles represent upregulated DEGs and blue circles represent downregulated DEGs. (b) The module 1 from the PPI network. (c) The module 2 from the PPI network. (d) The module 3 from the PPI network. PPI, protein-protein interaction; DEGs, differentially expressed genes.
Discussion
Recently, many studies reported that the abnormal expression of PROX1 is involved in the progression of many cancer types such as colon cancer, hepatocellular carcinoma, neuroendocrine tumor, pancreatic cancer, Kaposi’s sarcoma, breast cancer, and glioma [Citation25–27]. However, few studies reported the function of PROX1 in OS. The present study explored the molecular mechanisms and clinical significance of PROX1 in the progression of OS.
PROX1 is related to the occurrence of cancer and acts as an oncogene or tumor suppressor gene in a tissue-dependent manner [Citation12]. OS occurs mainly in children and adolescents aged 10–20 [Citation28]. PROX1 plays an important role in the invasion and metastasis of human cancers [Citation29,Citation30]. In this study, PROX1 was highly expressed in OS tissues and cells. PROX1 expression was significantly associated with age, Enneking staging, and M classification in OS. PROX1 was mainly expressed in the low-age OS group (<21 years). High PROX1 expression was associated with the high Enneking stage. Compared with those who have no pulmonary metastasis, PROX1 increased in the tissues from patients with pulmonary metastasis. Kaplan-Meier survival analysis showed that high expression of PROX1 suggested poor overall survival. The findings suggest that high expression of PROX1 is related to the poor prognosis of OS patients.
After knocking out PROX1, we performed transcriptome sequencing on OS cells. Then, functional enrichment analysis was performed to analyze the signal pathways related to PROX1. The results of KEGG analysis revealed that the DEGs mainly enriched in TNF signaling pathway, MAPK signaling pathway, and neuroactive ligand-receptor interaction. TNF signaling pathway is controlled by competing ubiquitin conjugation and deubiquitination, which governs both proteasomal degradation and signaling complex formation [Citation31]. TNF signaling pathway involves cell apoptosis, cell survival, transcription regulation, and others [Citation32]. Abnormal activation of the MAPK signaling pathway has been confirmed to be related to the growth and proliferation of tumor cells, including in OS [Citation33]. Neuroactive substances play a broad role in almost all physiology and organ development [Citation34]. Neuroactive ligand-receptor interactions might serve a role in OS, partially by regulating the expression of GABA [Citation35]. PPI network and key modules were constructed to investigate the genes related to PROX1. The most important module contained 15 genes, and MAPK signaling pathway was one of the pathways enriched by these genes. Enhanced expression of KIF4A in osteosarcoma predicts a poor prognosis and facilitates tumor growth by activation of the MAPK pathway [Citation36]. This result emphasized that the MAPK signaling pathway may be a therapeutic target for OS. However, the specific molecular mechanism by which PROX1 mediates the occurrence of OS through the MAPK pathway needs further investigation.
There are some limitations of this study. First, the sample size of OS patients in this study was small. Secondly, the specific molecular mechanism of PROX1-mediated osteosarcoma development has not been elucidated. Therefore, there is a need to enroll a larger clinical sample and to demonstrate the clinical and biological significance of PROX1 through further experimental studies.
Conclusions
In summary, our findings revealed that PROX1 was up regulated in OS and correlated with poor prognosis. PROX1 promotes proliferation, migration, and invasion of osteosarcoma cells. PROX1 is involved in signaling pathways including TNF signaling pathway, MAPK signaling pathway, and neuroactive ligand-receptor interaction. PROX1 may be a promising prognostic marker and therapeutic target for OS patients.
Ethics approval
The present study was approved by the Ethics Committee of the First Affiliated Hospital of Sun Yat-sen University. The processing of clinical tissue samples is in strict compliance with the ethical standards of the Declaration of Helsinki.
Consent to participate
All patients signed a written informed consent.
Consent for publication
Consent for publication was obtained from the participants.
Author contributions
(I) Conception and design: Dawei Liu; (II) Administrative support: Liantang Wang; (III) Provision of study materials or patients: Ran Wang, Yuefeng Wang; (IV) Collection and assembly of data: Ye Wang; (V) Data analysis and interpretation: Dawei Liu; (VI) Manuscript writing: All authors; (VII) All authors have read and agreed to the published version of the manuscript.
Supplemental Material
Download Zip (1.1 MB)Disclosure statement
No potential conflict of interest was reported by the author(s).
Data availability statement
The data used to support the findings of this study are available from the corresponding author upon request.
The datasets used and/or analyzed during the current study are available from the corresponding author on reasonable request.
Supplementary material
Supplemental data for this article can be accessed here
Additional information
Funding
Related Research Data
References
- Chen X, Ye Z, Lou P, et al. Comprehensive analysis of metabolism-related lncRNAs related to the progression and prognosis in osteosarcoma from TCGA. J Orthop Surg Res. 2021;16(1):523.
- de Azevedo JWV, de Medeiros Fernandes TAA, Fernandes JV, et al. Biology and pathogenesis of human osteosarcoma. Oncol Lett. 2020;19(2):1099–1116.
- Hattinger CM, Patrizio MP, Fantoni L, et al. Drug resistance in osteosarcoma: emerging biomarkers, therapeutic targets and treatment strategies. Cancers (Basel). 2021;13(12):2878.
- Wang J, Liu S, Shi J, et al. The role of miRNA in the diagnosis, prognosis, and treatment of osteosarcoma. Cancer Biother Radiopharm. 2019;34(10):605–613.
- Briccoli A, Rocca M, Salone M, et al. High grade osteosarcoma of the extremities metastatic to the lung: long-term results in 323 patients treated combining surgery and chemotherapy, 1985-2005. Surg Oncol Oxford. 2010;19(4):193–199.
- Liu Y, Teng Z, Wang Y, et al. Prognostic significance of survivin expression in osteosarcoma patients: a meta-analysis. Med Sci Monit. 2015;21:2877–2885.
- Iwata S, Yonemoto T, Iizasa T, et al. Oligo-recurrence of osteosarcoma patients: treatment strategies for pulmonary metastases. Ann Surg Oncol. 2015;22(3):1332–1338.
- Zhu N, Hou J, Ma G, et al. Co-expression network analysis identifies a gene signature as a predictive biomarker for energy metabolism in osteosarcoma. Cancer Cell Int. 2020;20(1):259.
- Zhang S, Ren H, Sun H, et al. Dieckol exerts anticancer activity in human osteosarcoma (MG-63) cells through the inhibition of PI3K/AKT/mTOR signaling pathway. Saudi J Biol Sci. 2021;28(9):4908–4915.
- Stefan W, Maas RL. Vertebrate eye development as modeled in Drosophila. Hum Mol Genet. 2000;9(6):917.
- Wiener Z, Högström J, Hyvönen V, et al. Prox1 promotes expansion of the colorectal cancer stem cell population to fuel tumor growth and ischemia resistance. Cell Rep. 2014;8(6):1943–1956.
- Rudzińska M, Czarnocka B. The impact of transcription factor prospero homeobox 1 on the regulation of thyroid cancer malignancy. Int J Mol Sci. 2020;21(9):3220.
- Wiener Z, Högström J, Hyvönen V, et al. Prox1 promotes expansion of the colorectal cancer stem cell population to fuel tumor growth and ischemia resistance. Cell Rep. 2014;8(6):1943–1956.
- Chang T-M, Hung W-C. The homeobox transcription factor Prox1 inhibits proliferation of hepatocellular carcinoma cells by inducing p53-dependent senescence-like phenotype. Cancer Biol Ther. 2013;14(3):222–229.
- Zhong X, Cai Y. Long non-coding RNA (lncRNA) HOXD-AS2 promotes glioblastoma cell proliferation, migration and invasion by regulating the miR-3681-5p/MALT1 signaling pathway. Bioengineered. 2021;12(2):9113–9127.
- Cheng C, Zhang H, Dai Z, et al. Circular RNA circVRK1 suppresses the proliferation, migration and invasion of osteosarcoma cells by regulating zinc finger protein ZNF652 expression via microRNA miR-337-3p. Bioengineered. 2021;12(1):5411–5427.
- Tao X, Cheng J, Wang X. Effect of miRNA-200a on radiosensitivity of osteosarcoma cells by targeting bone morphogenetic protein receptor 2. Bioengineered. 2021;12(2):12625–12635.
- Tang G, Liu L, Xiao Z, et al. CircRAB3IP upregulates twist family BHLH transcription factor (TWIST1) to promote osteosarcoma progression by sponging miR-580-3p. Bioengineered. 2021;12(1):3385–3397.
- Zhang Q, Wang L, Cao L, et al. Novel circular RNA circATRNL1 accelerates the osteosarcoma aerobic glycolysis through targeting miR-409-3p/LDHA. Bioengineered. 2021;12(2):9965–9975.
- Yao B, Wang C, Zhou Z, et al. Comparative transcriptome analysis of the main beam and brow tine of sika deer antler provides insights into the molecular control of rapid antler growth. Cell Mol Biol Lett. 2020;25(1):42.
- Wei J, Wang Y, Shi K, et al. Identification of core prognosis-related candidate genes in cervical cancer via integrated bioinformatical analysis. Biomed Res Int. 2020;2020:8959210.
- Zhang Z, Zhang X. Identification of m6A-related biomarkers associated with prognosis of colorectal cancer. Med Sci Monit. 2021;27:e932370.
- Thomas DM, Kannabiran C, Balasubramanian D. Identification of key genes and pathways in persistent hyperplastic primary vitreous of the eye using bioinformatic analysis. Front Med (Lausanne). 2021;8:690594.
- Li M, Wang X, Liu J, et al. Identification of core prognosis-related candidate genes in chinese gastric cancer population based on integrated bioinformatics. Biomed Res Int. 2020;2020:8859826.
- Elsir T, Smits A, Lindström MS, et al. Transcription factor PROX1: its role in development and cancer. Cancer Metast Rev. 2012;31(3):793–805.
- Saukkonen K, Hagström J, Mustonen H, et al. PROX1 and β-catenin are prognostic markers in pancreatic ductal adenocarcinoma. BMC Cancer. 2016;16(1):472.
- Ding Y, Chen W, Lu Z, et al. Kaposi’s sarcoma-associated herpesvirus promotes mesenchymal-to-endothelial transition by resolving the bivalent chromatin of PROX1 gene. PLoS Pathog. 2021;17(9):e1009847.
- Shi K, Wang S-L, Shen B, et al. Clinicopathological and prognostic values of fibronectin and integrin αvβ3 expression in primary osteosarcoma. World J Surg Oncol. 2019;17(1):23.
- Gao T, Ma C, Li Y, et al. High expression of prospero-related homeobox-1 (PROX1) is associated with poor prognosis in patients with salivary adenoid cystic carcinoma. J Oral Maxillofacial Surg. 2018;76(7):1440–1446.
- Hao X, Luo W, Qiu X. The association of transcription factor Prox1 with the proliferation, migration, and invasion of lung cancer. Open Life Sci. 2021;16(1):602–610.
- Cockram PE, Kist M, Prakash S, et al. Ubiquitination in the regulation of inflammatory cell death and cancer. Cell Death Differ. 2021;28(2):591–605.
- Zhang G, Tan G, Li T, et al. Analysis of ceRNA network of differentially expressed genes in FaDu cell line and a cisplatin-resistant line derived from it. PeerJ. 2021;9:e11645.
- Han D, et al. FGF5 promotes osteosarcoma cells proliferation via activating MAPK signaling pathway. Cancer Manag Res. 2019;11:6457–6466.
- Nässel DR, Zandawala M. Recent advances in neuropeptide signaling in Drosophila, from genes to physiology and behavior. Prog Neurobiol. 2019;179:101607.
- Chen X-G, Ma L, Xu J-X. Abnormal DNA methylation may contribute to the progression of osteosarcoma. Mol Med Rep. 2018;17(1):193–199.
- Zhu D, et al. Enhanced expression of KIF4A in osteosarcoma predicts a poor prognosis and facilitates tumor growth by activation of the MAPK pathway. Exp Ther Med. 2021;22(5):1339.