
ABSTRACT
Pleckstrin homology-like domain family A, member 3 (PHLDA3), is emerging as a critical regulator for multiple cancers. Nevertheless, the expression and role of PHLDA3 in osteosarcoma remain unknown. Herein, we purposed to elucidate the role of PHLDA3 in the progression and chemoresistance of osteosarcoma. According to the bioinformatics analysis, PHLDA3 expression was low in osteosarcoma patients, and low content was linked to poor prognosis. Additionally, activation of PHLDA3 suppressed osteosarcoma cell proliferation, migration, and chemoresistance, whereas PHLDA3 inhibition caused the opposite effects. Mechanistically, our data revealed that PHLDA3 negatively regulates the Akt/GSK3β signaling cascade in osteosarcoma. Furthermore, we found that miR-19a-3p might exert its oncogenic function by inhibiting PHLDA3 expression in osteosarcoma. These results demonstrated miR-19a-3p/ PHLDA3/ Akt/GSK3β axis has a pivotal role in osteosarcoma, and PHLDA3 is a prospective therapeutic target for treating osteosarcoma.
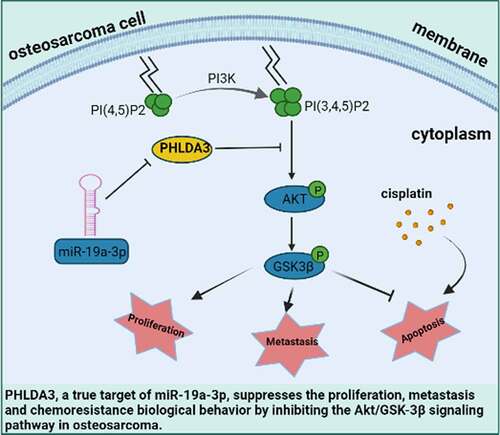
Graphical abstract
1. Introduction
Osteosarcoma (OS), a common bone cancer derived from mesenchymal cells, has a high incidence and mortality rate in adolescents [Citation1,Citation2]. It is characterized mainly by uncontrolled proliferation and a high metastasis rate: 75% of OS cases attack adjacent tissues [Citation3]. Although several therapeutic strategies, such as surgery, adjuvant radiotherapy, and chemotherapy, have made significant advances in increasing the survival rate of OS patients, the 5-year rate of survival remains low [Citation4,Citation5]. Thus, it is urgent to elucidate the molecular mechanisms of OS to identify novel treatment targets.
In recent years, gene expression profiling chip, a high-throughput and effective technology, has been widely used in various fields of cancer research [Citation6–9]. It can help in the discovery of disease-related genes and provide insight into the pathogenesis of cancers such as OS [Citation10]. Ajimu Keremu et al. analyzed the GEO database and discovered NRSN2, a novel oncoprotein that promotes OS cell expansion and may be a prognostic biomarker of OS [Citation11]. Hence, the gene expression profile will be helpful for us to identify reliable prognostic biomarkers to improve the prognosis and treatment of OS.
PHLDA3 is the p53 regulatory repressor of Akt [Citation12]. It has a PH domain that can compete with the PH domain of Akt for membrane lipids docking and suppress Akt activity [Citation13]. Recent investigations have linked PHLDA3 as a tumor repressor gene to diverse cancers, for instance prostate cancer [Citation14], pancreatic neuroendocrine tumors [Citation15], as well as breast cancer [Citation16]. Nevertheless, the role of PHLDA3 in OS is still unclear.
Here, we try to investigate the potential role and modulatory mechanism of PHLDA3 in OS. Based on bioinformatics analysis, we hypothesized that PHLDA3 is a miR-19a-3p-regulated gene and lowly expressed in human OS tissues. Additionally, we investigate the effect of PHLDA3 on the Akt/GSK-3by blocking pathway. In summary, we aim to explore the function and its underlying mechanism of PHLDA3 in OS and provide a new treatment strategy for OS.
2. Materials and methods
2.1 Cell culture and reagents
The human OS cell lines (143B/U2OS) were acquired from the American Type Culture Collection. The cells were cultured in Dulbecco’s Modified Eagle Medium containing 10% FBS under 37°C and 5% CO2 conditions. The following antibodies were used: antibody against PHLDA3 (Abcam, ab81464); GAPDH (Santa Cruz Biotechnology, SC-25778); Actin (Proteintech,66,009-1-lg); Akt (CST, 4691); p-Akt (CST, 4060); p-GSK-3β (CST, 5558); GSK-3β (CST, 9315); and PARP (Santa Cruz Biotechnology, SC-8007).
2.2 Identification of the differentially expressed genes
To identify the differentially expressed genes (DEGs) in OS, the gene expression profiles (GSE42352, GSE70414) were acquired from the GEO database. The DEGs were obtained from the gene expression profiles by utilizing the GEO2R online tool (http://www.ncbi.nlm.nih.gov/geo/geo2r/). The adj. P < 0.05 and |logFC| > 1 were set as DEGs cutoff criterion.
2.3 Protein–protein interaction analysis
To explore the interaction of DEGs, we used the Search Tool for the Retrieval of Interacting Genes (STRING) database to analyze the protein interaction network (PPI), and the DEGs with a reliability score >0.15 were added to the Cytoscape software for the PPI.
2.4 Oncomine database analysis
Oncomine database (http://www.oncomine.org), a web-based microarray database, was used to analyze the transcription level of the DEGs in different cancer types. PHLDA3 gene expression in clinical cancer tissue was queried and compared that with normal tissue using Student t-test. The parameters included fold-change 2, P-value 1e-4, and gene rank top 10%.
2.5 UCSC Xena
The prognostic value of PHLDA3 expression in OS was assessed according to overall survival using the UCSC Xena browser (http://xena.ucsc.edu/), an online database including gene expression data and clinical data.
2.6 Transfection and viral infection
The Lipofectamine™3000 system was adopted to perform transient transfections (Invitrogen) as described by the manufacturer. The miR-19a-3p mimics and inhibitors were acquired from GenePharma. The short hairpin RNA (shRNA) sequences targeting PHLDA3 were 5’-AGCGCTGCGTCCTCACCGA-3’ and 5’- GCGACGGCTACCGTGCTCA −3’. The shRNA was cloned via the pGIPZ vector. Human PHLDA3 cDNA was cloned into the pCDH vector using the primers: F: 5’- GCGAATTCATGACGGCGGCGGCGACGG-3’ and R: 5’- GCGGATCCTTAGGACACGAGGGTCCCGGTC-3’. The expression efficiency was evaluated using Western blot analysis.
2.7 MTT assay and PI staining assay
Briefly, 3000 cells were inoculated into 96-well plates. At the specified point in time, 200 μl culture media containing 20 μl MTT was introduced into each well and left to grow for four hours. Afterward, we replaced the medium in every well with 200 μl DMSO. The OD values at 570 and 630 nm were read with a microplate reader (PerkinElmer).
For propidium iodide (PI) staining assay, OS cells were inoculated in 6-well plates and exposed to or without cisplatin (CDDP) for 24 h. The cells were then stained with PI (Coolaber, cp9161) and left to grow for 10 minutes (Coolaber, cp9161). Finally, the morphologic cell changes were recorded using a fluorescence microscope (Olympus).
2.8 Colony formation assay
We trypsinized the 143B/U2OS cells, and then sub-cultured 1000–3000 viable cells in 6-well plates and left the cells to grow for 14 days for adherence and colonization. After that, we removed the media cells, then stained the cells (in 0.04% crystal violet) to visualize colonies and assess proliferation capacity.
2.9 Sphere formation assay
Suspensions of cells were inoculated on ultra-low adherent 12 well plates at 1 × 10³ cells per well in 1 mL serum-free DMEM-F12 medium (Gibco, MA) enriched with B27 (1:50) (Invitrogen, MA) along with 20 ng/ml bFGF and EGF. After 14 days of incubation, the number of spheres exhibiting a diameter > 100 mm in each well was recorded.
2.10 Cell migration assay
In compartments (BD, Biosciences, 8.00 mm pores), 143B/U2OS cells were inoculated in serum-free medium. We left the cells to migrate toward the serum-rich bottom chamber for 24 hours. Non-migrating cells were scraped off the insert’s apical surface, and membranes harboring migrated cells were fixed (in 4% paraformaldehyde), followed by staining (in crystal violet). The cells’ average count per field of view was used to express cell count.
When the transfected 143B and U2OS cells grew to more than 90% of their original size on the 12-well plate, a linear wound was made with a sterile 200-μl pipette tip. The cell fragments were rinsed thrice with PBS, before being inoculated in 2% FBS medium. The 12-well plate was photographed under a microscope. The cell migration images were taken after 16/24/36 h at a fixed position.
2.11 Real-time RT-PCR
Isolation of total RNA was done with Trizol (Invitrogen). Afterward, cDNA was generated from 1 μg of total RNA with the PrimeScriptTM RT Kit as described by the manufacturer (Takara, RR047A). The following primers were used: PHLDA3: F: 5’-CAGCTCTTCGAGGCCAAG-3’ and R: 5’-GACCAGGCCTAGGGTGATCT-3’; Actin: F: 5’-GACCTGACTGACTACCTCATGAAGAT-3’ and R: 5’-GTCACACTTCATGATGGAGTTGAAGG-3’.
2.12 Annexin V-FITC staining and flow cytometry
Transfected 143B cells were trypsinized and collected in 300 μl of the provided Annexin V-FITC (AV) binding buffer. Cells were then co-inoculated in the dark with 5 μl AV and 10 μl PI for 10 minutes at RT (room temperature). Thereafter, we suspended the cells in binding buffer (400 μl) followed by gentle mixing. Lastly, the treated cells were subjected to flow cytometry (BD Biosciences).
2.13 Dual-luciferase reporter assay
The dual-luciferase enzyme reporter assay was conducted as previously documented [Citation17]. The wild-type (WT) docking site of miR-19a-3p on PHLDA3 and the matching mutant (Mut) were cloned into the pGL3-basic vector. The PHLDA3 WT or PHLDA3 Mut was co-transfected into 143B/U2OS cells with miR-19a-3p mimics or inhibitor or their corresponding control. After 48 h, Promega Dual-Luciferases Reporter Assay kit (Promega E1980) was performed to measure luciferase activities according to the manufacturer’s protocols.
2.14 Animal experiments
Animal experiments were conducted according with the National Institute of Health Guide for the Care and Use of Laboratory Animals with the approval of the Animal Research Committee of Dalian Medical University. 143B cells transfected with sh-PHLDA3 or shCtrl were injected into the flank of the nude mice. The mice were killed and tumors were removed from the mice at 18 days after inoculation.
2.15 Statistics and data analyses
The data are given as mean ± SD. The statistical assessment was done using one-way analysis of variance (ANOVA), with p < 0.05 signifying statistical significance.
3 Results
In the study, we aimed to elucidate the molecular mechanisms of OS to identify novel treatment targets. Based on bioinformatics analysis, we discovered that PHLDA3 expression was low in OS cells and tissues. Increased PHLDA3 in OS cells suppressed cell growth, migration, and enhanced cisplatin-triggered apoptosis. Whereas, PHLDA3 knockdown increased cell growth, migration, and dampened cell apoptosis. Furthermore, we established that PHLDA3 was a true target of miR-19a-3p and blocked the Akt/GSK-3β signaling cascade in OS cells.
3.1 PHLDA3 expression was downregulated in osteosarcoma cells and tissue samples
To determine the differentially expressed genes (DEGs) in OS, we obtained the associated expression microarray datasets from GEO databases, including GSE70414 and GSE42352. The two datasets were evaluated using the GEO2R data resource (http://www.ncbi.nlm.nih.gov/geo/geo2r/) to determine DEGs (|Log FC|> 1 and p-value< 0.05) between OS cells and bone mesenchymal stem cells (MSC). Volcano plots were used to display the DEGs from the two sets of each sample data ( and ). A total of 551 and 1112 DEGs were obtained from GSE70414 and GSE42352 datasets, respectively. Individually, the Venn diagram revealed 16 common upregulated genes and 76 common downregulated genes (). The heat maps of the 92 differentially co-expressed genes in various chips were generated using the ‘pheatmap’ package in R studio (). The differentially co-expressed genes were then imported into the STRING database, and those with a reliability score >0.15 were added to the Cytoscape software for the visual protein interaction network ().
Figure 1. Differentially expressed mRNAs between osteosarcoma cell and mesenchymal stem cells. (a-b) The mRNA Volcano plot based on (a) GSE70414 data and (b) GSE42352 data. The red points designate upregulated genes screened as per |fold change|>1.0 and p < 0.05. The green points designate downregulated genes screened as per |fold change|>1.0 and p < 0.05. The gray points show genes with no statistically remarkable difference. (c) Venn diagrams of the overlapping DEGs between the two datasets. (d) Protein-protein interaction (PPI) networks for 92 differentially co-expressed genes. Green and blue nodes denote upregulated and downregulated genes, respectively. (e) Heat map showing 92 differentially co-expressed genes, with blue to red colors representing mRNA expression levels from low to high. (f) 23 valuable genes screened based on literature search. Blue, red, and green circles indicate genes that are rarely reported with osteosarcoma (<5), genes with more reported tumors (>10), and genes with the opposite trend of tumor reports, respectively.
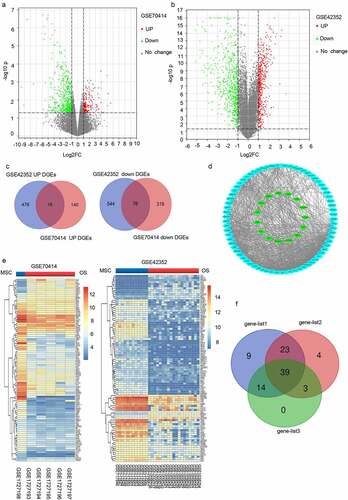
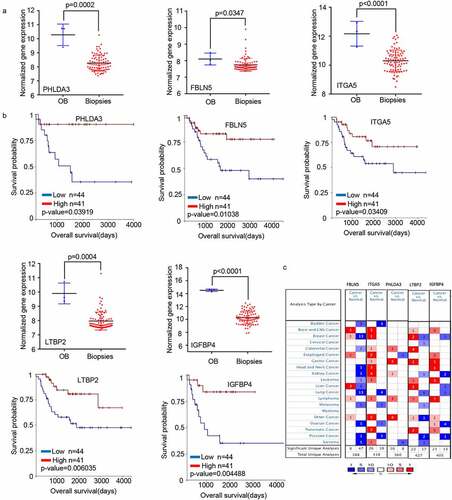
We selected 23 genes from a literature search to screen for those with potential research value (). Then, we extracted the expression profiles of the selected genes from GSE42352 datasets between osteoblast (OB) and high-grade OS pre-chemotherapy biopsy (Biopsies) and analyzed the influence of these genes on the clinical survival of patients with OS using UCSC Xena browser (http://xena.ucsc.edu/). We found that the changing trend of five genes (PHLDA3, FBLN5, ITGA5, LTBP2, and IGFBP4) in Biopsies and OB was consistent with OS cells and MSC outcomes (), and affected the prognosis of OS patients (). The transcriptome analysis of the five genes in different types of tumors in the Oncomine data resource (https://www.oncomine.org/resource/login.html) revealed that the expression of PHLDA3, FBLN5, and LTBP2 was low in clinical samples of sarcoma (). Based on additional verification data sets, we eventually selected PHLDA3 as a candidate gene for further experimental verification.
Figure 2. The mRNA expression levels of five genes screened from 23 valuable genes. (a) Normalized gene expression levels of the five screened genes in osteoblasts (OB) and osteosarcoma biopsies (Biopsies). (b) The prognostic value of mRNA contents of the five screened genes in osteosarcoma patients (UCSC). (c) Transcription levels of the five screened genes in different types of cancers (Oncomine).
3.2 PHLDA3 inhibits osteosarcoma cell proliferation and migration
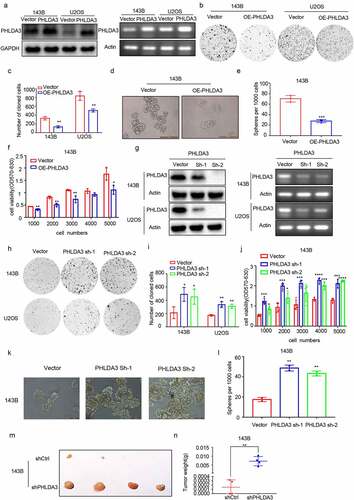
The biological role of PHLDA3 in OS is poorly understood. Therefore, we overexpressed PHLDA3 (OE-PHLDA3) in 143B and U2OS cells to explore its role in OS. The predicted level of PHLDA3 expression was verified using Western blot along with RT-PCR (). After that, we explored the influence of PHLDA3 on cell proliferation using MTT, colony formation, and spheroid formation assays. We found that increased PHLDA3 remarkably dampened the growth of OS cells, as illustrated in (p < 0.05). To verify this finding, we used lentiviruses expressing shRNA to knock down PHLDA3 expression. The knockdown efficiency was assessed using Western blot and RT-PCR (). The results indicated that silencing PHLDA3 significantly increased cell proliferation (, p < .05). Besides, sh-PHLDA3 or shCtrl transfected 143B cells were inoculated into nude mice to assess the functional role of PHLDA3 in vivo. As shown in , PHLDA3 silencing greatly increased the tumor weight of mice.
Figure 3. PHLDA3 suppressed the proliferation of human osteosarcoma cell lines. (a) Relative protein and mRNA contents of PHLDA3 in 143B/U2OS cells after transfection with OE-PHLDA3, as confirmed using Western blot and RT-PCR. (b-c) Cell growth ability of 143B/U2OS cells after transfection based on colony formation assays. (d-e) Tumor-initiating capability of 143B cells after transfection, as assessed using sphere formation assay. (f) Cell viability of 143B cells after transfection based on MTT assays. (g) Knockdown efficiency of PHLDA3 using shRNA lentivirus. PHLDA3 expression levels in PHLDA3 knockdown (shPHLDA3-1 and shPHLDA3-2) and negative control cells, as detected using Western blot and RT–PCR. (h-i) Colony formation assays. (j) MTT assays. (k-l) Sphere formation assay. (m) The tumor size of nude mice. (n) Tumor weighs of Xenograft tissues. The data in (c), (e), (F), (i), (J), (l) and (N)were given as means ± SD, *p < .05, **p < .01, ***p < .001 vs. control.
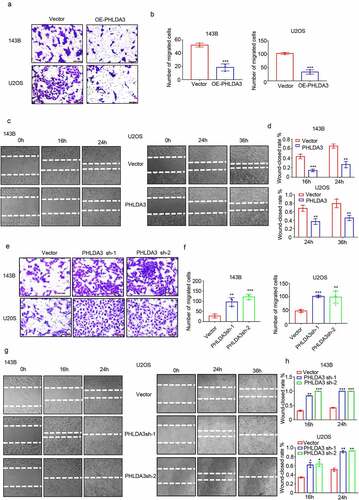
Subsequently, the effect of PHLAD3 on OS cell migration was assessed via wound healing along with Transwell assays. The results indicated that increased PHLDA3 suppressed OS cell migration (, p < .01), whereas PHLDA3 knockdown accelerated cell migration in 143B/U2OS cells (, p < .01). Collectively, these results illustrate that PHLDA3 is a bona fide repressor of cell proliferation along with migration in OS.
Figure 4. PHLDA3 suppressed cell migration in osteosarcoma. (a-d) Overexpression of PHLDA3 in 143B/U2OS cells via lentivirus vectors. The influences of PHLDA3 on cell migration were explored via Transwell assay (a-b) along with wound-healing assay (c-d). (e-h) PHLDA3 knockdown in 143B/U2OS cells, as well as its influence on cell migration were explored via Transwell assay (e-f) along with wound-healing assay (g-h). The data in (b), (d), (f), and (h) were given as means ± SD, **p < .01, ***p < .001 vs. control.
3.3 PHLDA3 enhances cisplatin-induced apoptosis in osteosarcoma cells
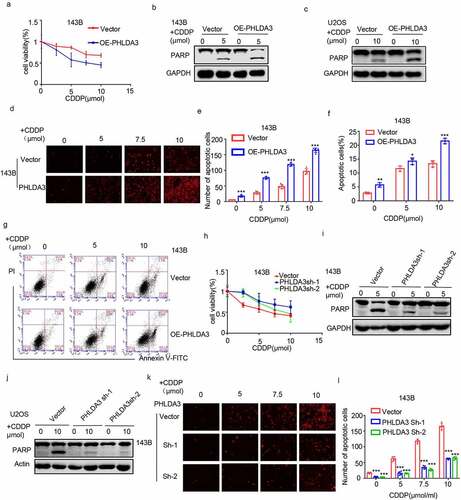
To confirm the tumor-suppressive role of PHLDA3, we assessed its effect on chemoresistance in OS cells. We found that overexpression of PHLDA3 promoted cisplatin-induced apoptosis, as illustrated by the escalation in cleaved PARP (). Subsequently, these findings were corroborated by the MTT (), PI staining (, p < 0.001), and flow cytometry analyses (, p < 0.05). According to the results, overexpressing PHLDA3 reduced cell viability, as well as elevated the numbers of cell apoptosis in OS cells treated with cisplatin. To verify the results, we silenced PHLDA3 in OS cells, and assessed cell viability and apoptosis using MTT assay (), Western blot (), and PI staining (, p < 0.001). PHLDA3 knockdown consistently increased OS cells viability and decreased cells apoptosis in response to cisplatin treatment. Hence, these data illustrated that PHLDA3 plays an indispensable role in the chemoresistance in OS cells.
Figure 5. PHLDA3 enhanced cisplatin-triggered apoptosis in osteosarcoma cells. (a) The transfected 143B cells were exposed to different doses of cisplatin (CDDP) for 24 hours, and cells viability was explored via the MTT assay. (b-g) Osteosarcoma cells were inoculated with diverse levels of CDDP for 24 hours after OE-PHLDA3 transfection. Cell apoptosis was analyzed using Western blotting analysis of PARP (b-c), PI only staining (d-e), and Annexin V/PI double staining (f-g). (h) The transfected 143B cells were exposed to diverse levels of CDDP for 24 hours, and cells viability was explored via the MTT assay. (i-l) Osteosarcoma cells were inoculated with diverse levels of CDDP for 24 hours after Sh-PHLDA3 transfection. Cell apoptosis was analyzed using Western blotting analysis of PARP (i-j) and PI only staining (k-l). The data in (e), (f), and (l) were given as means ± SD, ***p < .001 vs. control.
3.4 PHLDA3 suppresses cell proliferation and migration via Akt/GSK-3β signaling in osteosarcoma cells
Akt signaling is well recognized for its pivotal role in enhancing cell growth and dampening apoptosis in many cancers [Citation18]. Previous studies indicate that PHLDA3 is an important suppressor of Akt signaling [Citation19]. Therefore, to investigate whether PHLDA3 regulates OS cell proliferation along with migration through the Akt/GSK-3β cascade, we first assessed its effect on p-AKT and p-GSK-3β protein contents in OS cells. The results illustrated that PHLDA3 overexpression diminished the contents of p-AKT (ser 473) along with p-GSK-3β (ser 9) (), whereas PHLDA3 knockdown elevated the protein contents of p-AKT (ser 473) coupled with p-GSK-3β (ser 9) ().
Figure 6. Akt/ GSK-3β signaling cascade is regulated by the expression of PHLDA3. (a-d) Western blots for Akt, GSK-3β, p-Akt along with p-GSK-3β protein contents in 143B/U2OS cells after transfection. (e) Protein contents of Akt, GSK-3β, p-Akt, and p-GSK-3β in 143B cells after inoculation with PHLDA3 downregulation and/or LY294002 (20 μmol) for 24 h. (f-g) The proliferation of 143B cells after treatment with PHLDA3 downregulation and/or LY294002 (20 μmol) examined using a colony formation assay. (h-i) The migration of 143B cells after treatment with PHLDA3 downregulation and/or LY294002 (μmol) examined using Transwell assays. The data in (g) and (i) were given as means ± SD, ***p < .001 vs. control.
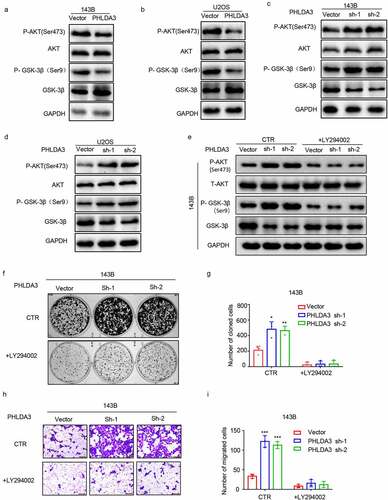
To demonstrate that PHLDA3 suppressed cell growth along with migration by regulating the Akt cascade, OS cells with or without PHLDA3 silencing were inoculated with or without the PI3K/Akt signaling inhibitor LY294002. The data indicated that LY294002 remarkably diminished the p-AKT and p-GSK-3β induced by PHLDA3 knockdown (). Furthermore, cells proliferation along with migration were evaluated via colony formation coupled with Transwell assays. LY294002 prevented the increase of cell proliferation (, p < .05) and migration (, p < .001) caused by PHLDA3 knockdown. According to the results, PHLDA3 suppresses OS development by modulating the Akt/GSK-3β signaling cascade.
3.5 PHLDA3 is a direct downstream target of miR-19a-3p
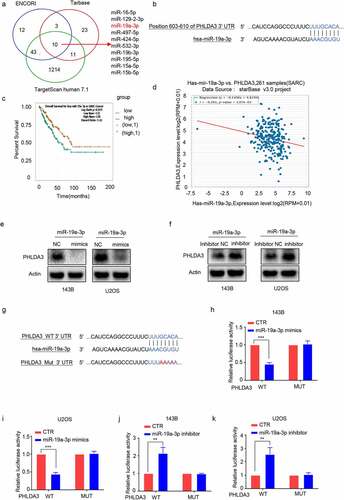
To understand the modulatory mechanism of PHLDA3 in OS, we searched for potential PHLDA3 miRNAs in three databases: ENCORI, TargetScanHuman7.1, and Tarbase. The miRNAs were then verified using a PubMed literature review. The data illustrated that miR‐19a-3p, a predicted miRNA of PHLDA3, was upregulated in OS [Citation20,Citation21] (). Thus, we purposed to establish the association of miR-19a-3p with PHLDA3. Subsequently, Target ScanHuman7.1 predicted that there was a docking site for miR-19a- 3p in the 3′ UTR of PHLDA3 (). The relationship of miR‐19a-3p expression with the survival outcomes in sarcoma patients was analyzed using ENCORI. The data illustrated that a low miR‐19a-3p level may estimate a better survival outcome (, p < 0.05). Furthermore, there was a clear negative association of miR-19a-3p expression with PHLDA3 expression in sarcoma cancer samples (, p < 0.01), as well as a negative modulation of miR-19a-3p on PHLDA3 expression in 143B/U2OS cells (). The analysis of luciferase reporter genes revealed a direct cross-talk of miR-19a-3p with the 3'UTR of PHLDA3 (, p < 0.01). These data illustrate that PHLDA3 is a direct target of miR-19a-3p.
Figure 7. PHLDA3 was a direct target of miR-19a-3p. (a) The candidate PHLDA3 miRNAs as predicted using online databases (ENCORI, TargetScan, and Tarbase). (b) The binding sites of PHLDA3 and miR-19a-3p as predicted by online TargetScan software. (c) High miR-19a-3p gene expression predicted a poorer survival outcome for sarcoma patients, as shown by the ENCORI software analysis. (d) Negative relationship of miR-19-3p content with PHLDA3 levels computed from sarcoma samples. (e-f) MiR-19a-3p inversely modulated PHLDA3 expression in 143B/U2OS cell lines, as explored via Western blot. (g) Schematic illustration of luciferase reporters harboring the wild-type docking site of miR-19a-3p on PHLDA3, named PHLDA3 wild type (PHLDA3 WT), and the mutant docking site, named PHLDA3 Mut. (h-k) PHLDA3 WT or Mut together with the miR-19a-3p mimics or inhibitor were transfected into 143B/U2OS cells. Luciferase activity was explored.
To confirm whether the effects of miR-19a-3p on OS cell proliferation along with migration were PHLDA3-dependent, we transfected miR-19a-3p into OS cells with or without PHLDA3 overexpression or knockdown. The MTT (, p < .05) and Transwell assays (, p < 0.05) results illustrated that restoration of PHLDA3 prevented the miR-19a-3p-induced increase in cell proliferation and migration. In contrast, PHLDA3 suppression prevented the miR-19a-3p inhibitor from decreasing cell proliferation (, p < .05) and migration (, p < 0.05).
Figure 8. MiR-19a-3p exerted its role on cell proliferation, metastasis, and chemo-sensitivity via dampening PHLDA3 expression. (a-c) The 143B/U2OS cells were inserted with miR-19a-3p mimic or NC via transfection for 24 h. (a) Cell viability based on MTT. (b-c) The migration of osteosarcoma cells examined using Transwell assays. (d-f) The 143B/U2OS cells were inserted with miR-19a-3p inhibitor or inhibitor NC via transfection for 24 h. (d) Cell viability based on MTT. (e-f) The migration of 143B/U2OS cells as explored via Transwell assay. (g-j) Transfected 143B/U2OS cells were untreated or inoculated with cisplatin (CDDP) for 24 h. Cell apoptosis was analyzed using Western blotting analysis of PARP (g-h) and MTT (i-j). The data in (A), (c), (D), (f), (i), and (j) were given as means ± SD, *p < .05, **p < .01, ***p < .001 vs. control.
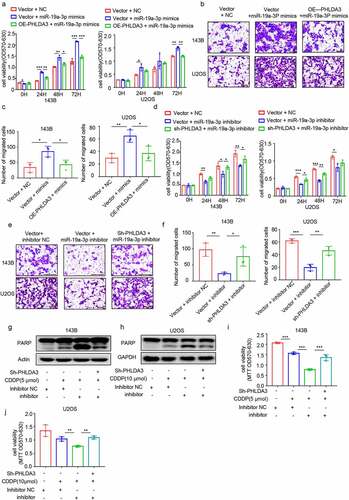
Furthermore, to investigate whether miR-19a-3p regulated chemoresistance in OS cells via suppressing the PHLDA3/Akt pathway, we evaluated cell apoptosis using Western blotting () and MTT (, p < 0.01). We observed that miR-19a-3p repressor increased chemosensitivity in 143B/U2OS cells, which was reversed by PHLDA3 knockdown. These data illustrated that miR‐19a‐3p has an oncogenic effect on OS cells by directly targeting PHLDA3.
4. Discussion
PHLDA3 is a novel tumor-related protein that mediates carcinogenesis of multiple cancers. However, the relevance of PHLDA3 in OS is still unknown. In this study, we explored the role of PHLDA3 in osteosarcoma and investigated the involvement of potential signaling pathway. We verified that PHLDA3 played a tumor suppressor role in osteosarcoma and suppressed cell proliferation, migration and enhanced cisplatin-induced cell apoptosis via regulating the Akt/ GSK-3β signaling pathway. Additionally, our data indicated that PHLDA3 was a true target of miR-19a-3b and miR-19a-3p promoted OS cell growth and migration by inhibiting PHLDA3 expression.
PHLDA3 was initially recognized as a p53 target gene with only a PH domain that competes with Akt. Accumulating studies have identified PHLDA3 as a vital tumor suppressor gene that is linked to tumorigenesis, disease progress along with poor prognosis in various human cancers. For example, decreased PHLDA3 expression was remarkably linked to tumor progress along with recurrence in individuals with squamous cell carcinomas, indicating a poor prognosis [Citation22]. Loss of heterozygosity (LOH) at the PHLDA3 gene locus is linked to the progress and malignant phenotype of pancreatic neuroendocrine tumors (PanNETs) [Citation13]. Moreover, several studies have demonstrated that PHLDA3 is differentially expressed in cisplatin-induced acute kidney injury patients [Citation23,Citation24]. In addition, PHLDA3 could regulate energy metabolism [Citation19], impede somatic cell reprogramming [Citation25], and ameliorate pressure overload-triggered cardiac remodeling [Citation26]. Consistently, we proved that PHLDA3 inhibited OS cell proliferation, migration and enhanced cisplatin-triggered cell apoptosis. Hence, our findings also revealed that PHLDA3 is a tumor repressor gene in OS and elevated PHLDA3 may be beneficial to decrease tumor size and clinical nursing of patients with OS.
As a PH domain-only protein, PHLDA3 may compete with Akt, another PH-domain-containing protein, for membrane lipid binding, thereby interfering with Akt translocation to the cellular membrane and activation. Most of the biological functions of PHLDA3 have been linked to blocking Akt signaling via its PH domain. It has been documented that PHLDA3 regulates the Akt/GSK3β signaling during somatic cell reprogramming [Citation25]. As expected, we established that the suppressor role of PHLDA3 in OS was still exerted by suppressing the Akt-GSK3β signaling. The Akt/GSK-3β signaling is a widely-known indispensable controller in different biological processes of the multifarious types of tumor cells [Citation27–30]. Accumulating evidence indicates that Akt/GSK-3β is linked to osteosarcoma progression [Citation31] and anti-chemotherapeutic drugs [Citation32]. Therefore, the role of the PHLDA3/Akt/GSK-3β signaling in the regulation of OS is self-evident.
A number of reports have documented that the expression of PHLDA3 is low in many different types of tumors. For example, PHLDA3 is inactivated by both LOH and methylation in various neuroendocrine tumors (NETs), such as Lung NETs and PanNETs [Citation33]. Typically, miRNAs can directly dock to the 3′ UTR of the targeted mRNA, inhibiting translation or causing mRNA degradation [Citation34,Citation35]. Hence, we adopted bioinformatics tools to identify a docking site for miR-19a-3p in the PHLDA3 3’-UTR. Interestingly, the data confirmed that miR-19a-3p represses PHLDA3 expression. As a member of the known oncomiR-17-92 cluster [Citation36], miR-19a-3p is frequently dysregulated and has pro-cancerous and pro-proliferative roles in many tumors, including gastric cancer [Citation37], hepatocellular carcinoma [Citation38], and breast cancer [Citation39]. Overexpression of miR-19a-3p was identified in OS cells, and silencing of miR-19a-3p promoted its chemosensitivity via escalating the expression of tumor repressor PTEN [Citation21]. Herein, we found that overexpressing miR-19a-3p increased OS cell proliferation, metastasis, and drug resistance. Thus, miR-19a-3p might have pro-tumorigenic effects in OS by inhibiting PHLDA3 expression.
5. Conclusion
Overall, our findings show that PHLDA3, a true target of miR-19a-3p, is less expressed in OS tissue specimens and suppresses the proliferation, malignant and chemoresistance biological behavior by affecting the Akt/GSK-3β signaling cascade. Furthermore, PHLDA3 may be considered an independent predictor of poor prognosis, as well as a prospective therapeutic target for OS patients.
Research highlights
PHLDA3 expression was low in osteosarcoma patients, and low content was linked to poor prognosis.
PHLDA3 suppressed osteosarcoma cell proliferation, migration, and chemoresistance via regulating the Akt/GSK-3β signaling.
miR-19a-3p inhibits PHLDA3 expression in osteosarcoma.
Disclosure statement
No potential conflict of interest was reported by the author(s).
Data availability statement
Data will be made available on request to the corresponding authors (http://dx.doi.org/10.1080/21655979.2022.2031404).
Additional information
Funding
References
- Wu Y, Xie Z, Chen J, et al. Circular RNA circTADA2A promotes osteosarcoma progression and metastasis by sponging miR-203a-3p and regulating CREB3 expression. Mol Cancer. 2019;18(1):73.
- Ma J, Gao W, Gao J. sCLU as prognostic biomarker and therapeutic target in osteosarcoma. Bioengineered. 2019;10(1):229–239.
- Shen S, Yao, T, Xu, Y, et al. CircECE1 activates energy metabolism in osteosarcoma by stabilizing c-Myc. Mol Cancer. 2020;19(1):151.
- Zheng D, Liu W, Xie W, et al. AHA1 upregulates IDH1 and metabolic activity to promote growth and metastasis and predicts prognosis in osteosarcoma. Signal Transduct Target Ther. 2021;6(1):25.
- Wang X, Qin G, Liang X, et al. Targeting the CK1alpha/CBX4 axis for metastasis in osteosarcoma. Nat Commun. 2020;11(1):1141.
- Tonella L, Pala V, Ponti R, et al. Prognostic and predictive biomarkers in stage III melanoma: current insights and clinical implications. Int J Mol Sci. 2021;22(9):4561.
- Fang J, Ge X, Xu W, et al. Bioinformatics analysis of the prognosis and biological significance of HMGB1, HMGB2, and HMGB3 in gastric cancer. J Cell Physiol. 2020;235(4):3438–3446.
- Leung SW, Chia-Jung C, Tsui-Chin H, et al. An integrated bioinformatics analysis repurposes an antihelminthic drug niclosamide for treating HMGA2-overexpressing human colorectal cancer. Cancers (Basel). 2019;11(10):1482.
- Huang S, Zhao J, Song J, et al. Interferon alpha-inducible protein 27 (IFI27) is a prognostic marker for pancreatic cancer based on comprehensive bioinformatics analysis. Bioengineered. 2021;12(1):8515–8528.
- Fan L, Cao X, Lei Y. MicroRNA miR-23b-3p promotes osteosarcoma by targeting ventricular zone expressed PH domain-containing 1 (VEPH1)/phosphatidylinositol 3-kinase/protein kinase B (PI3K/AKT) pathway. Bioengineered. 2021;12(2):12568–12582.
- Keremu A, Maimaiti X, Aimaiti A, et al. NRSN2 promotes osteosarcoma cell proliferation and growth through PI3K/Akt/MTOR and Wnt/beta-catenin signaling. Am J Cancer Res. 2017;7(3):565–573.
- Kawase T, Ohki R, Shibata T, et al. PH domain-only protein PHLDA3 is a p53-regulated repressor of Akt. Cell. 2009;136(3):535–550.
- Ohki R, Saito K, Chen Y, et al. PHLDA3 is a novel tumor suppressor of pancreatic neuroendocrine tumors. Proc Natl Acad Sci U S A. 2014;111(23):E2404–13.
- Ma S, Quan P, Yu C, et al. PHLDA3 exerts an antitumor function in prostate cancer by down-regulating Wnt/beta-catenin pathway via inhibition of Akt. Biochem Biophys Res Commun. 2021;571:66–73.
- Takikawa M, Ohki R. A vicious partnership between AKT and PHLDA3 to facilitate neuroendocrine tumors. Cancer Sci. 2017;108(6):1101–1108.
- F RM, AV Valoyes M, G Do Nascimento R, et al. Prognostic and predictive value of Pleckstrin homology-like domain, family A family members in breast cancer. Biomark Med. 2020;14(16):1537–1552.
- Zhang D, Lin J, Chao Y, et al. Regulation of the adaptation to ER stress by KLF4 facilitates melanoma cell metastasis via upregulating NUCB2 expression. J Exp Clin Cancer Res. 2018;37(1):176.
- Zhou K, Chen J, Wu J, et al. Profilin 2 promotes proliferation and metastasis of head and neck cancer cells by regulating PI3K/AKT/beta-catenin signaling pathway. Oncol Res. 2019;27(9):1079–1088.
- Cheng J, Huang Y, Zhang X, et al. TRIM21 and PHLDA3 negatively regulate the crosstalk between the PI3K/AKT pathway and PPP metabolism. Nat Commun. 2020;11(1):1880.
- Luo T, Zhou X, Jiang E, et al. Osteosarcoma cell-derived small extracellular vesicles enhance osteoclastogenesis and bone resorption through transferring MicroRNA-19a-3p. Front Oncol. 2021;11:618662.
- Zhang B, Liu Y, Zhang J. Silencing of miR-19a-3p enhances osteosarcoma cells chemosensitivity by elevating the expression of tumor suppressor PTEN. Oncol Lett. 2019;17(1):414–421.
- Saito M, Sada A, Fukuyo M, et al. PHLDA3 is an important downstream mediator of p53 in squamous cell carcinogenesis. J Invest Dermatol. 2021. DOI:10.1016/j.jid.2021.09.007.
- Lee CG, Kang YJ, Kim HS, et al. Phlda3, a urine-detectable protein, causes p53 accumulation in renal tubular cells injured by cisplatin. Cell Biol Toxicol. 2015;31(2):121–130.
- Lee CG, Kim JG, Kim HJ, et al. Discovery of an integrative network of microRNAs and transcriptomics changes for acute kidney injury. Kidney Int. 2014;86(5):943–953.
- Qiao M, Wu M, Shi R, et al. PHLDA3 impedes somatic cell reprogramming by activating Akt-GSK3beta pathway. Sci Rep. 2017;7(1):2832.
- Liu J, Liu X, Hui X, et al. Novel role for pleckstrin homology-like domain family a, member 3 in the regulation of pathological cardiac hypertrophy. J Am Heart Assoc. 2019;8(16):e011830.
- Liu L, Dai Y, Chen J, et al. Maelstrom promotes hepatocellular carcinoma metastasis by inducing epithelial-mesenchymal transition by way of Akt/GSK-3beta/Snail signaling. Hepatology. 2014;59(2):531–543.
- An P, Chen F, Li Z, et al. HDAC8 promotes the dissemination of breast cancer cells via AKT/GSK-3beta/Snail signals. Oncogene. 2020;39(26):4956–4969.
- Sun J, Tang Q, Gao Y, et al. VHL mutation-mediated SALL4 overexpression promotes tumorigenesis and vascularization of clear cell renal cell carcinoma via Akt/GSK-3beta signaling. J Exp Clin Cancer Res. 2020;39(1):104.
- Zhang S, Wang J, Chen T, et al. alpha-Actinin1 promotes tumorigenesis and epithelial-mesenchymal transition of gastric cancer via the AKT/GSK3beta/beta-Catenin pathway. Bioengineered. 2021;12(1):5688–5704.
- Zhang Y, Cheng H, Li W, et al. Highly-expressed P2X7 receptor promotes growth and metastasis of human HOS/MNNG osteosarcoma cells via PI3K/Akt/GSK3β/β-catenin and mTOR/HIF1α/VEGF signaling. Int J Cancer. 2019;145(4):1068–1082.
- Liang C, Yu, X, Xiong, N, et al. Pictilisib enhances the antitumor effect of doxorubicin and prevents tumor-mediated bone destruction by blockade of PI3K/AKT pathway. Front Oncol. 2020;10:615146.
- Chen Y, and Ohki R. p53-PHLDA3-Akt network: the key regulators of neuroendocrine tumorigenesis. Int J Mol Sci. 2020;21(11):4098.
- Lin J, Liao, S, Li, E, et al. circCYFIP2 acts as a sponge of mir-1205 and affects the expression of its target gene E2F1 to regulate gastric cancer metastasis. Mol Ther Nucleic Acids. 2020;21:121–132.
- Ren R, Yuan Z, Xu Z. miRNA-144 targeting DNAJC3-AS1 reverses the resistance of the breast cancer cell line Michigan Cancer Foundation-7 to doxorubicin. Bioengineered. 2021;12(2):9885–9892.
- Sun HX, Yang Z-F, Tang W-G, et al. MicroRNA-19a-3p regulates cell growth through modulation of the PIK3IP1-AKT pathway in hepatocellular carcinoma. J Cancer. 2020;11(9):2476–2484.
- Qiao F, Gong P, Song Y, et al. Downregulated PITX1 modulated by MiR-19a-3p promotes cell malignancy and predicts a poor prognosis of gastric cancer by affecting transcriptionally activated PDCD5. Cell Physiol Biochem. 2018;46(6):2215–2231.
- Jiang XM, Yu X-N, Liu -T-T, et al. microRNA-19a-3p promotes tumor metastasis and chemoresistance through the PTEN/Akt pathway in hepatocellular carcinoma. Biomed Pharmacother. 2018;105:1147–1154.
- Lee S, Lee, H, Bae, H, et al. Epigenetic silencing of miR-19a-3p by cold atmospheric plasma contributes to proliferation inhibition of the MCF-7 breast cancer cell. Sci Rep. 2016;6(1):30005.