
ABSTRACT
The purpose of this research was to explore the diagnostic/prognostic significance and prospective molecular mechanisms of mitogen-activated protein kinase kinase kinases (MAP3Ks) in hepatitis B virus (HBV)-related hepatocellular carcinoma (HCC). Diagnostic/prognostic significance of MAP3Ks was screened in the GSE1450 data set and validated in the Guangxi cohort. Various bioinformatics tools were used to explore the biological functions of prognosis-related genes. Subsequently, molecular biology assays were used to verify the biological functions and molecular mechanisms of specific gene. MAP3K9 was observed to be differentially expressed in HCC and adjacent tissues with satisfactory diagnostic value. It was discovered in survival analysis that MAP3K13 and MAP3K15 were associated with overall survival (OS) of patients with HBV-related HCC in the GSE1450 data set and the Guangxi cohort. Nomograms were established based on prognosis-related genes and clinical factors for individualized risk assessment. The assays on HCC cells demonstrated that MAP3K13 regulated the death and proliferation of HCC cells by activating the JNK pathway and inducing the expression of apoptosis-related factors. In conclusion, our results suggested that MAP3K9 might serve as a diagnostic biomarker in HBV-related HCC and MAP3K13 and MAP3K15 might serve as useful prognostic biomarkers. Besides, cytological assays prompted that MAP3K13 might impact the prognosis of HCC by regulating the JNK pathway and inducing apoptosis.
Graphical abstract

KEYWORDS:
Introduction
Globally, liver cancer has been reported as the second leading contributor to cancer-related death and its morbidity ranks fourth among all cancers [Citation1]. The inconsistent ranking between mortality and morbidity suggests that there is relatively bad prognosis for patients afflicted with hepatocellular carcinoma (HCC); however, the relatively high ranks for both mortality and morbidity clearly have consequential effects and socioeconomic burdens, and depending upon measures, indexes, and the types of quantitative terms used, the ranks for mortality and morbidity can nearly become equal to one another [Citation1,Citation2]. Some of the highest ranks for HCC have been identified in populations from the Asian-Pacific region, especially eastern Asian countries [Citation3]. Perhaps in line with such findings, in another study, China was found to have accounted for almost half of all the global cases of HCC [Citation4]. Hepatitis B virus (HBV), hepatitis C virus (HCV), aflatoxin, and abuse of alcohol were found to become the leading causes related to the incidence of liver cancer for patients from China [Citation5]. Among these patients, rates of death for liver cancer related to chronic HBV infection have reached 65.9% in male and 58.4% in female [Citation5]. Thus, the researchers reported that there were complex underlying functions of HBV that they acted as key components in tumorigenesis, which might have resulted from circuitous types of mechanisms. HBV nucleotide sequence integration into the host genome was also found to have led to consequent genome instability and mutations in the host cells that directly induced the expression of several cancer-related genes [Citation6,Citation7]. The overexpression of HBx and variations of the related types of preS/S envelope proteins could facilitate dysregulation of transcription and cell proliferation, whereby one result could be that liver cells become sensitive to oncogenically related factors [Citation8]. Accounts of silencing of p53 have been commonly accepted for assessments of tumors associated with HBV infection [Citation9,Citation10]. Reports have also indicated that there was significant ascension in rates of chromosomal alteration based upon examinations of HCC patients afflicted by HBV-related tumors ad patients who were not [Citation6,Citation11]. Compared with non-HBV-infected patients, chronic HBV-afflicted patients are 10–25 times more likely to subsequently develop liver cancer [Citation12]. Furthermore, patients with chronic HBV infections tend to develop more remarkably progressed cases of HCC at relatively younger ages than HCC cases that were solely related to NAFLD and alcohol abuse [Citation12,Citation13].
Table 1. Prognostic values of MAP3K gene expression for RFS in HBV-related HCC of GSE14520
Table 2. Prognostic values of MAP3K gene expression for OS in HBV-related HCC of GSE14520
One aspect related to the dynamics underlying HBV-related HCC is the MAPK signaling pathway [Citation14]. The MAPK signaling pathway includes a series of cytoplasmic phosphokinases that transduce and transmit signals related to levels of extracellular mitogen availability to the nucleus of the cell. Receptor-linked cytoplasmic tyrosine kinases are activated when a signaling molecule binds to the cell-surface receptor [Citation15]. The MAPK signaling pathway is similarly initiated by epidermal growth factor (EGF), whereupon EGFR becomes activated by EGF, and then Ras becomes activated by swapping its GDP for a GTP. This was followed by the activated form of Ras serving to motivate MAP3K, whereby MAP3K facilitates phosphorylation and activation of MAP2K, MAP2K itself becomes phosphorylated, and the ultimate form is an activated MAPK [Citation15–18]. This MAP3K-MAP2K-MAPK module serves as crucial medium for transducing information contained in extracellular stimuli into certain cellular responses, including such as differentiation, proliferation, and apoptosis [Citation19–22]. As MAP3K family members are indispensable part of the MAPK pathway, we hypothesized that MAP3K family members may play an important role in HCC. There were no researchers who have explored the molecular function and clinical significance of MAP3K family members in HCC so far. This research systematically analyzed the prognostic value of all members of the MAP3K family in HCC and then conducted bioinformatic and molecular biology studies on the regulation mechanisms of prognostically related genes.
Materials and methods
Data acquisition
Clinical features of 247 HCC-afflicted patients and whole transcriptome sequencing-based data from these patients in GSE1450 were acquired from the GEO database (accessed: 27 January 2020). As the main purpose of our study was to investigate measures of clinical significance of MAP3Ks in HBV-related HCC, patients without HBV infection were eliminated.
Tissue specimen collection
HCC and paracancerous tissues of 54 HBV-related HCC patients were collected in the First Affiliated Hospital of Guangxi Medical University (from 2018–03-22 to 2018–10-01). The tissue samples were immersed in the RNAlater Solutions immediately after separation (Thermo Fisher Scientific, USA). These tissue specimens were stored in the −80 refrigerator at ordinary times. This investigation had been approved by the ethics committee of Guangxi Medical University, the first affiliated hospital (Approval number: 2015 [KY‐E‐032]). All patients had been informed and had signed the informed consent before surgery.
Bioinformatic analyses of MAP3Ks
DAVID 6.8 (The Database for Annotation, Visualization and Integrated Discovery, accessed at 28 January 2020) was used for functional-based annotations for MAP3Ks [Citation23,Citation24]. In the options for annotations in ‘Summary Results’, we selected the KEGG database and gene ontology database. The function annotation chart was visualized in R Studio (Version 1.2.5033) using R packages: GOplot [Citation25], Hmisc [Citation26], and ggplot2v [Citation27].
Differential expression analysis and assessment of diagnostic value
GTEx Portal (https://www.gtexportal.org/) was used to acquire the expression of MAP3Ks in multiple human tissues [Citation28]. Unpaired t-tests were applied in order to inspect the expression levels of MAP3Ks between HCC and paracancerous tissues in GSE14520. We used Receiver Operating Characteristic (ROC) curves to assess measures of diagnostic efficiency of the MAP3Ks in GSE14520.
Survival analysis
The Kaplan-Meier (K-M) method with the log-rank test was applied to perform univariate survival analysis in GSE14520. It was used to analyze the relationship between MAP3K family genes and OS (overall survival)/RFS (recurrence-free survival). Besides, the Cox proportional hazards model was used to calibrate the impact of clinical variables for MAP3Ks in multivariate survival analysis.
Genes associated with prognostic significance were further integrated in combined effect survival analysis. A new variable was constructed based upon the expression levels of multiple prognosis-related MAP3Ks, and then the relationship between the variable and prognosis was explored.
qRT‑PCR
Total RNAs were isolated from HCC tissues and paracancerous tissues using the RNA Isolation solvent (Omega Bio-tek, Georgia, USA) according to the protocol. Isolated RNAs were reverse-transcribed into complementary DNA with the use a PrimeScriptTM RT reagent kit (Takara, Dalian, China). Quantitative real-time PCR (qRT-PCR) was performed on the QuantStudio 6 Flex Fluorescence Quantitative PCR Device (Thermo Fisher Scientific, Waltham, MA, USA) using SYBR Green Mix (Roche, Switzerland). The ΔΔCt method was used to calculate the relative gene expression. GAPDH was used as the internal control for MAP3Ks expression. Primer sequences are as follows: GAPDH, antisense prime (5’-CGCCCAATACGACCAAAT-3’), forward prime (5’-GTCAGCCGCATCTTCTTT-3’); MAP3K9, antisense prime (5’- AAAGATGGTCGTGAGTGGGG −3’), forward prime (5’- GTGGAGCTATGGGGTGCTAC-3’); MAP3K13, antisense prime (5’-GGGCTCCAAAACCTCTCCCA-3’), forward prime (5’-GATCCCCGACAGAACACTGAAAT-3’); and MAP3K15, antisense prime (5’-CGCTCATGTCTACCACAGCA-3’), forward prime (5’-GTATACGTGCGCAGTGAGAG-3’)
Nomogram and prognostic signature construction for HCC
Based upon the results from survival analysis, variables that were found to have been associated with OS/RFS were then incorporated into nomograms for predicting the 1-, 3-, and 5-year OS/RFS [Citation29]. Internal validation using the Bootstrap self-sampling method was applied to help evaluate the predictive power of the model.
In order to calculate risk scores for each patient, we established a prognostic model, which accounted for the expression level of prognostic genes [Citation29]. The calculation of risk scores was based upon a formula as follows: Risk score = expression of gene1 x β1 + expression of gene2 x β2+ … expression of Genen x βn [Citation30,Citation31], where βn is the regression coefficient derived from the result of multivariate Cox proportional hazards regression analyses for the corresponding gene. In consecutive order, we performed survival analyses for high- and low-risk groups. Furthermore, in order to verify measures of reliability and accuracy for the model, we constructed temporally oriented ROC-based curves using survivalROC package in R [Citation32].
Gene set enrichment analysis (GSEA)
We used GSEA to assess trends in distributions of genes included among a predefined set of genes in the phenotypic correlation sequence in order to determine their contribution to the phenotype. According to the characterization of the median levels of expression of MAP3K13 in the GSE14520 database, 212 HBV-related HCC patients were separated into a high and a low-MAP3K13 treatment group based upon the relative levels of expression. According to the median levels of expression of MAP3K15 in the GSE14520 database, 212 HBV-related HCC patients were separated into high- and low-MAP3K15 groups based on relative levels of expression. C2-curated gene sets (c2.all.v7.0.symbols.gmt) were selected as the basis factor sets in GSEA_4.0.3 (http://www.broadinstitute.org/gsea). GSEA-derived gene enrichment sets that attained a false discovery rate (FDR) of <0.25 and a P value of<0.05 were considered as the level of statistical significance at which enrichment sets with no difference between treatment groups would be rejected.
Cell transfection
RNA interfering for MAP3K13 was performed by virtue of Si-RNA, which was designed and synthesized by hanbio (https://www.hanbio.net/, Shanghai, China), with the sequence displayed in Table S2. Lipofectamine 3000 Transfection Reagent and Opti-MEM medium were purchased for Si-RNA transfection (Thermo Fisher Scientific, shanghai, China). Transfection was performed following the manufacturer’s protocol. Transfection efficiency was assessed at 48 h.
Western blot
Western blot assay was performed referring to the protocol of a previous study [Citation33]. Antibodies of GAPDH, JNK, BAX, Bcl, and MAP3K13 were purchased from WUHAN SANYING (Proteintech Group, Inc, USA). Antibody dilution and incubation times were in accordance with the corresponding manufacturer’s protocol.
CCK-8 assay
After 48 h of transfection, cells were collected for the CCK-8 assay. 2000 cells were added to each well of a 96-well plate, with four more duplicated plates prepared. 100 ul of CCK-8 reagent (DOJINDO, Shanghai, China) was added dropwise into each well. After 2 h of incubation at 37°C in a lucifugal room, the absorbance in 450 nm was detected using a Varioskan LUX microplate reader (Thermo Fisher Scientific, USA). Each assay was repeated three times. Student's t-test was used to examine the statistical significance between the experimental group and the control group.
Cell colony formation assay
After 48 h of transfection, 300 cells were collected and then added to each well of a 6-well plate. The cells were cultivated with plenty of medium for two weeks in a cell incubator at 37°C with 5% CO2. Cells are stained with crystal violet for 20 min. Each assay was repeated three times. Student’s t-test was used to examine the statistical significance between the experimental group and the control group.
Apoptosis assay
After 48 h of transfection, cells were collected for the apoptosis assay. BH3 hydrochloride (MedChemExpress, Shanghai, China), an apoptosis-inducing polypeptide, which induces apoptosis by activating Bax or neutralizing Bcl-2 [Citation34], was used for apoptosis induction. An AnnexinV-FITC/PI apoptosis kit (BD bioscience, USA) was applied in this study following the manufacturer’s protocol. Each assay was repeated three times. Student’s t-test was used to examine the statistical significance between the experimental group and the control group.
Statistical analyses
Statistical analyses were all conducted using SPSS version 24.0 (IBM Corporation, Armonk, NY, USA) and R 3.6.2. (https://www.r-project.org/). We used the Kaplan-Meier method with the log-rank test in univariate survival analyses for MAP3Ks and clinical features. Cox proportional hazard modeling was used in multivariable survival analyses. With respect to results for the unpaired t tests and log-rank tests and for results from Cox models, P values<0.05 were considered statistically significant. FDR control was fulfilled by using the Benjamini–Hochberg procedure and adjusted for multiple testing in GSEA.
Results
Data sources
In the GSE14520 data set, 35 patients with nonchronic HBV infection were excluded and 212 HBV-related HCC patients were reserved for subsequent analysis. After eliminating 35 non-HBV-related HCC patients, we obtained a total of 416 tissue samples with integral microarray data and detailed clinical/prognostic data. The 416 samples included 212 samples of tumor-afflicted tissues from HBV-related HCC patients and 204 samples of paracancerous tissues of these 212 patients, with paracancerous tissues of 8 patients absent.
Bioinformatic analysis of MAP3Ks
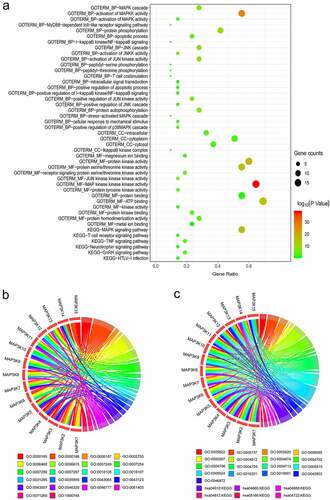
We visualized the results of bioinformatic analyses on DAVID’s website. The pathways, molecular functions, biological processes, and cellular components in which MAP3Ks are enriched, along with corresponding gene counts and P values, are shown in a bubble chart ()). The enrichment analysis results showed that MAP3K family genes were involved in many important biological pathways, such as MAPK signaling pathway and JUK signaling pathway. Details of MAP3Ks corresponding to specific pathways, molecular functions, biological processes, and cellular components are shown in chord diagrams (,c)).
Figure 1. Bioinformatics-based results from DAVID: (a) the pathways, molecular functions, biological processes, and cellular components in which MAP3Ks are enriched; (b and c) details of MAP3Ks corresponding to specific pathways, molecular functions, biological processes, and cellular components. DAVID, The Database for Annotation, Visualization and Integrated Discovery; MAP3Ks, mitogen-activated protein kinase kinase kinases.
Differential expression analysis and assessment of diagnostic value
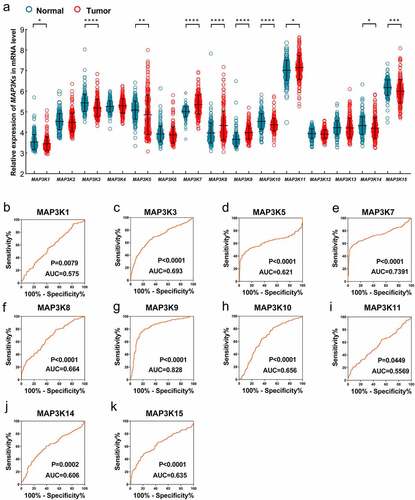
Differential expression analysis in GSE14520 indicated that expression of MAP3K1, MAPK3K3, MAP3K5, MAP3K7, MAP3K8, MAP3K9, MAP3K10, MAP3P11, MAP3K14, and MAP3K15 was significantly different between HCC and normal liver tissues ()). Compared with normal liver tissues, MAP3K1, MAP3K3, MAP3K5, MAP3K10, MAP3K14, and MAP3K15 were downregulated in HCC tissues, while MAP3K7, MAP3K8, MAP3K9, and MAP3K11 were upregulated in HCC tissues. Besides, ROC analysis showed that MAP3K9 gene had satisfactory diagnostic performance in HCC (AUC = 0.829, P < 0.001) ()), and the diagnostic value of other MAP3K in liver cancer was not significant ()).
Figure 2. Expression of MAP3Ks in HCC and normal live tissues: (a) expression level of MAP3K1-15 in HCC and normal live tissues; (b) ROC of MAP3K1, (c) ROC of MAP3K3, (d) ROC of MAP3K5, (e) ROC of MAP3K7, (f) ROC of MAP3K8, (g) ROC of MAP3K9, (h) ROC of MAP3K10, (i) ROC of MAP3K11, (j) ROC of MAP3K14, and (k) ROC of MAP3K15MAP3Ks, mitogen-activated protein kinase kinase kinases; HCC, hepatocellular carcinoma; ROC, receiver operating characteristic curve.
Survival analysis in GSE14520
Gender (P = 0.021), cirrhosis (P = 0.036), and BCLC stage (P < 0.001) were associated with the RFS of HBV-related HCC, and the AFP level (P = 0.049), BCLC stage (P < 0.001), cirrhosis (P = 0.041), and tumor size (P = 0.002) were independent predictors for OS (Table S1).
MAPK15 (log-rank P = 0.001; adjusted P = 0.004; , )) was associated with RFS of HBV-related HCC. MAP3K13 (log-rank P = 0.013; adjusted P = 0.032; , )) and MAPK15 (log-rank P = 0.001; adjusted P = 0.012; , )) were associated with OS of the HBV-related HCC.
Figure 3. Survival analysis-based results of MAP3Ks for RFS in HBV-related HCC: (a–o) Survival curve for MAP3K1-15 for RFS of HBV-related HCC; MAP3Ks, mitogen-activated protein kinase kinase kinases; RFS, recurrence-free survival; HCC, hepatocellular carcinoma.
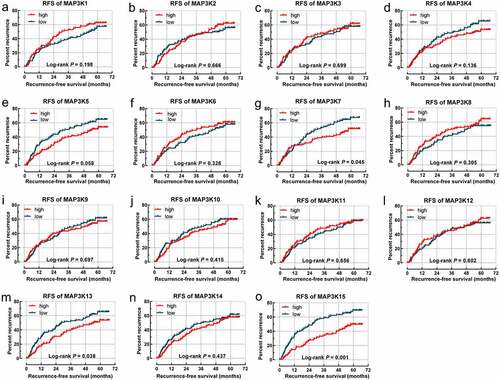
Figure 4. Survival analysis-based results of MAP3Ks for OS in HBV-related HCC: (a–o) sSurvival curve for MAP3K1-15 for OS of HBV-related HCC; (p) joint effect survival analyses of MAP3K13 and MAP3K15 for OS of HBV-related HCC. MAP3Ks, mitogen-activated protein kinase kinase kinases; OS, Overall survival; HBV, Hepatitis B Virus; HCC, hepatocellular carcinoma.
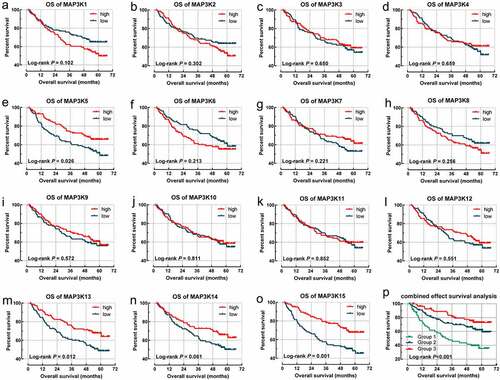
We integrated MAP3K13 and MAP3K15 into joint survival analysis. With high levels of expression of both MAP3K13 and MAP3K15 observed to be associated with better outcomes in OS, we preliminarily considered that both genes played a beneficial role in HBV-related HCC. Patients were divided into three groups (group IDs: 1, 2, and 3) based upon the grouping methods further outlined in . There were significant differences among the OS of groups 1, 2, and 3 (P < 0.001; and )). The HCC patients in group 1 with high expression of MAP3K13 and MAP3K15 tend to be accompanied by the worst outcome.
Table 3. Joint effects analysis of MAP3K13 and MAP3K15 expression for OS in in HBV-related HCC of GSE14520
Nomogram and prognostic signature
The levels of AFP, the stage of BCLC, status of Cirrhosis, tumor size, levels of MAP3K13, and levels of MAP3K15 were incorporated into a nomogram for a visual representation of OS ()). The curves from the prediction group and the observation-based group fit well with respect to one another and OS rates ().
Figure 5. Nomogram for predicting 1-, 2-, and 3-year OS/RFS of HCC: (a) Nomogram for OS; (b–d) verification model for Nomogram in 1-, 2-, and 3-year OS, respectively. and (e) Nomogram for RFS; (f–h) verification model for Nomogram in 1-, 2-, and 3-year RFS, respectively. OS, overall survival; RFS, rrecurrence-free survival; HCC, hepatocellular carcinoma.
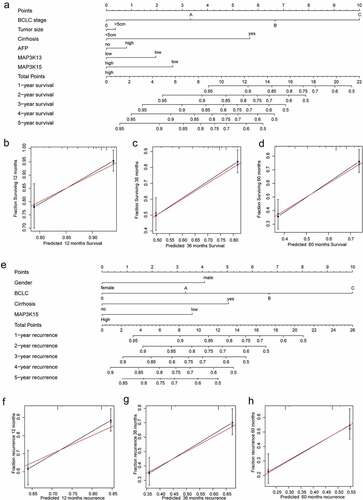
Gender, the stage of BCLC, status of cirrhosis, and MAP3K15 were incorporated into the nomogram for RFS (). The curves of the prediction group and the observation-based group fit well with respect to one another and RFS rates ().
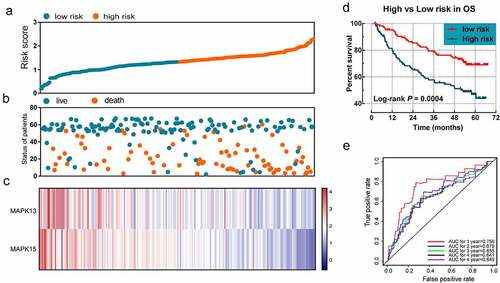
MAP3K13 and MAP3K15 were selected for evaluating the prognostic signature of OS. The regression coefficients for MAP3K13 and for MAP3K15 were −0.488 and −0.550, respectively. The formula used for the risk in OS was as follows: risk score = expression value of MAP3K13 × −0.488 + expression value of MAP3K15 × −0.550. Survival analyses indicated that the risk score was significantly related to the OS rate (log-rank P < 0.001). The prognostic signature effectively predicted the OS rate of HBV-related HCC patients (1-year AUC = 0.756, 2-year AUC = 0.679, 3-year AUC = 0.655, 4-year AUC = 0.641, and 5-year AUC = 0.649; ).
Figure 6. The prognostic signature in terms of expression of MAP3K13 and MAP3K15 for HBV-related HCC: (a) risk score plot; (b) survival status scatter plot; (c) heat map of the levels of expression of MAP3K13 and MAP3K15 in low- and high-risk groups; (d) Kaplan-Meier curves for low- and high-risk groups; and (e) receiver operating characteristic curve for predicting 1-, 2-, and 3-year survival rates in patients with HBV-related HCC by risk score. MAP3K, mitogen-activated protein kinase kinase kinase. HBV, Hepatitis B Virus; HCC, hepatocellular carcinoma.
GSEA
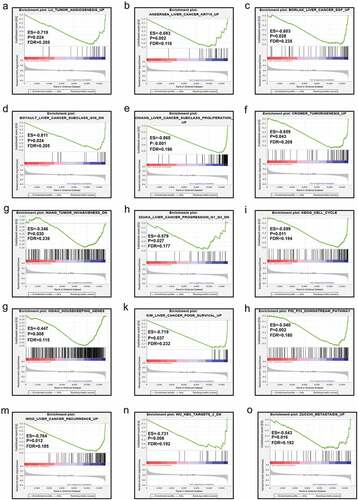
The results from GSEA indicated that the low expression level of MAP3K13 was involved in the dynamics underlying liver cancer including the myc pathway, JNK pathway, and metastasis, resulting in the decrease in liver cancer survival rates. (). Furthermore, MAP3K15 was associated with liver cancer subclasses, tumorigenesis, cell cycle dynamics, tumor angiogenesis, the progression of liver cancer, and increased rates of recurrence of liver cancer ().
Figure 7. GSEA in terms of MAP3K13 in GSE14520 based on C2-curated gene sets. GSEA, Gene Set Enrichment Analysis; C2 curated gene sets, the C2 collection contains two subcollections: chemical and genetic perturbations (CGPs) and canonical pathways (CPs).
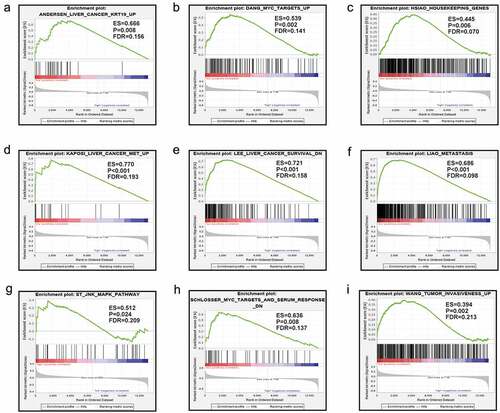
Figure 8. GSEA in terms of MAP3K15 in GSE14520 based on C2-curated gene sets. GSEA, Gene Set Enrichment Analysis; C2-curated gene sets, the C2 collection contains two subcollections: chemical and genetic perturbations (CGPs) and canonical pathways (CPs).
Validation in the Guangxi cohort
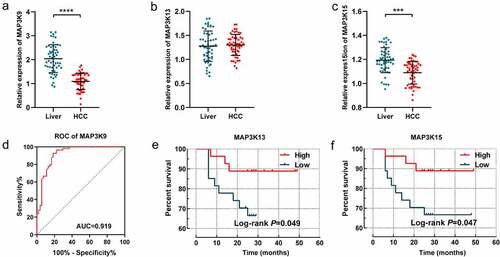
The expression difference of MAP3K9, MAP3K13, and MAP3K15 between HCC tissues and adjacent normal tissues was further assessed in the Guangxi cohort. Besides, prognostic significance of MAP3K13 and MAP3K15 was also further demonstrated in 54 patients hospitalized in the First Affiliated Hospital of Guangxi Medical University. It is consistent with the result of GSE14520 that MAP3K9 was observably more highly expressed in HCC tissues, compared with paracarcinoma tissues (P < 0.001, )); The diagnostic performance of MAP3K9 was also superior in the Guangxi cohort (P < 0.001, AUC = 0.696, )). There was no significant expression difference of MAP3K13 observed between HCC tissue and normal liver tissues. High expression of MAP3K13 (P = 0.049, )) and MAP3K15 (P = 0.049, )) was respectively demonstrated to be associated with better prognosis of HCC patients in the Guangxi cohort.
Figure 9. Validation of the diagnostic/prognostic significance of MAP3Ks in the Guangxi cohort: (a-c) relative expression of MAP3K9, MAP3K13, and MAP3K15 between HCC and normal liver tissues; (d) ROC of MAP3K9; (e) survival curve of MAP3K13; and (E) survival curve of MAP3K15.
Biological function of MAP3K13 in HCC cell lines
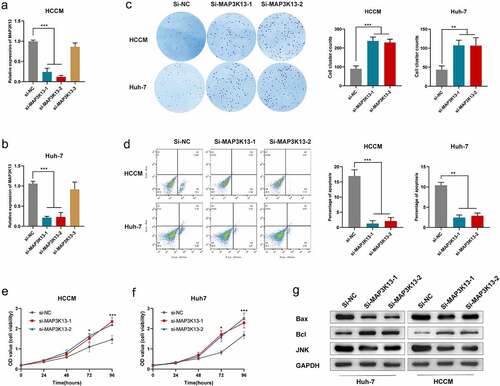
The survival analysis results suggested that MAP3K13 was a protective factor in HCC, and the bioinformatic analysis revealed that MAP3K13 was associated with the JNK signal pathway () and 7(g)). Three si-RNAs were designed by the manufacturer for MAP3K13, among which the knockdown efficiencies of si-1 and si-2 were satisfactory in HCCM cells and Huh-7 cells (,b)). The colony formation ability of HCCM cells and Huh-7 cells was significantly enhanced after si-MAP3K13 transfection ()). The apoptosis of HCCM cells and Huh-7 cells was significantly restrained after si-MAP3K13 transfection under intervention of BH3 hydrochloride (5uM) ()). The proliferation of HCCM cells and Huh-7 cells was significantly promoted after si-MAP3K13 transfection (,f)). Thus, it could be seen that MAP3K13 knockdown significantly increased the malignant phenotypes of HCC cells. Moreover, expression levels of JNK and BAX were significantly reduced after MAP3K13 knockdown in HCCM and Huh-7 cells, while the expression level of Bcl was elevated.
Figure 10. Effects of MAP3K13 knockdown on HCC cells: xpression level of MAP3K13 in HCCM cells (a) and Huh-7 cells (b) after si-MAP3K13/si-NC transfection; (c) the number of colonies of HCCM and Huh-7 cells after two weeks of transfection; (d) under intervention of BH3 hydrochloride (5uM), the apoptosis ratio of HCCM cells and Huh-7 cells after si-MAP3K13/si-NC transfection; cell viability curve of HCCM cells (e) and Huh-7 cells (f) after si-MAP3K13/si-NC transfection; (g) expression level of JNK, Bcl, and Bax in HCCM cells and Huh-7 cells after si-MAP3K13/si-NC transfection. * P < 0.05, ** P < 0.01, *** P < 0.001, and **** P < 0.0001.
Discussion
Bioinformatics has now emerged as a viable method for screening potential clinically useful molecular targets [Citation35,Citation36]. In this investigation, it was observed that MAP3K1, MAP3K3, MAP3K5, MAP3K10, and MAP3K15 were upregulated in HCC tumor tissues, whereas MAP3K7, MAP3K8, MAP3K9, and MAP3K11 were downregulated in tumor tissues in GSE14520. Although neither prognostic value nor diagnostic value was observed in MAP3K7 in our assessments, studies have indicated that MAP3K7 was a chock block in tumorigenesis of HCC [Citation37–39]. Beyond that, although we found no significantly different levels of expression of MAP3K6 between the tumor and the normal tissues, we only could identify a single study which suggested that MAP3K6 may be involved in the dynamics underlying self-renewal and differentiation of tumor progenitor cells [Citation40].
In our diagnostics-related analyses, we identified that MAP3K9 (also known as MLK1) demonstrated good diagnostic efficacy in HBV-related HCC for the first time, and we believe that this feature of MAP3K has never been reported before in examinations of HCC. We performed this analysis at the levels of mRNA, in hope that these results could be extended to clinical applications. However, there are still further studies that can be carried out in the future to explore whether the content of the MAP3K9 gene products taken from samples such as blood and bile from HCC patients could differ those taken from the normal population, as data for these media were not available in the present study. As MAP3K9 has been reported to activate the c-Jun N-terminal kinase (JNK) MAPK signal pathway, consequently, it can act to help regulate two pivotal downstream targets in MAPK-based cascades, including p38 and extracellular signal-regulated kinase (ERK) [Citation41]. The c-Jun N-terminal kinase (JNK) MAPK pathway is known to be mainly involved in the dynamics underlying cell survival and programmed cell death, and it can influence migration and mesenchymal-epithelial transitions (EMT) as well [Citation42–45]. The function and regulation of the MAPK signaling pathway in HCC patients have been extensively studied, but whether MAP3K9 plays a key role in liver cancer, as well as its mechanisms, remained unknown. Thus, our study could provide information leading to the development of a novel target or biomarker for further application in the study of MAPK signaling pathways and their dynamics, which could influence HCC.
MAP3K13, also known as leucine zipper-bearing kinase (LZK), is a member of the mixed lineage kinase (MLK) family, a subfamily of MAP3Ks [Citation46]. The survival analyses we used in our study revealed that upregulation of MAP3K13 was associated with good OS outcomes in HBV-related HCC patients. Prior to our research, MAP3K13 has never been observed to be correlated with survival of HCC patients via the MAP3K13-TRIM25-FBXW7α-Myc axis [Citation47]. A similar type of regulatory pattern has been reported in breast cancer in which microRNA-206 impacted cancer cell proliferation by inducing restraint of MAP3K13 [Citation48]. It has also been reported that MAP3K13 may play key roles in the dynamics underlying tumors via impacting the NF-kappaB (NF-ĸB) [Citation49], JNK [Citation50], and the p53 [Citation48,Citation51] signaling pathways. It is also worth noting that the JNK cascade in which MAP3K13 is an indispensable component, plays an important role in stress-related response and in apoptosis that can be induced by various stimuli [Citation52]. In this study, we observed that there was a lower level of expression of MAP3K13 in cancerous tissues. Hence, we considered that the carcinogenesis of HBV-related HCC samples might have partly resulted from insufficient apoptosis caused by decreased levels of expression of MAP3K13.
In our investigations, MAP3K15 was also identified to be associated with OS rates of HBV-related HCC. The physiological impacts of MAPK3K15 are poorly understood. MAPK3K15 is also known as apoptosis signal-regulating kinase 1(ASK3) and was named in recent years based on sequence homology of ASK1 and ASK2. Previous research has indicated that MAPK3K15 was required for cell death and its production can be induced by anti-Fas monoclonal antibodies, tumor necrosis factor alpha (TNF), or oxidative stress [Citation53]. Thus, our findings might have suggested that the MAPK3K15 gene could be included as a new and crucial member in apoptotic signaling kinase and could play a key role in signal transduction pathways related to apoptotic cell death triggered by cell stress. Furthermore, our results suggested that MAP3K15 might also play a role in the dynamics and mechanisms underlying HCC through its corresponding roles aforementioned in relation to apoptosis.
In addition to findings from survival analyses for each single MAP3K gene to help predict the prognoses for HBV-related HCC patients, we have identified possible prognostic targets and conducted the bioinformatics analysis of these targets. We have also integrated genes with significant prognostic value into a prognostic signature model. The prognostic signature helped to delineate data based upon differences and cutoffs between high- and low-risk groups based upon high and low levels of expression of MAP3K13/MAP3K15. In the nomogram, we were able to intuitively observe measures of the influence of each variable on prognosis upon certain values. BCLC was the most important prognostic variable in our assessment, which indirectly reflected the rationality and practicability of BCLC in liver cancer staging. Although not as effective as BCLC, we did find that MAP3K13 and MAP3K15 were better than AFP and tumor size in predicting prognosis. Validation plots of the nomogram for 1-, 3-, and 5- year OS rates showed a good match of predicted and observed data.
Results of GSEA revealed that low levels of expression of MAP3K13 and MAP3K15 were involved in dynamics underlying cancer development, and these were essentially consistent with the results of our own study. MAP3K13 was found to be commonly expressed, but its expression was at a low level in cancer tissues, and HCC patients with a low level of expression of MAP3K13 typically have bad prognosis, which suggested that MAP3K13 was a tumor suppressor gene. Similarly, the result might be the same for MAP3K15.
There are some defects in our study, which could be improved at the next stage of this work. First, the sample size was not very large. The sample was also derived from a single center, which could only be or might mainly be representative of the characteristics of the specific site of that center. Second, we failed to conduct further experiments to verify the potential mechanisms identified in this study as this was a large endeavor. We expect that we will gradually make improvements in follow-up work.
Although there were several limitations in our investigation, we have helped to uncover the correlation between MAP3Ks and the prognosis/diagnosis of HBV-related HCC patients. In conclusion, we observed and determined the diagnostic value of MAP3K9 in HBV-related HCC and the prognostic value of MAP3K13 and MAP3K15 in HBV-related HCC in this study. We established a nomogram based upon clinical characteristics and levels of expression of genes to help us accurately calculate the risk score of each patient. The prognostic signature based upon the levels of expression of MAP3K13 and MAP3K15 was satisfactory, and it predicted the survival fit with the actual one in a high degree.
Conclusion
This article systematically studied the clinical value of MAP3K family members in HCC. We found that MAP3K9 might be a potential clinical diagnostic indicator in HCC with satisfactory diagnostic efficacy. MAP3K13 and MAP3K15 might be useful in predicting the prognosis of HCC patients. Subsequent cytological tests demonstrated that MAP3K13 induced apoptosis of HCC cells by activating the JNK pathway. Knockdown of MAP3K13 significantly enhanced cell proliferation and affected the sensitivity of HCC cells to apoptosis-inducing agents. Our study showed that MAP3K13 is a tumor suppressor and the genetic regulation of MAP3K significantly affects the JNK signaling pathway and apoptotic phenotype of HCC cells.
Authors’ contributions
Z L conceived and designed the study; X Z acquired and processed the raw data. P Z, C B, and Xi Y performed the data analysis. Z L organized the results to draw conclusions, visualized the data in the results, and wrote the manuscript. H Y and Y X guided and supervised the manuscript writing. All the authors read and approved the final manuscript.
Availability of data and materials
The data sets used and/or analyzed during the current study are available from the corresponding author on reasonable request.
Ethics approval and consent to participate
This investigation had been approved by the ethics committee of Guangxi Medical University, the first affiliated hospital (Approval number: 2015 [KY‐E‐032]). All patients had been informed and had signed an informed consent before surgery.
Supplemental Material
Download MS Word (21.9 KB)Acknowledgements
The authors thank the contributors to the GEO database (https://www.ncbi.nlm.nih.gov/geo/info/datasets) and for sharing RNA-Sequencing data of patients with HCC and corresponding clinical and survival data of these patients on open access. We also appreciate GTEx Portal database for sharing the expression profile of human tissues and organs. We sincerely thank the patients in the Guangxi cohort for donating their tissue specimens and wish them a long recurrence-free survival.
Disclosure statement
No potential conflict of interest was reported by the author(s).
Supplementary material
Supplemental data for this article can be accessed here
Additional information
Funding
References
- Bray F, Ferlay J, Soerjomataram I, et al. Global cancer statistics 2018: GLOBOCAN estimates of incidence and mortality worldwide for 36 cancers in 185 countries. CA Cancer J Clin. 2018;68(6):394–424.
- Ryerson AB, Eheman CR, Altekruse SF, et al. Annual report to the nation on the status of cancer, 1975-2012, featuring the increasing incidence of liver cancer. Cancer. 2016;122(9):1312–1337.
- Akinyemiju T, Abera S, Ahmed M, et al. The burden of primary liver cancer and underlying etiologies from 1990 to 2015 at the global, regional, and national level: results from the global burden of disease study 2015. JAMA Oncol. 2017;3(12):1683–1691.
- Chen W, Zheng R, Baade PD, et al. Cancer statistics in China, 2015. CA Cancer J Clin. 2016;66(2):115–132.
- Fan J-H, Wang J-B, Jiang Y, et al. Attributable causes of liver cancer mortality and incidence in China. Asian Pac J Cancer Prev. 2013;14(12):7251–7256.
- Levrero M, Zucman-Rossi J. Mechanisms of HBV-induced hepatocellular carcinoma. J Hepatol. 2016;64(1 Suppl). DOI:10.1016/j.jhep.2016.02.021
- Tu T, Mason WS, Clouston AD, et al. Clonal expansion of hepatocytes with a selective advantage occurs during all stages of chronic hepatitis B virus infection. J Viral Hepat. 2015;22(9):737–753.
- Guerrieri F, Belloni L, Pediconi N, et al. Molecular mechanisms of HBV-associated hepatocarcinogenesis. Semin Liver Dis. 2013;33(2):147–156.
- Schulze K, Imbeaud S, Letouze E, et al. Exome sequencing of hepatocellular carcinomas identifies new mutational signatures and potential therapeutic targets. Nat Genet. 2015;47(5):505–511.
- Kan Z, Zheng H, Liu X, et al. Whole-genome sequencing identifies recurrent mutations in hepatocellular carcinoma. Genome Res. 2013;23(9):1422–1433.
- Cougot D, Neuveut C, Buendia MA. HBV induced carcinogenesis. J Clin Virol. 2005;34(Suppl 1):S75–S78.
- Fattovich G, Stroffolini T, Zagni I, et al. Hepatocellular carcinoma in cirrhosis: incidence and risk factors. Gastroenterology. 2004;127(5 Suppl 1):S35–50.
- Sherman M. Risk of hepatocellular carcinoma in hepatitis B and prevention through treatment. Cleve Clin J Med. 2009;76(Suppl 3):S6–9.
- Torresi J, Tran BM, Christiansen D, et al. HBV-related hepatocarcinogenesis: the role of signalling pathways and innovative ex vivo research models. BMC Cancer. 2019;19(1):707.
- Chang L, Karin M. Mammalian MAP kinase signalling cascades. Nature. 2001;410(6824):37–40.
- English J, Pearson G, Wilsbacher J, et al. New insights into the control of MAP kinase pathways. Exp Cell Res. 1999;253(1):255–270.
- Avruch J, Khokhlatchev A, Kyriakis JM, et al. Ras activation of the Raf kinase: tyrosine kinase recruitment of the MAP kinase cascade. Recent Prog Horm Res. 2001;56:127–155.
- Raman M, Chen W, Cobb MH. Differential regulation and properties of MAPKs. Oncogene. 2007;26(22):3100–3112.
- Cargnello M, Roux PP. Activation and function of the MAPKs and their substrates, the MAPK-activated protein kinases. Microbiol Mol Biol Rev. 2011;75(1):50–83.
- Kim EK, Choi E-J. Pathological roles of MAPK signaling pathways in human diseases. Biochim Biophys Acta. 2010;1802(4):396–405.
- Chen B, Cao X, Lu H, et al. N-(3-oxo-acyl) homoserine lactone induced germ cell apoptosis and suppressed the over-activated RAS/MAPK tumorigenesis via mitochondrial-dependent ROS in C. elegans. Apoptosis. 2018;23(11–12):626–640.
- Frank SB, Berger PL, Ljungman M, et al. Human prostate luminal cell differentiation requires NOTCH3 induction by p38-MAPK and MYC. J Cell Sci. 2017;130(11):1952–1964.
- Dennis G, Sherman BT, Hosack DA, et al. DAVID: database for annotation, visualization, and integrated discovery. Genome Biol. 2003;4(5):3.
- Huang DW, Sherman BT, Lempicki RA. Systematic and integrative analysis of large gene lists using DAVID bioinformatics resources. Nat Protoc. 2009;4(1):44–57.
- Nolan DJ, Ginsberg M, Israely E, et al. Molecular signatures of tissue-specific microvascular endothelial cell heterogeneity in organ maintenance and regeneration. Dev Cell. 2013;26(2):204–219.
- Liu K, Feng F, Chen X-Z, et al. Comparison between gastric and esophageal classification system among adenocarcinomas of esophagogastric junction according to AJCC 8th edition: a retrospective observational study from two high-volume institutions in China. Gastric Cancer. 2019;22(3):506–517.
- Ito K, Murphy D. Application of ggplot2 to Pharmacometric Graphics. CPT Pharmacometrics Syst Pharmacol. 2013;2:e79.
- GTEx Consortium. The genotype-tissue expression (GTEx) project. Nat Genet. 2013;45(6):580–585.
- Iasonos A, Schrag D, Raj GV, et al. How to build and interpret a nomogram for cancer prognosis. J Clin Oncol. 2008;26(8):1364–1370.
- Liao X, Huang K, Huang R, et al. Genome-scale analysis to identify prognostic markers in patients with early-stage pancreatic ductal adenocarcinoma after pancreaticoduodenectomy. Onco Targets Ther. 2017;10:4493–4506.
- Liao X, Zhu G, Huang R, et al. Identification of potential prognostic microRNA biomarkers for predicting survival in patients with hepatocellular carcinoma. Cancer Manag Res. 2018;10:787–803.
- Heagerty PJ, Zheng Y. Survival model predictive accuracy and ROC curves. Biometrics. 2005;61(1):92–105.
- Wang XK, Liao XW, Zhou X, et al. Oncogene UBE2I enhances cellular invasion, migration and proliferation abilities via autophagy-related pathway resulting in poor prognosis in hepatocellular carcinoma. Am J Cancer Res. 2020;10(12):4178–4197.
- Shukla S, Saxena S, Singh BK, et al. BH3-only protein BIM: an emerging target in chemotherapy. Eur J Cell Biol. 2017;96(8):728–738.
- Cao J, Zhang C, Jiang G-Q, et al. Identification of hepatocellular carcinoma-related genes associated with macrophage differentiation based on bioinformatics analyses. Bioengineered. 2021;12(1):296–309.
- Chen S, Wei Y, Liu H, et al. Analysis of Collagen type X alpha 1 (COL10A1) expression and prognostic significance in gastric cancer based on bioinformatics. Bioengineered. 2021;12(1):127–137.
- Malato Y, Willenbring H. The MAP3K TAK1: a chock block to liver cancer formation. Hepatology. 2010;52(4):1506–1509.
- Inokuchi S, Aoyama T, Miura K, et al. Disruption of TAK1 in hepatocytes causes hepatic injury, inflammation, fibrosis, and carcinogenesis. Proc Natl Acad Sci USA. 2010;107(2):844–849.
- Bettermann K, Vucur M, Haybaeck J, et al. TAK1 suppresses a NEMO-dependent but NF-kappaB-independent pathway to liver cancer. Cancer Cell. 2010;17(5):481–496.
- Huang G, Jiang H, He Y, et al. LncMAPK6 drives MAPK6 expression and liver TIC self-renewal. J Exp Clin Cancer Res. 2018;37(1):105.
- Gallo KA, Johnson GL. Mixed-lineage kinase control of JNK and p38 MAPK pathways. Nat Rev Mol Cell Biol. 2002;3(9):663–672.
- Mandić AD, Bennek E, Verdier J, et al. c-Jun N-terminal kinase 2 promotes enterocyte survival and goblet cell differentiation in the inflamed intestine. Mucosal Immunol. 2017;10(5):1211–1223.
- Arthur-Farraj PJ, Latouche M, Wilton DK, et al. c-Jun reprograms Schwann cells of injured nerves to generate a repair cell essential for regeneration. Neuron. 2012;75(4):633–647.
- Lin G, Yu B, Liang Z, et al. Silencing of decreases cell migration, invasion, and EMT in radioresistant human nasopharyngeal carcinoma cell line CNE-2R. Onco Targets Ther. 2018;11:3805–3815.
- Wang G, Bai X, Jiang G, et al. GIT1 overexpression promotes epithelial-mesenchymal transition and predicts poor prognosis in hepatocellular carcinoma. Bioengineered. 2021;12(1):30–43.
- Sakuma H, Ikeda A, Oka S, et al. Molecular cloning and functional expression of a cDNA encoding a new member of mixed lineage protein kinase from human brain. J Biol Chem. 1997;272(45):28622–28629.
- Zhang Q, Li X, Cui K, et al. The MAP3K13-TRIM25-FBXW7α axis affects c-Myc protein stability and tumor development. Cell Death Differ. 2020;27(2):420–433.
- Han H, Chen Y, Cheng L, et al. microRNA-206 impairs c-Myc-driven cancer in a synthetic lethal manner by directly inhibiting MAP3K13. Oncotarget. 2016;7(13):16409–16419.
- Masaki M, Ikeda A, Shiraki E, et al. Mixed lineage kinase LZK and antioxidant protein-1 activate NF-kappaB synergistically. Eur J Biochem. 2003;270(1):76–83.
- Ikeda A, Hasegawa K, Masaki M, et al. Mixed lineage kinase LZK forms a functional signaling complex with JIP-1, a scaffold protein of the c-Jun NH(2)-terminal kinase pathway. J Biochem. 2001;130(6):773–781.
- Edwards ZC, Trotter EW, Torres-Ayuso P, et al. Survival of head and neck cancer cells relies upon LZK kinase-mediated stabilization of mutant p53. Cancer Res. 2017;77(18):4961–4972.
- Keshet Y, and Seger R. The MAP kinase signaling cascades: a system of hundreds of components regulates a diverse array of physiological functions. Methods Mol Biol. 2010;661:3–38.
- Kaji T, Yoshida S, Kawai K, et al. ASK3, a novel member of the apoptosis signal-regulating kinase family, is essential for stress-induced cell death in HeLa cells. Biochem Biophys Res Commun. 2010;395(2):213–218.