
ABSTRACT
Nasopharyngeal carcinoma (NPC) is a malignant tumor in the nasopharyngeal cavity. LncRNA PTPRG-AS1 is essential in NPC radiosensitivity. This study sought to explore the mechanism of PTPRG-AS1 in NPC radiosensitivity by regulating the miR-124-3p/LHX2 axis. First, NPC-related microarray was analyzed to screen differentially expressed lncRNAs. PTPRG-AS1 and miR-124-3p expression patterns in NPC tissues and adjacent tissues of NPC patients and NPC cell lines were detected by RT-qPCR. PTPRG-AS1 was knocked down in CNE2 and 5–8 F cells by transfection. The radiosensitivity, proliferation and apoptosis before and after radiotherapy (0/6 Gy) were detected by cloning formation assay, CCK-8 assay, and flow cytometry. Bioinformatics, Pearson correlation analysis, RNA pull-down, and luciferase reporter assays were performed to explore the regulatory relationship of the lncRNA PTPRG-AS1/miR-124-3/LHX2 axis. The corresponding functions were verified in the complementation test. The levels of LHX2 and Notch pathway-related proteins were detected by Western blot. PTPRG-AS1 was upregulated in NPC cell lines and tissues. PTPRG-AS1 knockdown decreased NPC cell proliferation and promoted radiotherapy-induced apoptosis and cell radiosensitivity. PTPRG-AS1 upregulated LHX2 as a ceRNA of miR-124-3p. miR-124-3p inhibition partially reversed PTPRG-AS1 silencing-induced NPC cell radiosensitivity. miR-124-3p targeted LHX2. LHX2 overexpression attenuated the miR-124-3p overexpression-induced NPC cell radiosensitivity. LHX2 attenuated NPC cell radiosensitivity by activating the Notch pathway. Briefly, lncRNA PTPRG-AS1 reduced NPC cell radiosensitivity by regulating the miR-124-3p/LHX2 axis through the ceRNA mechanism.
Graphical abstract
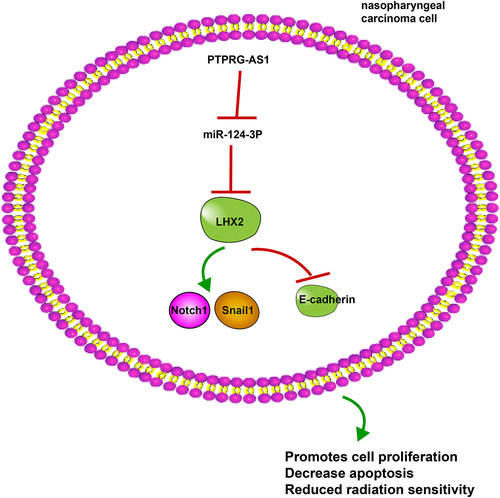
1. Introduction
Nasopharyngeal carcinoma (NPC) is epithelial cancer with a high risk of distant metastases arising from the mucosal lining of the nasopharyngeal, which is characterized by the distinct geographical distribution and is especially prevailing in East and Southeast Asia [Citation1]. Radiotherapy has long been identified to be the mainstay for NPC treatment [Citation2]. Accumulating evidence has confirmed that the concomitant treatment of chemotherapy and radiotherapy can significantly improve survival in patients with NPC [Citation3]. However, in spite of the fact that radiotherapy is an effective treatment for NPC, a majority of NPC patients experience radioresistance, local and distant metastasis, and cancer recurrence after treatment of radiotherapy alone, neoadjuvant chemotherapy combined with radiotherapy, or concurrent chemoradiotherapy, thus leading to poor prognoses [Citation4–6]. Therefore, studying the potential mechanism of radioresistance in NPC can provide more effective strategies for clinical treatment and prolong the survival time of patients with NPC.
Long noncoding RNAs (lncRNAs) are a novel variety of mRNA-like transcripts involved in the progression of various cancers, especially in the aspect of radioresistance in NPC [Citation7–9]. LncRNA PTPRG antisense RNA 1 (LncRNA PTPRG-AS1) is a newly found lncRNA, which is deregulated in diverse human malignancies and is identified as an essential modulator of the development of cancers [Citation10]. For example, PTPRG-AS1 deregulation has been reported to be involved in epithelial ovarian cancer, gastric cancer, and lung cancer [Citation11–13]. Based on the differential analysis, we found that lncRNA PTPRG-AS1 had the highest differential expression multiple, which was significantly upregulated in NPC. However, there are few reports about PTPRG-AS1 in NPC radiosensitivity. Only Liang Yi reveals that PTPRG-AS1 can act as a microRNA (miR)-194-3p sponge to regulate NPC cell radiosensitivity and metastasis [Citation14]. These findings have heightened interest in the possibility of providing new targets for the radiosensitivity of NPC in the aspect of PTPRG-AS1 and the exploration of its regulatory mechanism.
At the level of post-transcriptional, lncRNAs act as a ‘sponge’ and compete with miRNAs and function as a competing endogenous RNA (ceRNA) [Citation15]. We predicted that PTPRG-AS1 was mainly located in the cytoplasm and screened miR-124-3p as the downstream miRNA of lncRNA PTPRG-AS1. Moreover, recent studies provide evidence that miRNA-124 inhibits the stem-like properties and enhances the radiosensitivity in NPC cells by direct repressing JAMA expression [Citation16]. However, there is no domestic and foreign report at present on whether lncRNA PTPRG-AS1 can act as a ceRNA of miR-124-3p to affect the radiosensitivity of NPC cells.
LIM Homeobox 2 (LHX2) is a member of the LIM family that consists of 2 finger domains of zinc, which has the ability to regulate hair formation, embryonic development, and cell differentiation, and is identified as an oncogene in a variety of tumors [Citation17]. There is evidence to suggest that LHX2 is deregulated in NPC and plays a role in NPC treatment [Citation18]. miR-124 suppresses invasion and migration in non-small cell lung cancer (NSCLC) by inhibiting LHX2 [Citation19]. However, whether PTPRG-AS1/miR-124 regulates LHX2 through the ceRNA mechanism to manipulate NPC radiosensitivity is largely unknown. In light of the above-mentioned data, we speculated that lncRNA PTPRG-AS1/miR-124-3p might regulate the LHX2-dependent Notch pathway through the ceRNA mechanism to regulate NPC cell radiosensitivity. In this study, we analyzed NPC tissues and cell lines to explore the effect of lncRNA PTPRG-AS1 on radiosensitivity of NPC cells and its molecular mechanism, so as to provide a new reference for the clinical treatment of NPC.
2. Materials and methods
2.1 Bioinformatics analysis
Microarray data analysis: The NPC-related gene expression microarray GSE64634 was downloaded from the GEO database (https://www.ncbi.nlm.nih.gov/geo/), including 4 control samples and 12 tumor samples. The differentially expressed genes (DEGs) in the microarray were analyzed using the R language ‘limma’ (http://www.bioconductor.org/packages/release/bioc/html/limma.html), with |log2FC| > 1 and P value < 0.05 as the screening criteria. The heat map of DEGs was mapped using the ‘pheatmap’ package of R language (https://cran.r-project.org/web/packages/pheatmap/index.html).
LncRNA subcellular localization: The subcellular localization of lncRNAs was predicted using the LncLocator (http://www.csbio.sjtu.edu.cn/cgi-bin/lncLocator.py). The distribution proportion of the lncRNA in the cytoplasm, nucleus, ribosome, cytosol, and exosome was obtained after inputting nucleotide sequences [Citation20].
Prediction and analysis of the lncRNA targeting miRNAs and the miRNA targeting genes: The downstream miRNAs of the lncRNA were predicted using bioinformatics website StarBase (http://starbase.sysu.edu.cn/) and LncBase v2.0 (http://carolina.imis.athena-innovation.gr/diana_tools/web/index.php?r=lncbasev2%2Findex, Threshold = 0.8). Since the 2 websites used different binding site scoring algorithms, the jvenn tool (http://jvenn.toulouse.inra.fr/app/example.html) was used to get the intersection of the two results to increase the credibility. The KEGG enrichment analysis of candidate miRNAs was performed using the miRPathDB tool v2.0 (https://mpd.bioinf.uni-sb.de/). Select evidence: Experiment (weak + strong). The downstream target genes of the miRNA were further predicted using the StarBase, TargetScan (http://www.targetscan.org/vert_72/), and miRDB (http://mirdb.org/). Jvenn tool was used to extract overlap between the above results and upregulated DEGs (DEGs_up).
2.2 Clinical sample collection
The NPC tissue and adjacent tissue specimens of 61 NPC patients including 38 males and 23 females (30–36 years old, with an average age of 51.3 ± 7.2) who received the operation in The Second People’s Hospital of Lianyungang City from August 2020 to October 2021 were collected.
2.3 Cell culture
Human immortalized nasopharynx epithelial cell NP-69 and human NPC cell lines CNE2, HONE1, 5–8 F, C666-1, and 6–10B were all provided by Cell Bank of Chinese Academy of Sciences (Shanghai, China). NPC cells were cultured in the RPMI 1640 medium (Hyclone, Waltham, MA, USA) supplemented with 10% fetal bovine serum (FBS). Whereas NP-69 cells were cultured in the KSFM medium (Gibco, Grand Island, NY, USA). The cells were all cultured at 37°C containing 5% CO2. The medium was refreshed every 2 d. When cell confluence at the bottom of the culture dish reached 75%-90%, the cells were subcultured [Citation21].
2.4 Cell treatment and grouping
CNE2/5–8 F cells were allocated to the following 11 groups: blank group (without any treatment); si-NC group (transfected with siRNA-NC); si-PTPRG-AS1 group (transfected with PTPRG siRNA); si-PTPRG-AS1 + inhi-NC group (transfected with PTPRG siRNA and inhibitor-NC); si-PTPRG-AS1 + miR-inhi group (transfected with PTPRG siRNA and miR-124-3p inhibitor); mimic-NC group (transfection with mimics-NC); miR-mimics group (transfected with miR-124-3p mimic); miR-mimic + oe-NC group (transfected with miR-124-3p mimic and pcDNA-NC plasmid); miR-mimic + oe-LHX2 group (transfected with miR-124-3p mimic and pcDNA-LHX2 plasmid); miR-mimic + oe-LHX2+ GSI group and miR-mimic + oe-LHX2 + DMSO group [treated with 15 µM GSI or an equal volume DMSO for 24 h 22, and then transfected with miR-124-3p mimics and pcDNA-LHX2 plasmids. GSI (Merck, Darmastdt, Germany) is an inhibitor of the Notch pathway. The transfection process of all transfectants (siRNA/mimic/plasmids) (Shanghai GenePharma, Shanghai, China) was strictly under the instructions of LipofectamineTM2000 (Invitrogen, Carlsbad, CA, USA). After transfection, the final concentration of each transfectant was 50 nmol/L. The sequences of the siRNAs used were as follows: si-negative control (NC), forward, 5’-AGGUAGGCCCCUAUCAGCCGGC-3’ and reverse, 5’-AUGUGUCGAAUUCGCGUACG-3’; si-PTPRG-AS1, forward, 5’-UUCAAAUAUAUUUACUGAGCA-3’ and reverse, 5’-CUCAGUAAAUAUAUUUGAAUG-3’ [Citation22]. After 48 h of transfection, the following experiments were performed.
2.5 Reverse transcription quantitative polymerase chain reaction (RT-qPCR)
The TRIzol kit (Invitrogen) was used to extract the total RNA from cells or NPC tissues and paracancerous tissues. The PrimeScript RT reagent kit (Takara, Dalian, China) was used for reverse transcription of RNA into cDNA, and the qPCR was performed using SYBR_PremixExTaqII kit (Takara) on the CFX96 Real-Time PCR detection system (Bio-Rad, Hercules, CA, USA). The reaction conditions were: pre-denaturation at 95°C for 10 min and 40 cycles of denaturation at 95°C for 10s, annealing at 60°C for 20s and extending at 72°C for 34s. GAPDH and U6 were the internal references and the 2−ΔΔCt method was used for data analysis. All primers were designed and synthesized by Sangon Biotech (Shanghai, China) ()
Table 1. Primer sequence
2.6 Cloning formation assay
Cloning formation assay was performed to access NPC cell radiosensitivity after the incubation. The cells were seeded into 6-well plates (500, 1000, 2000, 3000, and 4000 cells/well in triplicate), cultured overnight, respectively exposed to irradiation with doses of 0, 2, 4, 6, and 8 Gy. Subsequently, 12 days after the culture, the surviving cells (> 50 cells) were stained with 0.5% crystal violet and counted under a microscope. The survival curves were fitted by the linear-quadratic model of the data to evaluate the radiosensitivity of NPC cells [Citation23].
2.7 Cell counting kit-8 (CCK-8)
The cells were seeded in 96-well plates (500 cells/well), cultured for 24 h, and exposed to irradiation with a dose of 6 Gy. The cell proliferation after irradiation was measured using the CCK-8 kit (Genomeditech, Shanghai, China). The absorbance of each well was monitored using a spectrophotometer with a wavelength of 450 nm [Citation23].
2.8 Flow cytometry
The cells were exposed to irradiation with a dose of 6 Gy and collected after 48 h. The cell apoptosis was analyzed using the Annexin apoptosis detection kit (Sigma-Aldrich, St. Louis, MO, USA) according to the provided protocol. Simply put, the 5 × 10⁴ cells were resuspended with the binding buffer. Subsequently, the binding buffer was added with 5 μL Annexin v-fluorescein isothiocyanate (Annexin V-FITC) and 5 μL propidium iodide (PI), and the samples were incubated in the dark for 5 min. The stained cells were analyzed using flow cytometry (Countstar, Shanghai, China) [Citation24].
2.9 Dual-luciferase assay
The 3ʹUTR sequence of lncRNA PTPRG-AS1 and LHX2 were amplified and cloned into pmiR-GLO luciferase vectors (Promega, Madison, WI, USA) to construct wild-type plasmids PTPRG-AS1-WT and LHX2-WT, and the corresponding mutant plasmids PTPRG-AS1-MUT and LHX2-MUT. The CNE2/5-8 F cells were made by QuickChange Site-directed Mutagenesis kit (Agilent Technologies, Santa Clara, CA, USA) and cultured overnight in 12-well plates (5 × 10⁴ cells/well). Then, the CNE2/5-8 F cells were delivered with PTPRG-AS1-WT/LHX2-WT/PTPRG-AS1-MUT/LHX2-MUT and miR-124-3p mimic or its NC (GenePharma, Shanghai, China) using Lipofectamine 2000 (Invitrogen). After 48 h, the cells were rinsed with phosphate buffer saline and lysed. Luciferase activity was measured using dual-luciferase detection kits (Promega) [Citation25].
2.10 Biotinylated RNA pull-down assay
The lysates were treated with RNase-free DNase I (Sigma-Aldrich) and cultured with a mixture of streptavidin-coated magnetic beads (Sigma-Aldrich) and 1 μg biotinylated RNA fragments of miR-223 at 4°C for 3 h. Then, RNA was extracted from harvested RNA-RNA complexes for RT-qPCR analysis [Citation9].
2.11 Western blot (WB)
The cells or NPC tissues and paracancerous tissues were added with the radio-immunoprecipitation assay (RIPA) lysate (Beyotime, Shanghai, China) containing protease inhibitor cocktail (Sigma-Aldrich), mixed well, lysed on the ice for 30 min, and centrifuged at 13,000 rpm for 10 min, and the supernatant was collected. Protein concentration was detected using bicinchoninic acid Protein Assay kits (Pierce, Rockford, IL, USA). After protein isolation using 10% polyacrylamide gel electrophoresis and transferring to the polyvinylidene fluoride (PVDF) membranes, the membranes were sealed with 5% skim milk prepared using Tris-buffered saline-Tween20 (TBST), shaken on a shaker, and sealed for 1 h. Next, the samples were added with primary mouse monoclonal antibody LHX2 (ab243030, 1 µg/mL, Abcam, Shanghai, China), rabbit monoclonal antibody Notch1 (ab52627, 1/1000), mouse monoclonal antibody Snail1 (4–9859-82, 1 µg/mL, Thermo Fisher Scientific, Shanghai, China), and rabbit monoclonal antibody E-cadherin (ab40772, 1/10,000), and cultured at 4°C overnight. After triple rinses with TBST, the samples were incubated with horseradish peroxidase (HRP)-labeled secondary antibody goat anti-mouse IgG (ab205719, 1/5000) or goat anti-rabbit IgG (ab205718, 1/50,000) for 1 h. Finally, the bands were visualized using the enhanced chemiluminescence kit (Pierce) and the protein bands were tested using Image J software (version 1.48, NIH, Bethesda, MD, USA) with GAPDH as an internal reference.
2.12 Statistical analysis
GraphPad Prism 8.01 (GraphPad Software Inc San Diego, CA, USA) and SPSS 21.0 statistical software (IBM Corp. Armonk, NY, USA) were used for data analyses and mapping. The data were in normal distribution and expressed as mean ± standard deviation. Independent t test was utilized for comparisons between 2 groups. One-way analysis of variance (ANOVA) was utilized for comparisons among multi-groups. Tukey’s multiple comparisons test was used for the post hoc test. P value was obtained by a bilateral test. P < 0.05 was indicative of statistical significance.
3. Results
Through differential analysis of NPC-related gene expression chip GSE64634GEO, we found that the differential expression of PTPRG-AS1 was the highest. Further detection showed that PTPRG-AS1 was highly expressed in NPC tissues and NPC cell lines. Bioinformatics, RNA pull-down, and luciferase reporter assays were performed to explore the regulatory relationship of the lncRNA PTPRG-AS1/miR-124-3/LHX2 signaling axis. We further proved that lncRNA PTPRG-AS1/miR-124-3p activated the LHX2-dependent Notch pathway through the ceRNA mechanism, so as to reduce NPC cell radiosensitivity.
3.1 LncRNA PTPRG-AS1 was highly expressed in NPC cells
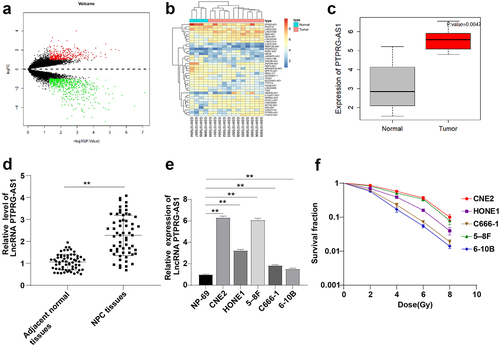
LncRNAs are well-established to play an important role in the radioresistance of NPC cells [Citation7–9]. The DEGs in GSE64634 gene expression microarray in NPC were analyzed and 1033 DEGs were screened (). The 38 differentially expressed lncRNAs were selected to draw the heat map (). Based on the results of differential analysis, PTPRG-AS1 had the highest multiple of differential expression (log2FC = 2.12451703, P value = 0.0047). PTPRG-AS1 was upregulated in NPC (). The expression of PTPRG-AS1 in NPC tissues and paracancerous tissues of 61 NPC patients, and NPC cell lines (CNE2, HONE1, 5–8 F, C666-1, and 6–10B) was tested by RT-qPCR, and the results were the same as that of the microarray analysis that PTPRG-AS1 was upregulated in NPC tissues and cell lines (all P < 0.05) ( -e). To further study the association between PTPRG-AS1 and NPC cell radiosensitivity, the 5 NPC cell lines were treated with irradiation with doses of 0, 2, 4, 6, and 8 Gy, respectively. After 12 d-exposure, cell viability was determined by cloning formation assay. The cell survival rate in the cell lines (C666-1 and 6–10B) with relatively low PTPRG-AS1 expression was lower than that in the cell lines (CNE2 and 5–8 F) with relatively high PTPRG-AS1 expression (all P < 0.05) (). These results suggested that PTPRG-AS1 was related to NPC cell radiosensitivity.
Figure 1. LncRNA PTPRG-AS1 was highly expressed in NPC. (a) Volcano map of differentially expressed genes in NPC-related gene expression microarray GSE64634, with the abscissa representing -log10 (P value), the ordinate representing log2FC, the red dot representing high expression genes, and the green dot representing low expression genes; (b) The heat map of differentially expressed lncRNAs, with the color scale from blue to red indicating that the expression value is from low to high; (c) PTPRG-AS1 was significantly highly expressed in NPC (N = 12) compared with the normal samples (N = 4); (d-e) The expression of PTPRG-AS1 in NPC tissues, paracancerous tissues of 61 NPC patients, and cell lines was detected by RT-qPCR; (f) The radiosensitivity of NPC cell lines was detected by cloning formation assay (stained after 12 d of irradiation with doses of 2–8 Gy, and Linear quadratic model was used to analyze and draw cell dose survival curve). The cell experiments were repeated 3 times, and the data were expressed as mean ± standard deviation. Independent t test was applied for comparisons between two groups in panel D and one-way ANOVA was used for comparisons among multi-groups in panel E and F. Tukey’s multiple comparisons test was used for the post hoc test. ** P < 0.01.
3.2 Knockdown of PTPRG-AS1 promoted radiotherapy-induced apoptosis and enhanced NPC cell radiosensitivity
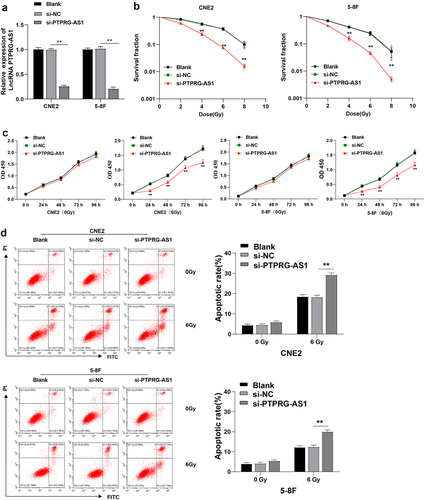
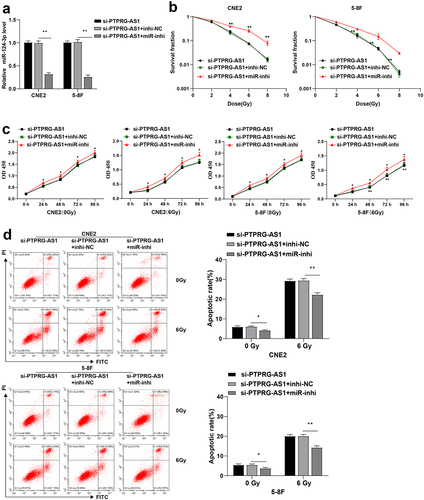
To identify the effect of lncRNA PTPRG-AS1 on NPC cell radiosensitivity, CNE2 and 5–8 F cells with high PTPRG-AS1 expression were transfected with PTPRG-AS1 siRNA (si-PTPRG-AS1 group) to knock down the PTPRG-AS1 expression. RT-qPCR demonstrated that compared with the si-NC group, PTPRG-AS1 in the si-PTPRG-AS1 group was significantly downregulated (all P < 0.01) (), indicating the successful transfection of PTPRG-AS1 siRNA. Subsequently, the radiosensitivity of cells was examined using cloning formation assay. After the knockdown of PTPRG-AS1, the cell survival rate of NPC cells CNE2/5-8 F was significantly decreased (all P < 0.01) (). In addition, the proliferation of NPC cells was detected by the CCK-8 method. The cell proliferation of cells without radiation treatments wasn’t affected by knockdown of PTPRG-AS1, while the proliferation of cells accepted radiation treatments was significantly decreased after knockdown of PTPRG-AS1 (all P < 0.01) (). The major aim of radiotherapy was to induce cancer cell apoptosis; knockdown of PTPRG-AS1 augmented NPC cell radiosensitivity after radiotherapy and repressed proliferation. Therefore, whether PTPRG-AS1 knockdown increased the radiosensitivity by regulating the apoptosis of NPC cells was further studied. Flow cytometry showed no significant difference in the apoptosis rate between the si-PTPRG-AS1 and si-NC groups before radiotherapy, while after radiotherapy, the apoptosis rate in the si-PTPRG-AS1 group was increased (all P < 0.01) (). The results above suggested that knockdown of PTPRG-AS1 could promote radiotherapy-induced apoptosis of NPC cells, thus enhancing the radiosensitivity of NPC cells.
Figure 2. PTPRG-AS1 knockdown promoted radiotherapy-induced apoptosis of NPC cells and enhanced radiosensitivity. PTPRG-AS1 siRNA was transfected into CNE2 and 5–8 F cells to inhibit PTPRG-AS1 expression. (a) The expression of PTPRG-AS1 was detected by RT-qPCR; (b) The radiosensitivity of cells in each group was detected by cloning formation assay (stained after 12 d of irradiation with doses of 2–8 Gy, and Linear quadratic model was used to analyze and draw cell dose survival curve); (c) CCK-8 method was used to measure the proliferation of NPC cells in each group before and after radiotherapy (0/6 Gy); (d) Flow cytometry was used to detect the apoptosis rate of NPC cells in each group before and after radiotherapy (0/6 Gy). The cell experiments were repeated 3 times, and the data were expressed as mean ± standard deviation. One-way ANOVA was used for comparisons among groups. Tukey’s multiple comparisons test was used for the post hoc test. **P < 0.01.
3.3 PTPRG-AS1 targeted miR-124
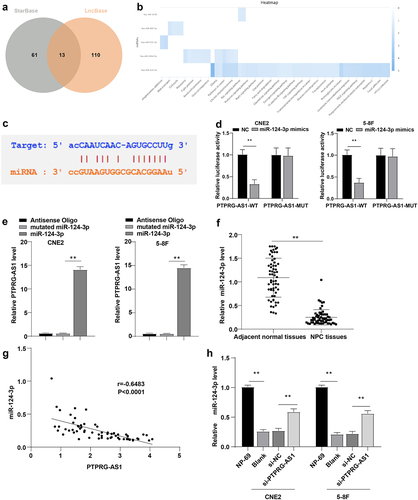
LncRNAs manipulate NPC cell radiosensitivity through the ceRNA mechanism [Citation7,Citation9]. The sub-location of PTPRG-AS1 in the cytoplasm, nucleus, ribosome, cytosol, and exosome was predicted using the LncLocator database (Supplementary Table 1). PTPRG-AS1 was mainly located in the cytoplasm, indicating that it might act as a ceRNA of a miRNA to regulate the radiosensitivity of NPC cells. To further study the downstream regulatory mechanism of PTPRG-AS1, the downstream miRNAs of PTPRG-AS1 were predicted using bioinformatics websites StarBase and LncBase v2.0. The intersection included 13 candidate miRNAs (). The KEGG enrichment of candidate miRNAs was analyzed (). It was found that has-miR-124-3p was involved in the Pathway in cancer, Ras signaling pathway, Prolactin signaling pathway, and many other tumor-related pathways. Moreover, a relevant study has shown that miR-124 can inhibit the stem cell-like characteristics of NPC cells and enhance their radiosensitivity by directly inhibiting JAMA [Citation16]. In addition, StarBase prediction demonstrated binding sites of PTPRG-AS1 and miR-124 (). Dual-luciferase assay manifested that after transfection with miR-124-3p mimic and PTPRG-AS1-WT, the luciferase activity was decreased, while the luciferase activity wasn’t significantly changed after transfection with miR-124-3p mimic and PTPRG-AS1-MUT (all P < 0.01) (). RNA pull-down assay elicited that PTPRG-AS1 was enriched on miR-124-3p (all P < 0.01) (). The expression of miR-124-3p in NPC tissues and paracancerous tissues was detected by RT-qPCR. miR-124-3p expression in NPC tissues was downregulated (, all P < 0.01) and was negatively correlated with PTPRG-AS1 (, p < 0.0001, r = −0.6483). After further knockdown of PTPRG-AS1 in CNE2/5–8 F cells, miR-124-3p was significantly elevated (all P < 0.01) (). Briefly, PTPRG-AS1 targeted miR-124-3p.
Figure 3. PTPRG-AS1 inhibited miR-124-3p in NPC cells. (a) The downstream miRNAs of PTPRG-AS1 were predicted using the StarBase and LncBase v2.0, and the Venn graph of the intersections was obtained; (b) KEGG enrichment analysis of miRNAs; (c) The binding sites of PTPRG-AS1 and miR-124 were predicted using the StarBase; (d) Dual-luciferase assay and (e) RNA pull-down assay were used to verify the interaction between PTPRG-AS1 and miR-124; (f) The expression of miR-124-3p in NPC tissues and paracancerous tissues was detected by RT-qPCR; (g) The correlation between miR-124-3p and PTPRG-AS1 in NPC tissues of 61 NPC patients was analyzed by Pearson correlation analysis; (h) The expression of miR-124-3p in CNE2/5–8 F cells was assessed by RT-qPCR. The experiments were repeated 3 times, and the data were expressed as mean ± standard deviation. Independent t test was used for comparisons between 2 groups in panel D, and one-way ANOVA was used for comparisons among multi-groups in panels E/H. Tukey’s multiple comparisons test was used for the post hoc test. Independent t test was adopted for comparisons between two groups in panel F. **P < 0.01.
3.4 Inhibition of miR-124-3p partially reversed PTPRG-AS1 knockdown-induced radiosensitivity of NPC cells
To further verify whether PTPRG-AS1 affected radiosensitivity of NPC cells through miR-124-3p, PTPRG-AS1 was knocked down and miR-124-3p was inhibited in CNE2 and 5–8 F cells through cell transfection. RT-qPCR elicited that compared with the si-PTPRG-AS1 + inhi-NC group, the expression of miR-124-3p in the cells of the si-PTPRG-AS1 + miR-inhi group was downregulated (all P < 0.01) (), indicating the successful cell transfection. The radiosensitivity, proliferation, and apoptosis rate of CNE2/5-8 F cells in each group were further determined. Compared with the si-PTPRG-AS1 + inhi-NC group, cell survival was increased in the si-PTPRG-AS1 + miR-inhi group (all P < 0.01) (), cell proliferation was promoted (all P < 0.01) (), and the apoptosis rate was significantly decreased (all P < 0.01) () in CNE2/5-8 F cells. The preceding results suggested that inhibition of miR-124-3p partially reversed PTPRG-AS1 knockdown-induced radiosensitivity of NPC cells.
Figure 4. Inhibition of miR-124-3p partially reversed PTPRG-AS1 knockdown-induced radiosensitivity of NPC cells. PTPRG-AS1 was knocked down and miR-124-3p was inhibited in CNE2 and 5–8 F cells. (a) The expression of miR-124-3p was detected by RT-qPCR; (b) The radiosensitivity of cells in each group was detected by cloning formation assay (stained after 12 d of irradiation with doses of 2–8 Gy, and Linear quadratic model was used to analyze and draw cell dose survival curve); (c) CCK-8 method was used to measure the proliferation of NPC cells in each group before and after radiotherapy (0/6 Gy); (d) Flow cytometry was used to detect the apoptosis rate of NPC cells in each group before and after radiotherapy (0/6 Gy). The experiments were repeated 3 times, and the data were expressed as mean ± standard deviation. One-way ANOVA was used for comparisons among groups. Tukey’s multiple comparisons test was used for the post hoc test. *P < 0.05, **P < 0.01.
3.5 miR-124-3p inhibited LHX2 in NPC cells
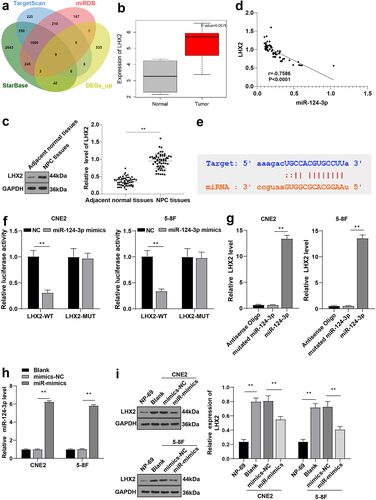
We have shown that PTPRG-AS1 can regulate the radiosensitivity of NPC cells through miR-124-3p. To further explore the downstream target gene of miR-124-3p, StarBase, TargetScan, and miRDB were used for prediction. The 9 candidate target genes were obtained from the intersection of the above results and differentially expressed genes (DEGs) (BTBD10, COL4A1, SLBP, FOXQ1, HIVEP1, PUS7, SLCO5A1, LHX2, and PHKA1) (). The silencing of LHX2 inhibits the proliferation, migration, invasion, and tumorigenicity of NPC cells [Citation18]. Differential analysis prediction and WB results demonstrated that LHX2 was upregulated in NPC ( -C, P < 0.01). Pearson correlation analysis manifested that LHX2 was negatively correlated with miR-124-3p (, p < 0.0001, r = −0.7586). The binding sites between miR-124-3p and LHX2 were obtained using the StarBase (). Dual-luciferase assay manifested that after transfection with miR-124-3p mimic and LHX2-WT, luciferase activity was decreased, while the luciferase activity wasn’t significantly changed after transfection with miR-124-3p mimic and LHX2-MUT (all P < 0.01) (). RNA pull-down assay demonstrated that LHX2 was enriched on miR-124-3p (all P < 0.01) (). miR-124-3p was overexpressed in the CNE2/5-8 F cells by cell transfection (P < 0.01) (). The LHX2 expression in CNE2/5–8 F cells of each group was detected by WB. Compared with NP-69, LHX2 was upregulated in NPC cells and downregulated after overexpressing miR-124-3p in CNE2/5–8 F cells (all P < 0.01) (). These results suggested that miR-124-3p inhibited LHX2 in NPC cells.
Figure 5. miR-124-3p targeted LHX2. (a) The downstream genes of miR-124-3p were predicted using StarBase, TargetScan and miRDB, and the Venn graph of the intersection with DEGs_up was obtained; (b) The expression of LHX2 in NPC (N = 12) was significantly highly expressed compared with the normal samples (N = 4); (c) The LHX2 level in NPC tissues and paracancerous tissues of 61 NPC patients was detected by WB; (d) The correlation between LHX2 and miR-124-3p in NPC tissues of 61 NPC patients was analyzed by Pearson correlation analysis; (e) The binding sites between miR-124-3p and LHX2 were predicted using the StarBase; (f) Dual-luciferase assay and (g) RNA pull-down assay were used to verify the interaction between miR-124-3p and LHX2; (h) The expression of miR-124-3p was detected using RT-qPCR; (i) The expression of LHX2 in CNE2/5–8 F cells of each group was detected by WB. The experiments were repeated 3 times, and the data were expressed as mean ± standard deviation. Independent t test was used for comparisons between 2 groups in panel C/F, and one-way ANOVA was used for comparisons among multi-groups in panels G/H/I. Tukey’s multiple comparisons test was used for the post hoc test. **P < 0.01.
3.6 Overexpression of LHX2 attenuated the radiosensitivity of NPC cells induced by overexpression of miR-124-3p
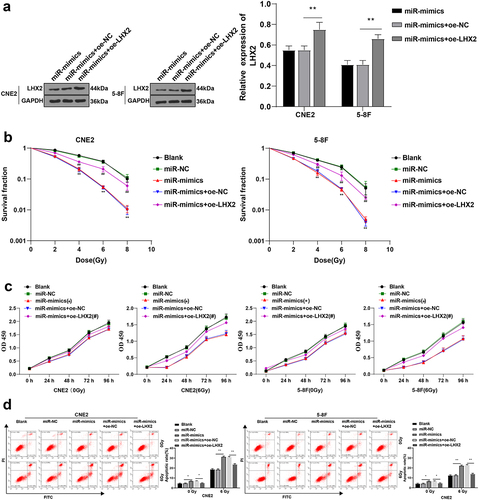
To further explore whether miR-124-3p could affect NPC cell radiosensitivity through LHX2, miR-124-3p and LHX2 were both overexpressed in CNE2 and 5–8 F cells by cell transfection. WB showed that compared with the miR-mimic + oe-NC group, LHX2 was significantly upregulated in cells of the miR-mimic + oe-LHX2 group (all P < 0.01) (), indicating that the cell transfection was successful. The apoptosis rate, radiosensitivity, and proliferation of CNE2/5-8 F cells in different groups were further determined. The proliferation of CNE2/5-8 F was significantly increased (all P < 0.01) ( -c), and the apoptosis rate of CNE2/5-8 F cells was reduced (all P < 0.01) () after overexpressing LHX2. These results suggested that LHX2 overexpression attenuated NPC cell radiosensitivity induced by miR-124-3p overexpression.
Figure 6. Overexpression of LHX2 attenuated the radiosensitivity of NPC cells induced by overexpression of miR-124-3p. miR-124-3p was overexpressed and LHX2 was overexpressed in CNE2 and 5–8 F cells. (a) The expression of LHX2 was detected by WB; (b) The radiosensitivity of cells in each group was detected by cloning formation assay (stained after 12 d of irradiation with doses of 2–8 Gy, and Linear quadratic model was used to analyze and draw cell dose survival curve); (c) CCK-8 method was used to measure the proliferation of NPC cells in each group before and after radiotherapy (0/6 Gy); (d) Flow cytometry was used to detect the apoptosis rate of NPC cells in each group before and after radiotherapy (0/6 Gy). The experiments were repeated 3 times, and the data were expressed as mean ± standard deviation. One-way ANOVA was used for comparisons among groups. Tukey’s multiple comparisons test was used for the post hoc test. In panels A/E, *P < 0.05, **P < 0.01. In panels C/D, *compared with the blank group, P < 0.01, #compared with the blank group, P < 0.05, ##compared with the blank group, P < 0.01.
3.7 LHX2 attenuated radiosensitivity of NPC cells by activating the Notch pathway
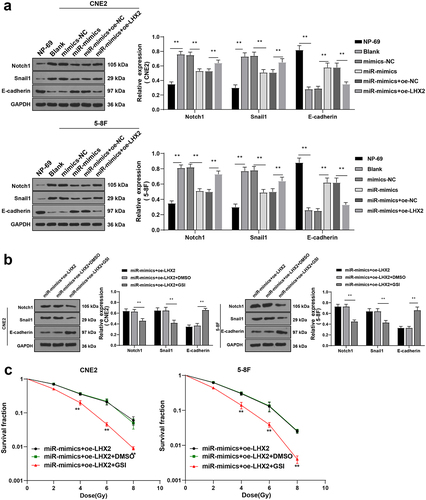
Existing evidence indicates that LHX2 can directly regulate the gene expressions of the Notch pathway, such as Notch1, Dll1, and Dll3, and the conditional knockdown of LHX2 leads to the rapid downregulation of the Notch pathway genes and loss of Notch signal [Citation26]. Inhibition of the Notch pathway has been previously highlighted to enhance cell radiosensitivity of breast cancer and cervical cancer cells [Citation27,Citation28]. To further explore whether LHX2 affected NPC cell radiosensitivity through the Notch pathway, the levels of the Notch pathway-related proteins Notch1, Snail1, and E-cadherin were detected by WB. Compared with NP-69 cells, in the NPC cells, Notch1 and Snail1 levels were upregulated, and E-cadherin was significantly downregulated; overexpression of miR-124-3p diminished the Notch1 and Snail1 levels and elevated E-cadherin expression; further overexpression of LHX2 significantly elevated the Notch1 and Snail1 and reduced E-cadherin levels (all P < 0.01) (). Furthermore, the Notch pathway inhibitor was added to inhibit the Notch1 and Snail1 in cells of the miR-mimic + oe-LHX2 group (all P < 0.01) (). Cell radiosensitivity was tested by cloning formation assay. It turned out that inhibition of the Notch pathway enhanced NPC cell radiosensitivity (all P < 0.01) (). All in all, the aforementioned findings indicated that LHX2 attenuated the radiosensitivity of NPC cells by activating the Notch pathway.
Figure 7. LHX2 attenuated radiosensitivity of NPC cells through activating the Notch pathway. (a) The expressions of the Notch pathway-related proteins Notch1, Snail1 and E-cadherin were detected by WB; Then, the Notch pathway inhibitor was added and (b) the expressions of the Notch pathway-related proteins Notch1, Snail1 and E-cadherin were detected by WB; (c) The radiosensitivity of cells in each group was detected by cloning formation assay (stained after 12 d of irradiation with doses of 2–8 Gy, and Linear quadratic model was used to analyze and draw cell dose survival curve). The experiments were repeated 3 times, and the data were expressed as mean ± standard deviation. One-way ANOVA was used for comparisons among groups. Tukey’s multiple comparisons test was used for the post hoc test. **P < 0.01.
3.7.1 PTPRG-AS1 activated the Notch pathway in NPC cells
In our previous study, we found that PTPRG-AS1 upregulated LHX2 as a ceRNA of miR-124-3p in NPC cells, and LHX2 reduced the radiosensitivity of NPC cells by activating the Notch pathway. To verify whether PTPRG-AS1 could reduce the radiosensitivity of NPC cells by activating the Notch pathway, the levels of the Notch pathway-related proteins Notch1, Snail1, and E-cadherin in CNE2 and 5–8 F cells with silenced PTPRG-AS1 were detected by WB. After the knockdown of PTPRG-AS1, the levels of Notch1 and Snail1 in NPC cells were decreased and the expression of E-cadherin was increased (P < 0.01) (). In conclusion, PTPRG-AS1 activated the Notch pathway in NPC cells.
Figure 8. PTPRG-AS1 activated the Notch pathway in NPC cells. PTPRG-AS1 was knocked down in CNE2 and 5–8 F cells and the levels of the Notch pathway-related proteins Notch1, Snail1, and E-cadherin were assessed by WB. The experiments were repeated 3 times, and the data were expressed as mean ± standard deviation. One-way ANOVA was used for comparisons among groups. Tukey’s multiple comparisons test was used for the post hoc test. **P < 0.01.
4. Discussion
NPC is relatively less prevalent compared with other cancers and its incidence has gradually declined all over the world over the past decades [Citation1]. A previous study has revealed the vital role of lncRNA PTPRG-AS1 in NPC cell radiosensitivity [Citation14]. Our study illustrated that lncRNA PTPRG-AS1 enhanced NPC cell radiosensitivity by regulating the miR-124-3p/LHX2 axis through the ceRNA mechanism.
The hard-done work of our peers has indicated the participation of lncRNAs in regulating radiosensitivity in NPC cells [Citation8]. Herein, we analyzed the DEGs in the NPC-related microarray GSE64634 and focused on PTPRG-AS1. PTPRG-AS1 has been reported to reduce the radiosensitivity of lung cancer cells [Citation12]. Our results demonstrated the PTPRG-AS1 upregulation in NPC. The cell survival rate in cells with low PTPRG-AS1 expression was lower than that of cells with high PTPRG-AS1 expression. This result tied well with previous studies wherein PTPRG-AS1 is upregulated in NPC cells and regulates metastasis and radiosensitivity of NPC cells [Citation14]. Collectively, PTPRG-AS1 might be associated with NPC cell radiosensitivity. To further study the effect of PTPRG-AS1 on NPC cell radiosensitivity, we knocked down PTPRG-AS1 in CNE2 and 5–8 F cells with high expression of PTPRG-AS1. Our results found that after PTPRG-AS1 knockdown, NPC cell survival rate was decreased, cell proliferation of cells without radiation treatment was not affected, and the proliferation of cells accepted radiation treatment was decreased; and the apoptosis rate was increased after radiotherapy. The results were broadly in line with a similar study that highlighted that PTPRG-AS1 knockdown can enhance NSCLC cell radiosensitivity [Citation12]. These findings made it plausible to conclude that PTPRG-AS1 knockdown promoted radiotherapy-induced apoptosis of NPC cells, and enhanced radiosensitivity of NPC cells.
Through much-valuable literature review, we learned that lncRNAs regulate NPC cell radiosensitivity through the ceRNA mechanism [Citation7,Citation9]. For example, knockdown of lncRNA-LUADT1 can inhibit the proliferation and invasion of NPC cells, which may be achieved by regulating the expression of miR-1207-5p and TEAD1, so as to inhibit the activation of the Hippo/YAP pathway [Citation29]. LncRNA 02570 is upregulated in clinically advanced NPC patients and upregulates SREBP1 and FASN proteins by adsorbing miR-4649-3p to promote the progression of NPC [Citation30]. In addition, miRNAs are involved in the regulation of NPC cell radiosensitivity. For example, miR-195-3p improves the radiosensitivity of NPC cells by targeting and regulating CDK1 [Citation31]. We predicted the sub-location of PTPRG-AS1 using the LncLocator database and found PTPRG-AS1 was mainly located in the cytoplasm, indicating that PTPRG-AS1 might regulate NPC cell radiosensitivity through the ceRNA mechanism. Then, we predicted the downstream miRNAs of PTPRG-AS1 and focused on has-miR-124-3p. The binding relationship between PTPRG-AS1 and miR-124 was verified. Additionally, miR-124-3p was inhibited in NPC cells but upregulated after PTPRG-AS1 knockdown. In accordance, miR-124-3p in NPC was downregulated in comparison to the postnasal catarrh tissues [Citation32]. In brief, PTPRG-AS1 targeted miR-124-3p. To ascertain whether PTPRG-AS1 regulated NPC cell radiosensitivity through miR-124-3p, we knocked down PTPRG-AS1 and inhibited miR-124-3p together in NPC cells. Our results noted that after miR-124-3p inhibition, the radiosensitivity was decreased, cell proliferation was enhanced and the apoptosis rate was significantly decreased in NPC cells. It is noteworthy that miR-124 inhibits the stem-like properties and enhances the radiosensitivity in NPC cells [Citation16]. Briefly, miR-124-3p inhibition partially reversed PTPRG-AS1 knockdown-induced radiosensitivity of NPC cells.
Then, we focused our efforts on the downstream target genes of miR-124-3p and concentrated on LHX2. Our results verified that LHX2 was upregulated in NPC and miR-124-3p targeted LHX2. Furthermore, to identify whether miR-124-3p regulated NPC cell radiosensitivity through LHX2, we overexpressed miR-124-3p and LHX2. Our results discovered that miR-124-3p overexpression decreased proliferation and increased apoptosis rate and NPC cell radiosensitivity, while the apoptosis rate and radiosensitivity were decreased and proliferation was promoted after overexpressing LHX2. In accordance with our findings, a prior study illustrated that miR-506 inhibits tumor growth and metastasis in NPC cells by downregulating LHX2 [Citation18]. In conclusion, the abovementioned findings demonstrated that LHX2 overexpression attenuated NPC cell radiosensitivity induced by miR-124-3p overexpression.
Prior evidence suggests that inhibition of the Notch pathway prevents the growth and metastasis of NPC cells [Citation33]. Our results showed that in NPC cells, Notch1 and Snail1 levels were upregulated, and E-cadherin level was significantly downregulated; miR-124-3p overexpression significantly downregulated Notch1 and Snail1 levels, while LHX2 overexpression upregulated Notch1 and Snail1 levels. Furthermore, we inhibited Notch1 and Snail1 expressions in cells in the miR-mimic + oe-LHX2 group by adding the Notch pathway inhibitor. Inhibition of the Notch pathway significantly enhanced the radiosensitivity of NPC cells. Much in accordance with our findings, conditional LHX2 knockdown causes loss of Notch signaling and a rapid decrease of the genes in the Notch pathway [Citation26]. Collectively, our findings revealed that LHX2 overexpression attenuated the radiosensitivity of NPC cells by activating the Notch pathway.
5. Conclusions
To sum up, the current study supported that lncRNA PTPRG-AS1/miR-124-3p regulated the LHX2-dependent Notch pathway through the ceRNA mechanism, thus enhancing NPC cell radiosensitivity, so as to provide a new reference for clinical treatment of NPC. However, only two NPC cell lines were selected and animal and clinical experiments were not performed in this study. Currently, many studies have investigated the mechanisms of radioresistance, such as DNA damage, tumor stem cells, and autophagy [Citation34–36]. In future studies, we shall strive to explore whether lncRNA PTPRG-AS1 can affect the radiosensitivity of NPC cells via DNA damage or stem cell differentiation and dig out other possible lncRNAs that affect NPC cell radiosensitivity, and other miRNAs and pathways that lncRNA PTPRG-AS1 may regulate.
Ethics approval
The study was approved by the Academic Ethics Committee of The Second People’s Hospital of Lianyungang City, and all the subjects involved were fully informed of the objective of the study and signed informed consent before sampling.
Availability of data and materials
All the data generated or analyzed during this study are included in this published article.
Authors’ contributions
ZQS contributed to the study concepts, study design, and guarantor of integrity of the entire study; YW contributed to the literature research; ZQS, YW contributed to the experimental studies and data acquisition; ZQS, YW contributed to the manuscript preparation and GJH contributed to the manuscript editing and review. All authors read and approved the final manuscript.
Supplemental Material
Download MS Word (13 KB)Disclosure statement
No potential conflict of interest was reported by the author(s).
Supplementary material
Supplemental data for this article can be accessed here
Additional information
Funding
References
- Chen YP, Chan ATC, Le QT, et al. Nasopharyngeal carcinoma. Lancet. 2019;394(10192):64–80.
- Sun XS, Li XY, Chen QY, et al. Future of radiotherapy in nasopharyngeal carcinoma. Br J Radiol. 2019;92(1102):20190209.
- Blanchard P, Lee A, Marguet S, et al. Chemotherapy and radiotherapy in nasopharyngeal carcinoma: an update of the MAC-NPC meta-analysis. Lancet Oncol. 2015;16(6):645–655.
- Chen L, Hu CS, Chen XZ, et al. Concurrent chemoradiotherapy plus adjuvant chemotherapy versus concurrent chemoradiotherapy alone in patients with locoregionally advanced nasopharyngeal carcinoma: a phase 3 multicentre randomised controlled trial. Lancet Oncol. 2012;13(2):163–171.
- Kim BM, Hong Y, Lee S, et al. Therapeutic implications for overcoming radiation resistance in cancer therapy. Int J Mol Sci. 2015;16(11):26880–26913.
- Prawira A, Oosting SF, Chen TW, et al. Systemic therapies for recurrent or metastatic nasopharyngeal carcinoma: a systematic review. Br J Cancer. 2017;117(12):1743–1752.
- Hu X, Jiang H, Jiang X. Downregulation of lncRNA ANRIL inhibits proliferation, induces apoptosis, and enhances radiosensitivity in nasopharyngeal carcinoma cells through regulating miR-125a. Cancer Biol Ther. 2017;18(5):331–338.
- Li G, Liu Y, Liu C, et al. Genome-wide analyses of long noncoding RNA expression profiles correlated with radioresistance in nasopharyngeal carcinoma via next-generation deep sequencing. BMC Cancer. 2016;16(1):719.
- Zhong Q, Chen Y, Chen Z. LncRNA MINCR regulates irradiation resistance in nasopharyngeal carcinoma cells via the microRNA-223/ZEB1 axis. Cell Cycle. 2020;19(1):53–66.
- Shi J, Xu X, Zhang D, et al. Long non-coding RNA PTPRG-AS1 promotes cell tumorigenicity in epithelial ovarian cancer by decoying microRNA-545-3p and consequently enhancing HDAC4 expression. J Ovarian Res. 2020;13(1):127.
- Binang HB, Wang YS, Tewara MA, et al. Expression levels and associations of five long non-coding RNAs in gastric cancer and their clinical significance. Oncol Lett. 2020;19(3):2431–2445.
- Ma Q, Niu R, Huang W, et al. Long noncoding RNA PTPRG Antisense RNA 1 reduces radiosensitivity of nonsmall cell lung cancer cells via regulating MiR-200c-3p/TCF4. Technol Cancer Res Treat. 2020;19:1533033820942615.
- Ren XY, Yang WB, Tian Y. Overexpression of long noncoding RNA PTPRG-AS1 is associated with poor prognosis in epithelial ovarian cancer. Rev Assoc Med Bras (1992). 2020;66(7):948–953.
- Yi L, Ouyang L, Wang S, et al. Long noncoding RNA PTPRG-AS1 acts as a microRNA-194-3p sponge to regulate radiosensitivity and metastasis of nasopharyngeal carcinoma cells via PRC1. J Cell Physiol. 2019;234(10):19088–19102.
- Yamamura S, Imai-Sumida M, Tanaka Y, et al. Interaction and cross-talk between non-coding RNAs. Cell Mol Life Sci. 2018;75(3):467–484.
- Tian Y, Tian Y, Tu Y, et al. microRNA-124 inhibits stem-like properties and enhances radiosensitivity in nasopharyngeal carcinoma cells via direct repression of expression of JAMA. J Cell Mol Med. 2020;24(17):9533–9544.
- Song H, Liu J, Wu X, et al. LHX2 promotes malignancy and inhibits autophagy via mTOR in osteosarcoma and is negatively regulated by miR-129-5p. Aging (Albany NY). 2019;11(21):9794–9810.
- Liang TS, Zheng YJ, Wang J, et al. MicroRNA-506 inhibits tumor growth and metastasis in nasopharyngeal carcinoma through the inactivation of the Wnt/beta-catenin signaling pathway by down-regulating LHX2. J Exp Clin Cancer Res. 2019;38(1):97.
- Yang Q, Wan L, Xiao C, et al. Inhibition of LHX2 by miR-124 suppresses cellular migration and invasion in non-small cell lung cancer. Oncol Lett. 2017;14(3):3429–3436.
- Cao Z, Pan X, Yang Y, et al. The lncLocator: a subcellular localization predictor for long non-coding RNAs based on a stacked ensemble classifier. Bioinformatics. 2018;34(13):2185–2194.
- Wu Q, Han T, Sheng X, et al. Downregulation of EB virus miR-BART4 inhibits proliferation and aggressiveness while promoting radiosensitivity of nasopharyngeal carcinoma. Biomed Pharmacother. 2018;108:741–751.
- Ge R, Yang P, Wen B. Upregulation of long-noncoding RNA PTPRG-AS1 can predict the poor prognosis and promote migration and invasion in patients with osteosarcoma. Oncol Lett. 2021;21(6):464.
- He Y, Jing Y, Wei F, et al. Long non-coding RNA PVT1 predicts poor prognosis and induces radioresistance by regulating DNA repair and cell apoptosis in nasopharyngeal carcinoma. Cell Death Dis. 2018;9(2):235.
- Han Y, Li F, Xie J, et al. PVT1 mediates cell proliferation, apoptosis and radioresistance in nasopharyngeal carcinoma through regulating miR-515-5p/PIK3CA axis. Cancer Manag Res. 2020;12:10077–10090.
- Qin AC, Qian Y, Ma YY, et al. Long Non-coding RNA RP11-395G23.3 acts as a competing endogenous RNA of miR-124-3p to Regulate ROR1 in anaplastic thyroid carcinoma. Front Genet. 2021;12:673242.
- de Melo J, Zibetti C, Clark BS, et al. Lhx2 is an essential factor for retinal gliogenesis and notch signaling. J Neurosci. 2016;36(8):2391–2405.
- Peng JH, Wang XL, Ran L, et al. Retracted: inhibition of Notch signaling pathway enhanced the radiosensitivity of breast cancer cells. J Cell Biochem. 2018;119(10):8398–8409.
- Prabakaran DS, Muthusami S, Sivaraman T, et al. Silencing of FTS increases radiosensitivity by blocking radiation-induced Notch1 activation and spheroid formation in cervical cancer cells. Int J Biol Macromol. 2019;126:1318–1325.
- Jiang N, Zhao L, Zong D, et al. Long non-coding RNA LUADT1 promotes nasopharyngeal carcinoma cell proliferation and invasion by downregulating miR-1207-5p. Bioengineered. 2021;12(2):10716–10728.
- Liu F, Wei J, Hao Y, et al. Long intergenic non-protein coding RNA 02570 promotes nasopharyngeal carcinoma progression by adsorbing microRNA miR-4649-3p thereby upregulating both sterol regulatory element binding protein 1, and fatty acid synthase. Bioengineered. 2021;12(1):7119–7130.
- Xie F, Xiao W, Tian Y, et al. MicroRNA-195-3p inhibits cyclin dependent kinase 1 to induce radiosensitivity in nasopharyngeal carcinoma. Bioengineered. 2021;12(1):7325–7334.
- Xu S, Zhao N, Hui L, et al. MicroRNA-124-3p inhibits the growth and metastasis of nasopharyngeal carcinoma cells by targeting STAT3. Oncol Rep. 2016;35(3):1385–1394.
- Guo H, Wang F, Diao Y, et al. Knockdown of Notch1 inhibits nasopharyngeal carcinoma cell growth and metastasis via downregulation of CCL2, CXCL16, and uPA. Mol Carcinog. 2019;58(10):1886–1896.
- Di M, Wang M, Miao J, et al. CHAF1B induces radioresistance by promoting DNA damage repair in nasopharyngeal carcinoma. Biomed Pharmacother. 2020;123:109748.
- Suzuki M, Anko M, Ohara M, et al. Radiation-induced autophagy in human pancreatic cancer cells is critically dependent on G2 checkpoint activation: a mechanism of radioresistance in pancreatic cancer. Int J Radiat Oncol Biol Phys. 2021;111(1):260–271.
- Tsao T, Beretov J, Ni J, et al. Cancer stem cells in prostate cancer radioresistance. Cancer Lett. 2019;465:94–104.