
ABSTRACT
Lung cancer is a significant global burden. Aminoacyl-tRNA synthetases (aaRSs) can be reliably identified by the occurrence and improvement of tumors. Threonyl-tRNA synthetase (TARS) and mitochondrial threonyl-tRNA synthetase 2 (TARS2) are both aaRSs. Many studies have shown that TARS are involved in tumor angiogenesis and metastasis. However, TARS2 has not yet been reported in tumors. This study explored the role of TARS2 in the proliferation and apoptosis of lung adenocarcinoma (LUAD). TARS2 expression in lung adenocarcinoma and non-cancerous lung tissues was detected via immunohistochemistry. Cell proliferation was detected using MTS, clone formation, and EdU staining assays. Flow cytometry was used to detect cell cycle, mitochondria reactive oxygen species (mROS) production, and apoptosis. Mitochondrial membrane potential (MMP ΔΨm) was detected using JC-1 fluorescent probes. Cell cycle, apoptosis-related pathway, and mitochondrial DNA (mtDNA) -encoded protein expression was detected via Western blotting. Finally, the effect of TARS2 on tumor growth was examined using a xenotransplanted tumor model in nude mice. We found that TARS2 was highly expressed in lung adenocarcinoma tissues and associated with poor overall survival (OS). Mechanistic analysis showed that knockdown of TARS2 inhibited proliferation through the retinoblastoma protein (RB) pathway and promoted mROS-induced apoptosis. Knockdown of TARS2 inhibits tumor growth in a xenotransplanted tumor model. TARS2 plays an important role in LUAD cell proliferation and apoptosis and may be a new therapeutic target.
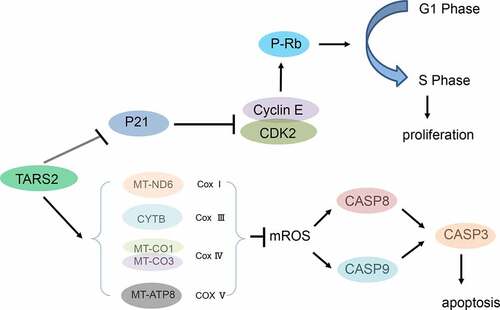
Graphical abstract
1. Introduction
Lung cancer is a huge burden worldwide and is responsible for the most cancer-related deaths; lung adenocarcinoma (LUAD) is the main pathological type [Citation1–5]. Although the mortality rate of LUAD has decreased, the overall survival of patients remains satisfactory [Citation1]. Therefore, clarifying the mechanism of the malignant biological behavior of LUAD and discovering its key signaling targets is of great value.
Tumorigenesis involves abnormal gene expression [Citation6,Citation7]. Many proto-oncogenes maintain normal life processes in the body; however, cancer is often induced if they are abnormally activated [Citation8–11]. The classic function of aminoacyl-tRNA synthetases (aaRSs) is to conjugate amino acids to tRNAs [Citation12]. However, aaRSs are also involved in RNA synthesis, inflammation, apoptosis, and so on [Citation13]. Many studies have linked aaRS function with cancer [Citation14].
TARS and TARS2 are aaRS members that encode cytoplasmic and mitochondrial threonyl-tRNA synthetases, respectively [Citation15]. TARS is abnormally expressed in many types of tumors and is associated with tumor angiogenic markers, metastasis, and poor patient prognosis [Citation16,Citation17]. However, the function of TARS2 in cancer has not been reported. Current research shows that P282L mutation of TARS2 causes mitochondrial encephalomyopathies in humans [Citation18,Citation19]. Mitochondrial DNA (mtDNA) mutations or loss is characteristic of mitochondrial encephalomyopathies [Citation20].
We speculated that TARS2 acts as an oncogene in lung adenocarcinoma, promotes cell proliferation, and reduces apoptosis. Our work aims to reveal the role and possible mechanism of TARS2 in the proliferation and apoptosis of lung adenocarcinoma.
2. Methods and methods
2.1. Clinical samples
This study included archival formalin-fixed paraffin-embedded specimens from 152 patients (90 women and 62 men) with primary LUAD who received surgical treatment at the Third Affiliated Hospital of Kunming Medical University from 2009 to 2015 and fresh tissue samples from five patients (3 women and 2 men) with primary LUAD who received surgical treatment at the First Affiliated Hospital of Kunming Medical University between 2019 and 2020. Their ages ranged from 28 to 79 years. No patients underwent any other treatment. All patients were free from infectious diseases. The samples were tumor tissue and distally paired normal tissue obtained intraoperatively from patients with LUAD. Written informed consent was obtained from all patients. The Ethics Committee of Kunming Medical University approved the study protocol. The clinical procedures were performed in accordance with the Declaration of Helsinki [Citation21].
2.2. Immunohistochemistry (IHC)
Patient and xenograft tumor tissue samples were fixed with formaldehyde (4%) for 24 h. These samples were then embedded in paraffin and cut into 4 μm sections. The 4 μm paraffin tissue sections were toasted at 70°C for 2 h; the xylene was dewaxed, and the gradient alcohol was hydrated. Citrate solution (pH 6.0) was used to repair the antigen. Endogenous peroxidase was blocked with hydrogen peroxide (0.3%), and nonspecific antigens were blocked with sheep serum (2.5%). Sections were incubated with primary antibodies at 28°C for 80 min. The sections were stained with solution A in DAB chromogenic solution, hematoxylin was used to stain the nuclei, and neutral gum was used to seal the sections. The TARS2 protein was stained brown and the nuclei were stained blue. The TARS2 score was defined as the intensity score (no-stain: 0, light-yellow: 1, brown-yellow: 2, brown: 3) multiplied by the percentage area stained (less than 10%: 1, 10–49%: 2, 50–74%: 3, 75–100%: 4). A score of > 4 was considered positive [Citation22].
2.3. Cell culture
A549 and PC-9 cells were purchased from Shanghai Cell Bank. A549 cells were cultured in DMEM F12 (with 10% fetal bovine serum), and PC-9 was cultured in RPMI 1640 (with 10% fetal bovine serum) medium. All media were supplemented with 100 μM penicillin and streptomycin [Citation23].
2.4. Cell infection
PC-9 and A549 cells were seeded in 6-well plates (20 × 104 cells per well). Lentiviral vectors were transfected into LUAD cells, where the MOI of PC-9 cells was 20 and the MOI of A549 cells was 10. The cells were collected 120 h after transfection for subsequent experiments. Viral vectors were designed by Shanghai Genechem Co., Ltd., including shTARS2-1 (5′-GGAGTGAGCAAGAGGAATA-3′), shTARS2-2 (5′-GATTTGACCTCCAGTATAA-3′) and scramble control(5′-TTCTCCGAACGTGTCACGT-3′) [Citation23].
2.5. Western blotting
Fresh tissue and cell samples were lysed using RIPA buffer on ice. A 10% sodium dodecyl sulfate-polyacrylamide gel electrophoresis gel was used to separate the protein samples. The following antibodies were used in this study: TARS2 (15,067-1-AP, Proteintech, China); GAPDH (60,004-1-Ig, Proteintech, China); Phospho-RB (ser807/811) (9917, Cell Signaling Technology); Cyclin E1(20,808, Cell Signaling Technology); Cyclin E2 (4132, Cell Signaling Technology); CDK2 (18,048, Cell Signaling Technology); p21 Waf1/Cip1 (9932, Cell Signaling Technology); MT-ND6 (A17991, ABclonal, China); CYTB (55,090-1-AP, Proteintech, China); MT-CO1(62,101; Cell Signaling Technology); MT-CO3 (55,082-1-AP, Proteintech, China); MT-ATP8 (26,723-1-AP, Proteintech, China); TOM20 (11,802-1-AP, Proteintech, China); cleaved caspase-3 and cleaved caspase-8 (92,570, Cell Signaling Technology); cleaved caspase-9 (9930, Cell Signaling Technology) [Citation24].
2.6. MTS assay
Scramble-, shTARS2-1, and shTARS2-2 transfected cells were inoculated into 96-well plates (1000 cells per well for A549 and 2000 cells per well for PC-9) with 200 μL of standard medium per well. Subsequently, 40 μL of MTS (G111A, Promega, Wisconsin, USA) was added to each well at 0 d, 1 d, 2 d, 3 d, 4 d, and 5 d and incubated in the dark for 120 min. Absorbance was measured at 490 nm [Citation25].
2.7. Clone formation experiment
Scramble-, shTARS2-1-, and shTARS2-2-transfected cells were vaccinated in 6-well plates (200 cells/well). The transfected cells were cultured at 37°C for 14 days, and then fixed in paraformaldehyde for 30 min and stained with Giemsa (32,884; Sigma, Missouri, USA) for 10 min. Colonies were counted macroscopically [Citation23].
2.8. EdU staining assay
Scramble-, shTARS2-1-, and shTARS2-2-transfected cells were seeded in 6-well plates (2 × 10⁵ cells/well) and stained with the EdU kit (Ribbio, China), and EdU-positive cells were counted under a fluorescent microscope (Nikon, Japan) [Citation26].
2.9. mROS assay by flow cytometry
Scramble-, shTARS2-1-, and shTARS2-2-transfected cells were seeded in 6-well plates (2 × 10⁵ cells/well) and then cultured with MitoROS™ 580 (16,052, AAT Bioquest Inc., USA) for 30 min. mROS production was detected via flow cytometry (Ex/Em = 510/580) [Citation27].
2.10. MMP detection
Scramble-, shTARS2-1-, and shTARS2-2-transfected cells were seeded in 6-well plates (2 × 10⁵ cells/well) and cultured with 1 mL JC-1 staining working solution (C2003S, Beyotime) for 20 min. The cells were later washed twice using PBS. Cells were photographed under an inverted fluorescence microscope (Nikon, Japan) [Citation28,Citation29].
2.11. Cell cycle and apoptosis
The cell cycle of samples was detected via flow cytometry using the Beyotime Cell Cycle Kit (C1052, Beyotime, Guangzhou), and sample apoptosis was detected via flow cytometry with Annexin V FITC/PI (556,547, BD, USA). The cells were starved for 8 h prior to cell cycle analysis [Citation30].
2.12. Inhibition of mROS by melatonin
Next, we determined whether TARS2 knockdown induced apoptosis via mROS. shTARS2-1-transfected cells were cultured with 100 μM melatonin (M5250, Sigma, USA) for 2 h; mROS, MMP, and apoptosis were then detected using the above methods [Citation31–33].
2.13. Nude mouse xenograft assay
Six-week-old, 18–22 g female BALB/c nude mice (SiPeiFu Biology Ltd., China) were randomly divided into two groups: scramble and shTARS2-1 groups of 6 mice each, and 5 × 10⁶ A549 cells were injected subcutaneously into the right axillary fossa of each nude mouse (the experiment was stopped when the tumor size affected the animals’ diet). Six weeks later, the mice were euthanized under anesthesia. Tumor volumes were measured weekly and evaluated using the following formula: length×width2/2. The experiments were approved by the Experimental Animal Ethics Committee of Kunming Medical University. All mice were housed in a temperature-controlled room (humidity, 50%±10%; temperature of 22 ± 2°C). The mice were allowed to drink and eat freely [Citation11].
2.14. Statistical analysis
Statistical analysis of all data is expressed as the mean ± standard deviation (SD). A chi-squared test was used to analyze the correlation between TARS2 expression in LUAD tissues and clinicopathological parameters. OS rates were analyzed using the log-rank test (Kaplan-Meier plotter). A t-test was used to analyze statistical differences between the two groups. A parametric generalized linear model with random effects was used to analyze the MTS assay and tumor growth data. Statistical analyses were performed using SPSS v25.0 software. GraphPad Prism software (version 8.0) was used for to visualize the results. Statistical significance was set at p < 0.05 (* p < 0.05) [Citation23].
3. Results
The purpose of this study was to explore the clinical significance and biological function of TARS2 in lung adenocarcinoma. We hypothesized that TARS2 may serve as a clinical diagnostic and prognostic marker and may be involved in tumor progression. To elucidate the correlation between TARS2 and clinically related pathological parameters, we analyzed the expression of TARS2 in lung adenocarcinoma and non-cancerous lung tissues in TCGA and CPTAC databases and tissue samples. To explore the role of TARS2 in LUAD, lentiviruses were used to knockdown TARS2 expression. Cell proliferation was detected using MTS, clone formation, and EdU staining assays. Flow cytometry was used to detect the cell cycle, mROS production, and apoptosis. ΔΨm was detected using a JC-1 fluorescent probe. Melatonin was used to reduce mROS production induced by TARS2 knockdown. Cell cycle, apoptosis-related pathways, and mtDNA-encoded protein expression were detected via Western blotting. Finally, the effect of TARS2 on tumor growth was examined using a xenotransplanted tumor model in nude mice.
3.1 TARS2 is upregulated in LUAD tissues
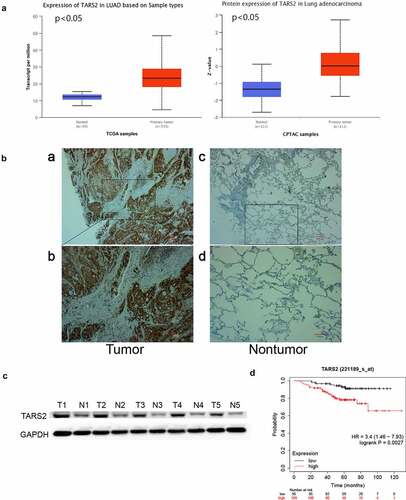
By analyzing the dataset from TCGA and CPTAC (http://ualcan.path.uab.edu/analysis.html), we found that TARS2 mRNA and protein expression was upregulated in primary tumors ()). TARS2 expression in 152 LUAD and 152 paired non-tumor tissues was detected using IHC ()). TARS2 was located in the cytoplasm and was highly expressed in 152 lung adenocarcinoma tissues. (67.76% vs 30.92%, ). Western blotting confirmed the high expression of TARS2 in five tumor tissues of lung adenocarcinoma patients ()).
Table 1. Correlation between the clinicopathological characteristics and expression of TARS2 in LUAD
Figure 1. TARS2 is upregulated in LUAD tissues and associated with a poorer prognosis. (a) TARS2 mRNA levels were significantly increased in LUAD (TCGA dataset). CPTAC dataset analysis revealed that TARS2 protein levels were significantly increased in LUAD. (b) TARS2 expression in LUAD tissues, as detected by immunohistochemical staining to verify TARS2 expression in (a – b) LUAD tissue and paired (c – d) nontumor tissue; a – b, positive TARS2 staining in LUAD tissue; c – d, negative TARS2 staining in nontumor tissue. The scale bar represents 100 μm. (c) TARS2 expression in LUAD tissues was detected by Western blotting. (d) The Kaplan-Meier plotter database predicted the OS rates of LUAD patients with TARS2 expression.
3.2. Relation between TARS2 expression in LUAD tissues and clinical characteristics
By analyzing our data, we found that there was no statistically significant correlation between TARS2 expression and AJCC clinical-stage, sex, age, T stage, N classification or smoking history (). OS was poorer in LUAD patients with positive TARS2 expression than in those with negative TARS2 expression (patients with negative surgical margins were selected, http://kmplot.com/analysis/index p < 0.05, )).
3.3. TARS2 knockdown inhibits proliferation of LUAD cells
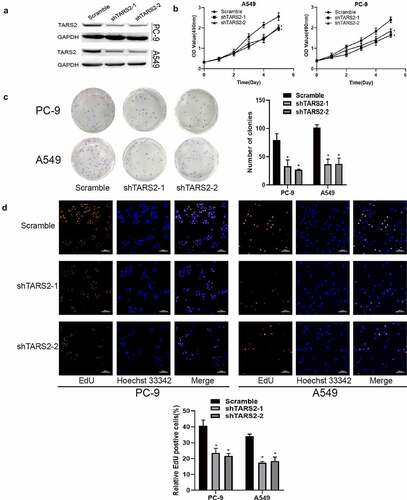
TARS2 shRNA was used to inhibit TARS2 expression in LUAD cells ()). MTS analysis showed that the knockdown of TARS2 significantly inhibited the viability of LUAD cells ()). A colony formation assay showed that TARS2 knockdown significantly reduced the number of colonies formed ()). EdU analysis revealed that TARS2 knockdown caused a significant reduction in DNA synthesis in A549 and PC-9 cells ()).
Figure 2. Knockdown of TARS2 inhibits the proliferation of LUAD cells. (a) TARS2 shRNA lentivirus decreased TARS2 expression. GAPDH is utilized as a reference protein. (b) TARS2 knockdown significantly inhibited the growth of LUAD cells, as evaluated by MTS. (c) In colony formation assays, TARS2 knockdown notably reduced the colony numbers of LUAD cells. (d) TARS2 knockdown notably reduces the ratio of EdU-positive LUAD cells (the scale bar represents 100 μm).
3.4. TARS2 gene regulates cell cycle through RB pathway
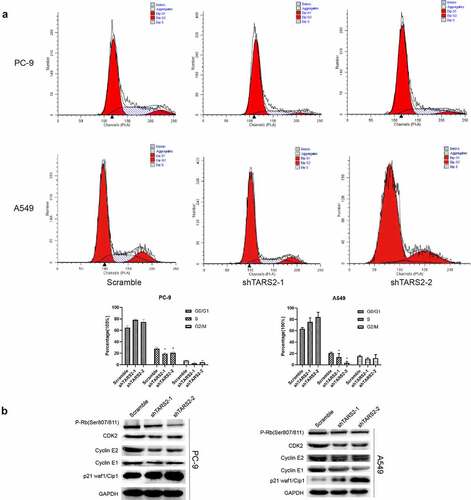
Flow cytometry demonstrated that knockdown of TARS2 reduced the percentage of cells in the S phase in LUAD cells ()). Cyclin-dependent kinases (CDKs) combines with a specific cyclin to control cell cycle progression [Citation34]. Cyclin E combines with CDK2 to form a complex and promote retinoblastoma protein phosphorylation [Citation35,Citation36]. Phosphorylated RB (p-RB) releases E2F, which activates the transcription of S-phase genes and promotes G1/S transition [Citation37]. In contrast, p21 Waf1/Cip1, a cell cycle protein-dependent kinase (CDK) inhibitor, prevents G1/S transition by inhibiting cyclin E [Citation38]. To elucidate the mechanism by which knockdown of the TARS2 gene can regulate the cell cycle and inhibit cell proliferation, we detected G1/S phase checkpoint proteins via Western blotting and found that p-RB, cyclin E1, cyclin E2, and CDK2 expression decreased and p21 expression increased after knockdown of TARS2 ()). Our results suggest that TARS2 regulates the cell cycle via the RB pathway.
Figure 3. TARS2 knockdown inhibits cell cycle progression (a) Downregulation of TARS2 inhibits the transition from G1 phase to S phase, as evidenced by a flow cytometric assay. (b) The protein levels of p-RB (ser807/811), CDK2, cyclin E1 and cyclin E2 were decreased and that of p21 waf1/cip1 was increased in TARS2-shRNA transfected LUAD cells. GAPDH is utilized as a reference protein.
3.5. TARS2 knockdown induces mitochondrial reactive oxygen species production by reducing mitochondrial-DNA expression
We found an increase in mitochondrial reactive oxygen species (mROS) production after knockdown of TARS2 by flow cytometry analysis (*p < 0.05, )). ROS are mainly produced in the mitochondria and mutation or loss of mitochondrial DNA can lead to overproduction of ROS. TARS2 is located in mitochondria and participates in protein translation. We speculated that TARS2 knockdown increases the production of mitochondrial ROS, possibly due to the downregulation of mitochondria-DNA (mtDNA). The results of Western blotting confirmed this conjecture; knockdown of TARS2 decreased the expression of MT-ND6, CYTB, MT-CO1, MT-CO3, and MT-ATP8 ()).
Figure 4. TARS2 knockdown and increases mROS-induced apoptosis of LUAD cells. (a) Downregulation of TARS2 increased production of mROS in PC-9 and A549. (b) The expression of MT-ND6, CYTB, MT-CO1, MT-CO3 and MT-ATP8 were decreased in TARS2-shRNA transfected LUAD cells. TOM20 is utilized as a reference protein. (*P < 0.05). (c) Downregulation of TARS2 decreases mitochondrial membrane potential in A549 and PC-9. (d) Downregulation of TARS2 increases PC-9 and A549 cells apoptosis. (e) The protein levels of cleaved caspase-8, −9 and −3 were decreased in TARS2-shRNA transfected LUAD cells. GAPDH is utilized as a reference protein. (*P < 0.05).
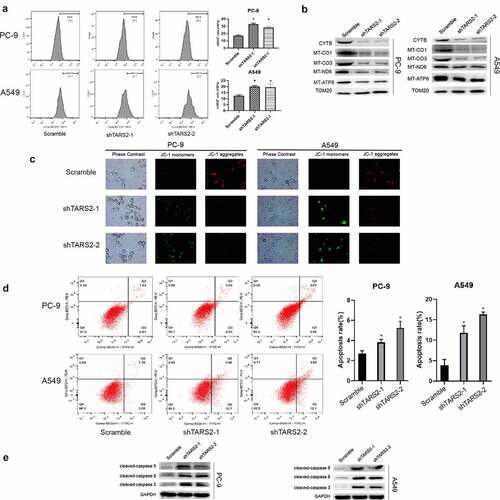
3.6. TARS2 knockdown decreases mitochondrial membrane potential (MMP, ΔΨm) and induces apoptosis of LUAD cells
MMP is an important indicator of mitochondrial function [Citation39]. We assessed the effect of TARS2 knockdown on MMP using JC-1 staining. Our results showed that the knockdown of TARS2 increased the conversion of JC-1 aggregates to monomers ()). These findings revealed that TARS2 knockdown decreased the MMP in LUAD cells. Decreased MMP is a signal of early apoptosis [Citation40]. ROS can induce apoptosis in various cell types. We found an increase in apoptosis after TARS2 knockdown by flow cytometry analysis (*p < 0.05, )). The expression of apoptotic proteins cleaved-caspase-8, −9, and −3 increased after knockdown of TARS2 ()). These results suggest that the knockdown of TARS2 promotes ROS-induced apoptosis in LUAD cells.
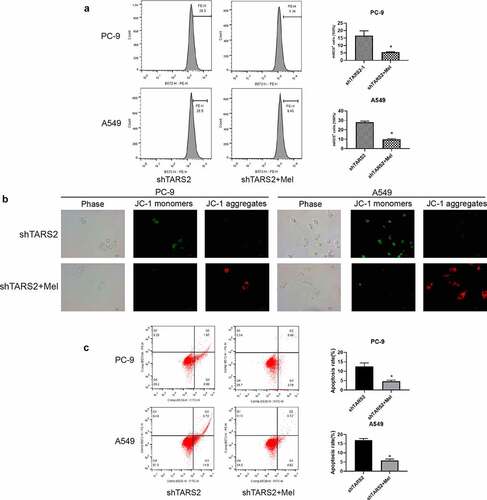
3.7. Inhibition of mROS production reduces apoptosis induced by TARS2 knockdown
We detected mROS production in shTARS2-1-transfected cells co-cultured with melatonin and found that melatonin could significantly inhibit the mROS production caused by TARS2 knockdown ()). We assessed the impact of mROS production on MMP through JC-1 staining and found that inhibition of mROS production could protect MMP in shTARS2-1-transfected A549 and PC-9 cells ()). The flow cytometry results demonstrate that inhibiting mROS production significantly reduces apoptosis induced by TARS2 knockdown ()). These results show that mROS are the key to apoptosis induced by TARS2 knockdown.
Figure 5. Inhibition of mROS production by melatonin protects MMP and reduces apoptosis. (a) Melatonin decreases mROS production induced by TARS2 knockdown. (b) Melatonin protects MMP induced by TARS2 knockdown. (c) Melatonin protects LUAD from apoptosis induced by TARS2 knockdown. (*P < 0.05).
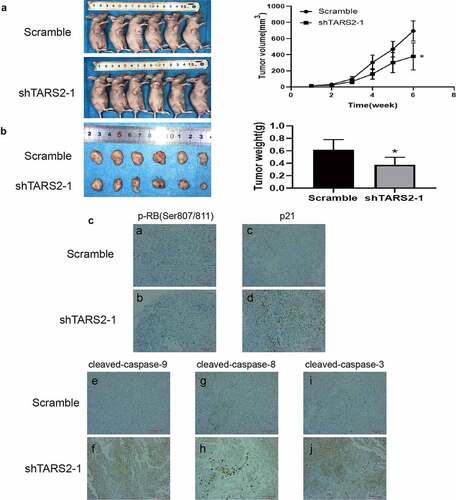
3.8. TARS2 knockdown inhibits LUAD growth in vivo
The results of the mouse subcutaneous tumor model indicated that the tumor growth rate of A549 cells transfected with shTARS2-1 was significantly inhibited compared with that of cells transfected with scramble shRNA. Tumor size and weight were lower in the shTARS2-1 group than in the scrambled control group (). The results of immunohistochemical staining showed that TARS2 knockdown decreases p-RB (ser807/811) expression and increases p21, cleaved-caspase-3, −8 and −9 expression ()). These results suggest that the knockdown of TARS2 suppresses A549 cell growth by inhibiting proliferation and inducing apoptosis.
Figure 6. Knockdown of TARS2 inhibits LUAD cells growth in vivo. (a) Tumor growth curves of mice inoculated with A549 cells infected with TARS2 lentivirus were measured weekly with vernier calipers. (b) Tumor weights at 6 weeks post injection. (c)Protein expression in tumor tissue sections detected by immunohistochemical staining. a – b, p-RB(Ser807/811) expression was decreased in shTARS2-1 group compared with SCRAMBLE group; c – d p21 expression was increased in shTARS2-1 group compared with SCRAMBLE group; e-f, cleaved-caspase 9 expression was increased in shTARS2-1 group compare with SCRAMBLE group; g-h, cleaved-caspase 8 expression was increased in shTARS2-1 group compare with SCRAMBLE group; i-j, cleaved-caspase 3 expression was increased in shTARS2-1 group compare with SCRAMBLE group. The scale bar represents 200 μm.
4. Discussion
TARS and TARS2 are both members of the aaRS family and encode cytoplasmic and mitochondrial threonyl-tRNA synthetases, respectively. AaRSs take part in tumor proliferation, invasion, metastasis, angiogenesis, and prognosis [Citation12,Citation41–44]. TARS is associated with tumor angiogenic markers and metastasis and affects the prognosis of patients with tumors. However, no tumor-related studies of TARS2 have been reported.
Our study showed that TARS2 was highly expressed in LUAD and was related to poor OS in patients. These results suggest that the upregulation of TARS2 is a potential prognostic factor for LUAD.
Previous reports have shown that TARS2 is required for threonine-sensitive mTORC1 activation in HEK293T cells [Citation45]. mTORC1 is a central regulator of cell proliferation [Citation46]. We suspect that TARS2 may play a role in cell proliferation. To elucidate the biological function of TARS2 in LUAD, shRNA lentiviruses were used to decrease TARS2 expression. Functional assays revealed that the knockdown of TARS2 in LUAD cells inhibited cell proliferation.
Excessive cell proliferation is a crucial biological feature of tumors and the level of cell proliferation is closely related to cell cycle progression [Citation47]. Our results showed that the knockdown of TARS2 in LUAD decreased the expression of p-RB, cyclin E1, cyclin E2, and CDK2, while the expression of p21 increased. Flow cytometry and EdU assays revealed a decrease in the percentage of cells in the S phase. Thus, we can infer that TARS2 knockdown inhibits cell proliferation through the RB pathway in LUAD cells.
Mitochondria have long been thought to provide energy to the body under aerobic conditions. More recently, mitochondria have been shown to play a key role in invasion, apoptosis, cell proliferation, and anti-tumor therapy in tumors [Citation48]. mtDNA encodes many critical proteins involved in respiratory complexes [Citation49]. TARS2 is located in the mitochondria and participates in protein translation, and mutations in TARS2 cause mitochondrial encephalomyopathies [Citation18]. mtDNA mutation or loss is a vital characteristic of mitochondrial encephalomyopathies [Citation20]. These studies indicate that TARS2 may participate in mitochondrial function by regulating mtDNA translation. Western blotting results indicated that knockdown of TARS2 in LUAD decreased the expression of NADH dehydrogenase subunit 6 (ND6), mitochondrial cytochrome b (CYTB), mitochondrially encoded cytochrome c oxidase 1 (MT-CO1), mitochondrially encoded cytochrome c oxidase 3 (MT-CO3), and mitochondrially encoded ATP synthase 8 (MT-ATP8). ND6 is a subunit of complex I, CYTB is a subunit of complex III, MT-CO1 and MT-CO3 are subunits of complex IV, and MT-ATP8 is a subunit of complex V [Citation50–53].
The mitochondrial respiratory enzyme complex regulates the mitochondrial electron transport chain. A previous study showed that reactive oxygen species are produced when the respiratory enzyme complex is dysfunctional [Citation54–56]. Ishikawa et al. showed that the G13997A mutation in ND6 induces an overproduction of ROS in tumor cells [Citation57]. Gonzalo et al. showed that the ND6 T14487C mutation causes overproduction of ROS [Citation58]. Sally A. Madsen–Bouterse et al. and Julia Matzenbacher et al. showed that decreased CYTB transcription promotes ROS production in mice [Citation59,Citation60]. Heike Weiss et al. demonstrated that an FVB mutation in ATP8 induces ROS generation [Citation61]. Our flow cytometry results demonstrate that TARS2 knockdown increases mROS production. mtDNA plays an important role in mitochondrial function. MMP is an important indicator of mitochondrial function. Many studies have shown that mROS induces mitochondrial membrane potential depolarization [Citation31]. We assessed the effect of TARS2 knockdown on MMP using JC-1 staining. Our results show that TARS2 knockdown decreases MMP in PC-9 and A549 cells.
Decreased MMP induces apoptosis by releasing cytochrome c into the cytoplasm, which signals early apoptosis. Cancer is a condition whereby apoptosis is too low, resulting in malignant cells that do not die [Citation62–64]. Caspases play a crucial role as important execution factors in apoptosis [Citation63,Citation65]. Caspase-8 and caspase-9 are both members of initiator caspases and participate in extracellular and intracellular apoptosis signals, respectively. ROS induces apoptosis by activating caspase-8 and caspase-9, and this activation may not be direct [Citation66–70]. Caspase-3 is an effector caspase that can be activated by caspase-8 and −9 to induce apoptosis [Citation71]. Flow cytometry results showed that the knockdown of TARS2 induced apoptosis in LUAD cells. The results of Western blotting showed that knockdown of TARS2 in A549 and PC elevated the expression of pro-apoptotic proteins cleaved caspase-9, −8, and −3.
Melatonin is an antioxidant produced in the pineal gland and can protect cells from oxidative damage [Citation32]. To study whether mROS participate in TARS2 knockdown-induced apoptosis, melatonin was used to reduce mROS generation. Our results showed that melatonin reduced oxidative stress induced by TARS2 knockdown ()). JC-1 staining showed that melatonin protected mmp in shTARS2-1-transfected A549 and PC-9 cells ()). The results of flow cytometry showed that inhibiting mROS generation significantly reduced apoptosis induced by TARS2 knockdown. These results confirm that TARS2 modulates ROS-induced apoptosis through mtDNA. Animal experiments have shown that the knockdown of TARS2 inhibits the growth of transplanted tumors.
5. Conclusions
In summary, TARS2 expression significantly increased in patients with LUAD and was associated with a poorer prognosis. Knockdown of TARS2 inhibits cell proliferation via the RB pathway and promotes ROS-induced apoptosis. Thus, TARS2 plays a carcinogenic role and may be a therapeutic target for LUAD.
Research highlights
TARS2 is highly expressed in LUAD and associated with poorer patient prognosis.
Knockdown of TARS2 inhibits cell proliferation through the RB pathway and promotes ROS-induced apoptosis.
Knockdown of TARS2 decreases the expression of mtDNA and increases the production of mROS in LUAD.
Disclosure statement
No potential conflict of interest was reported by the author(s).
Additional information
Funding
References
- Siegel RL, Miller KD, Fuchs HE, et al. Cancer statistics, 2021. CA Cancer J Clin. 2021;71:7–33.
- Patel MI, Cheng I, Gomez SL. US lung cancer trends by histologic type. Cancer. 2015;121:1150–1152.
- Torre LA, Siegel RL, Jemal A. Lung cancer statistics. Adv Exp Med Biol. 2016;893:1–19.
- Li Y, Dong R, Lu M, et al. Let-7b-3p inhibits tumor growth and metastasis by targeting the BRF2-mediated MAPK/ERK pathway in human lung adenocarcinoma. Transl Lung Cancer Res. 2021;10:1841–1856.
- Li G, Xie B, Li X, et al. Down-regulation of survivin and hypoxia-inducible factor-1 alpha by beta-elemene enhances the radiosensitivity of lung adenocarcinoma xenograft. Cancer Biother Radiopharm. 2012;27:56–64.
- Lee JJ, Park S, Park H, et al. Tracing oncogene rearrangements in the mutational history of lung adenocarcinoma. Cell. 2019;177:1842–1857.e21.
- Zhang Y, Ma Y, Li Y, et al. Comparative analysis of co-occurring mutations of specific tumor suppressor genes in lung adenocarcinoma between Asian and Caucasian populations. J Cancer Res Clin Oncol. 2019;145:747–757.
- Wang G, Bai X, Jiang G, et al. GIT1 overexpression promotes epithelial-mesenchymal transition and predicts poor prognosis in hepatocellular carcinoma. Bioengineered. 2021;12:30–43.
- Zhang S, Wang J, Chen T, et al. alpha-Actinin1 promotes tumorigenesis and epithelial-mesenchymal transition of gastric cancer via the AKT/GSK3beta/beta-catenin pathway. Bioengineered. 2021;12:5688–5704.
- Zhou X, Liu X, Zhang G, et al. Knockdown THOC2 suppresses the proliferation and invasion of melanoma. Bioengineered. 2019;10:635–645.
- Wu Y, Chen W, Gong Y, et al. Tetraspanin 1 (TSPAN1) promotes growth and transferation of breast cancer cells via mediating PI3K/Akt pathway. Bioengineered. 2021;12:10761–10770.
- Young HJ, Lee JW, Kim S. Function of membranous lysyl-tRNA synthetase and its implication for tumorigenesis. Biochim Biophys Acta. 2016;1864:1707–1713.
- Han JM, Kim JY, Kim S. Molecular network and functional implications of macromolecular tRNA synthetase complex. Biochem Biophys Res Commun. 2003;303:985–993.
- Hyeon DY, Kim JH, Ahn TJ, et al. Evolution of the multi-tRNA synthetase complex and its role in cancer. J Biol Chem. 2019;294:5340–5351.
- Chen Y, Ruan ZR, Wang Y, et al. A threonyl-tRNA synthetase-like protein has tRNA aminoacylation and editing activities. Nucleic Acids Res. 2018;46:3643–3656.
- Wellman TL, Eckenstein M, Wong C, et al. Threonyl-tRNA synthetase overexpression correlates with angiogenic markers and progression of human ovarian cancer. BMC Cancer. 2014;14:620.
- Jeong SJ, Kim JH, Lim BJ, et al. Inhibition of MUC1 biosynthesis via threonyl-tRNA synthetase suppresses pancreatic cancer cell migration. Exp Mol Med. 2018;50:e424.
- Diodato D, Melchionda L, Haack TB, et al. VARS2 and TARS2 mutations in patients with mitochondrial encephalomyopathies. Hum Mutat. 2014;35:983–989.
- Wang Y, Zhou XL, Ruan ZR, et al. A Human disease-causing point mutation in mitochondrial threonyl-tRNA synthetase induces both structural and functional defects. J Biol Chem. 2016;291:6507–6520.
- Zhang X, Zheng Y, Chen Z. Autophagy and mitochondrial encephalomyopathies. Adv Exp Med Biol. 2020;1207:103–110.
- Pang Y, Zhang Y, Zhang HY, et al. MUC13 promotes lung cancer development and progression by activating ERK signaling. Oncol Lett. 2022;23:37.
- Guo Z, Zhang X, Zhu H, et al. TELO2 induced progression of colorectal cancer by binding with RICTOR through mTORC2. Oncol Rep. 2021;45:523–534.
- Zeng B, Ge C, Li R, et al. Knockdown of microsomal glutathione S-transferase 1 inhibits lung adenocarcinoma cell proliferation and induces apoptosis. Biomed Pharmacother. 2020;121:109562.
- Zheng WQ, Pedersen SV, Thompson K, et al. Elucidating the molecular mechanisms associated with TARS2-related mitochondrial disease. Hum Mol Genet. 2021. DOI:10.1093/hmg/ddab257
- Lee SH, Jaganath IB, Wang SM, et al. Antimetastatic effects of Phyllanthus on human lung (A549) and breast (MCF-7) cancer cell lines. PLOS ONE. 2011;6:e20994.
- He TG, Xiao ZY, Xing YQ, et al. Tumor suppressor miR-184 enhances chemosensitivity by directly inhibiting SLC7A5 in retinoblastoma. Front Oncol. 2019;9:1163.
- Chang H, Zou Z, Li J, et al. Photoactivation of mitochondrial reactive oxygen species-mediated Src and protein kinase C pathway enhances MHC class II-restricted T cell immunity to tumours. Cancer Lett. 2021;523:57–71.
- Sivandzade F, Bhalerao A, Cucullo L. Analysis of the mitochondrial membrane potential using the cationic JC-1 dye as a sensitive fluorescent probe. Biol Protoc. 2019;9. DOI:10.21769/BioProtoc.3128
- Chazotte B. Labeling mitochondria with JC-1. Cold Spring Harb Protoc. 2011;2011(9). doi:10.1101/pdb.prot065490.
- Xu G, Fan L, Zhao S, et al. Neuronal pentraxin II (NPTX2) hypermethylation promotes cell proliferation but inhibits cell cycle arrest and apoptosis in gastric cancer cells by suppressing the p53 signaling pathway. Bioengineered. 2021;12:1311–1323.
- Jou MJ, Peng TI, Yu PZ, et al. Melatonin protects against common deletion of mitochondrial DNA-augmented mitochondrial oxidative stress and apoptosis. J Pineal Res. 2007;43:389–403.
- Song C, Peng W, Yin S, et al. Melatonin improves age-induced fertility decline and attenuates ovarian mitochondrial oxidative stress in mice. Sci Rep. 2016;6:35165.
- Pi H, Xu S, Reiter RJ, et al. SIRT3-SOD2-mROS-dependent autophagy in cadmium-induced hepatotoxicity and salvage by melatonin. Autophagy. 2015;11:1037–1051.
- Dong L, Yu L, Bai C, et al. USP27-mediated cyclin E stabilization drives cell cycle progression and hepatocellular tumorigenesis. Oncogene. 2018;37:2702–2713.
- Swaffer MP, Jones AW, Flynn HR, et al. CDK substrate phosphorylation and ordering the cell cycle. Cell. 2016;167:1750–1761.e16.
- Ohtsubo M, Theodoras AM, Schumacher J, et al. Human cyclin E, a nuclear protein essential for the G1-to-S phase transition. Mol Cell Biol. 1995;15:2612–2624.
- Burkhart DL, Morel KL, Sheahan AV, et al. The role of RB in prostate cancer progression. Adv Exp Med Biol. 2019;1210:301–318.
- Karimian A, Ahmadi Y, Yousefi B. Multiple functions of p21 in cell cycle, apoptosis and transcriptional regulation after DNA damage. DNA Repair (Amst). 2016;42:63–71.
- Teodoro JS, Palmeira CM, Rolo AP. Mitochondrial membrane potential (DeltaPsi) fluctuations associated with the metabolic states of mitochondria. Methods Mol Biol. 2018;1782:109–119.
- Zhu C, Zhang C, Cui X, et al. Trichosanthin inhibits cervical cancer by regulating oxidative stress-induced apoptosis. Bioengineered. 2021;12:2779–2790.
- Lee CW, Chang KP, Chen YY, et al. Overexpressed tryptophanyl-tRNA synthetase, an angiostatic protein, enhances oral cancer cell invasiveness. Oncotarget. 2015;6:21979–21992.
- Kim EY, Jung JY, Kim A, et al. Methionyl-tRNA synthetase overexpression is associated with poor clinical outcomes in non-small cell lung cancer. BMC Cancer. 2017;17:467.
- Kwon NH, Kang T, Lee JY, et al. Dual role of methionyl-tRNA synthetase in the regulation of translation and tumor suppressor activity of aminoacyl-tRNA synthetase-interacting multifunctional protein-3. Proc Natl Acad Sci U S A. 2011;108:19635–19640.
- Arita T, Morimoto M, Yamamoto Y, et al. Prolyl-tRNA synthetase inhibition promotes cell death in SK-MEL-2 cells through GCN2-ATF4 pathway activation. Biochem Biophys Res Commun. 2017;488:648–654.
- Kim SH, Choi JH, Wang P, et al. Mitochondrial threonyl-tRNA synthetase TARS2 is required for threonine-sensitive mTORC1 activation. Mol Cell. 2021;81:398–407.e4.
- Hay N, Sonenberg N. Upstream and downstream of mTOR. Genes Dev. 2004;18:1926–1945.
- Evan GI, Vousden KH. Proliferation, cell cycle and apoptosis in cancer. Nature. 2001;411:342–348.
- Kopecka J, Gazzano E, Castella B, et al. Mitochondrial metabolism: inducer or therapeutic target in tumor immune-resistance? Semin Cell Dev Biol. 2020;98:80–89.
- Yan C, Duanmu X, Zeng L, et al. Mitochondrial DNA: distribution, mutations, and elimination. Cells. 2019;8:379.
- Kampjut D, Sazanov LA, Mencarini L. The coupling mechanism of mammalian respiratory complex I. Science. 2020;369(6502):370.
- Hagen CM, Aidt FH, Havndrup O, et al. MT-CYB mutations in hypertrophic cardiomyopathy. Mol Genet Genomic Med. 2013;1:54–65.
- Errichiello E, Balsamo A, Cerni M, et al. Mitochondrial variants in MT-CO2 and D-loop instability are involved in MUTYH-associated polyposis. J Mol Med (Berl). 2015;93:1271–1281.
- Lubośny M, Przyłucka A, Śmietanka B, et al. Actively transcribed and expressed atp8 gene in Mytilus edulis mussels. PeerJ. 2018;6:e4897.
- Gogvadze V, Orrenius S, Zhivotovsky B. Mitochondria as targets for chemotherapy. Apoptosis. 2009;14:624–640.
- Ott M, Gogvadze V, Orrenius S, et al. Mitochondria, oxidative stress and cell death. Apoptosis. 2007;12:913–922.
- Kim WS, Lee KS, Kim JH, et al. The caspase-8/Bid/cytochrome c axis links signals from death receptors to mitochondrial reactive oxygen species production. Free Radic Biol Med. 2017;112:567–577.
- Ishikawa K, Koshikawa N, Takenaga K, et al. Reversible regulation of metastasis by ROS-generating mtDNA mutations. Mitochondrion. 2008;8:339–344.
- Gonzalo R, Garcia-Arumi E, Llige D, et al. Free radicals-mediated damage in transmitochondrial cells harboring the T14487C mutation in the ND6 gene of mtDNA. FEBS Lett. 2005;579:6909–6913.
- Dos Santos JM, de Oliveira DS, Moreli ML, et al. The role of mitochondrial DNA damage at skeletal muscle oxidative stress on the development of type 2 diabetes. Mol Cell Biochem. 2018;449:251–255.
- Madsen-Bouterse SA, Mohammad G, Kanwar M, et al. Role of mitochondrial DNA damage in the development of diabetic retinopathy, and the metabolic memory phenomenon associated with its progression. Antioxid Redox Signal. 2010;13:797–805.
- Weiss H, Wester-Rosenloef L, Koch C, et al. The mitochondrial Atp8 mutation induces mitochondrial ROS generation, secretory dysfunction, and beta-cell mass adaptation in conplastic B6-mtFVB mice. Endocrinology. 2012;153:4666–4676.
- Wong RS. Apoptosis in cancer: from pathogenesis to treatment. J Exp Clin Cancer Res. 2011;30:87.
- Estaquier J, Vallette F, Vayssiere JL, et al. The mitochondrial pathways of apoptosis. Adv Exp Med Biol. 2012;942:157–183.
- Lopez J, Tait SW. Mitochondrial apoptosis: killing cancer using the enemy within. Br J Cancer. 2015;112:957–962.
- Bock FJ, Tait SWG. Mitochondria as multifaceted regulators of cell death. Nat Rev Mol Cell Biol. 2020;21:85–100.
- Nishi K, Iwaihara Y, Tsunoda T, et al. ROS-induced cleavage of NHLRC2 by caspase-8 leads to apoptotic cell death in the HCT116 human colon cancer cell line. Cell Death Dis. 2017;8:3218.
- Zhang T, Zhao G, Zhu X, et al. Sodium selenite induces apoptosis via ROS-mediated NF-kappaB signaling and activation of the Bax-caspase-9-caspase-3 axis in 4T1 cells. J Cell Physiol. 2019;234:2511–2522.
- Tripathi SK, Rengasamy KRR, Biswal BK. Plumbagin engenders apoptosis in lung cancer cells via caspase-9 activation and targeting mitochondrial-mediated ROS induction. Arch Pharm Res. 2020;43:242–256.
- Kim JY, Park JH. ROS-dependent caspase-9 activation in hypoxic cell death. FEBS Lett. 2003;549:94–98.
- Dubey M, Nagarkoti S, Awasthi D, et al. Nitric oxide-mediated apoptosis of neutrophils through caspase-8 and caspase-3-dependent mechanism. Cell Death Dis. 2016;7:e2348.
- Zhivotovsky B. Caspases: the enzymes of death. Essays Biochem. 2003;39:25–40.