
ABSTRACT
This study aimed to compare the application value of capillary electrophoresis and next-generation sequencing for immunoglobulin (IG) gene rearrangement in the diagnosis of classic Hodgkin’s lymphoma. Twenty paraffin-embedded specimens from patients with classic Hodgkin’s lymphoma were screened. For gene rearrangement detection, the ABI 3500 Genetic Analyzer and ABI Ion GeneStudio S5 Plus sequencing system were used, respectively, and the results were compared. Five cases with monoclonal rearrangements (25%, 5/20) were detected by Capillary Electrophoresis, and positivity for the FR1, FR2, FR3, and IGк loci was 5%, 10%, 10%, and 15%, respectively; 12 cases with monoclonal rearrangements (60%, 12/20) were detected by Next-generation Sequencing where the positivity of the above corresponding loci were 35%, 45%, 50%, and 30%, respectively. Among the 20 samples, 6 IGк clonal rearrangements were detected, and the usage frequency (66.7%) of IGкJ4 was the highest in the IGкJ subgroup. The usage frequency of IGкV1 and IGкV3 in the GкV sub-group was 33.3% and 33.3%, respectively. Twelve immunoglobulin heavy chain (IGH) clonal rearrangements were detected among the 20 samples, and the order of usage frequency in the IGH joining region J (IGHJ) subgroup was IGHJ4 > IGHJ5 > IGHJ6 > IGHJ3. The gene with the highest usage frequency in the IGH variable (IGHV) subgroup was IGHV3 (50%) and the percentage of IGHV mutations ranged from 0% ± 11.45% with an average frequency of 3.34%. Compared with Capillary Electrophoresis, Next-generation Sequencing showed a higher positivity in the detection of gene clonal rearrangements, was more accurate in the interpretation of results.
Graphical abstract
Introduction
Lymphoma originates from the lymphopoietic system and is a highly heterogeneous malignancy [Citation1,Citation2]. In 2016, the World Health Organization released a new lymphoma classification, in which a variety of new molecular types were introduced, marking the era of molecular diagnosis in the clinical diagnosis of lymphoma [Citation3–5]. Currently, 10%–15% of cases with lymphoma cannot be diagnosed by histomorphological and immunological tests, and further molecular biology is needed to assist in diagnoses [Citation6]. Therefore, a comprehensive evaluation approach combining clinical characteristics, histomorphology, imaging, immunohistochemistry, and molecular genetics has become necessary for the diagnosis of lymphoma [Citation7].
During the development of lymphomagenesis, stimulated by tumor-specific antigens or tumor-associated antigens, one or several immunoglobulins (IGs) or T- cell receptor (TCR) genes in lymphocytes undergo targeted and selective rearrangement, resulting in the monoclonal expression of IG or TCR genes [Citation8]. These may result in the clonal proliferation of lymphocytes, a process known as lymphoma monoclonal rearrangement [Citation9,Citation10]. Currently, the commonly used methods for the detection of lymphoma gene rearrangement include gel electrophoresis, capillary electrophoresis, and next-generation sequencing techniques. Capillary electrophoresis is considered the ‘gold standard’ for nucleic acid detection because of its low technical error rate [Citation5] and is widely applied in clinical practice [Citation11].
Several studies have shown that abnormal peaks often occur in the results of Capillary Electrophoresis detection of IG and TCR gene rearrangements [Citation12–15], which affects the interpretation of the results and fails to provide a clear reference meaning for histological diagnosis. In contrast, Next-generation Sequencing technology is easy to operate, has a high throughput and uniform judgment criteria, and can detect specific loci in the case of gene clonal rearrangements [Citation16,Citation17]; it can also analyze the somatic hypermutations of the IGH and IGк variable V-region genes [Citation15,Citation16]. Schumacher et al. [Citation18] used next-generation sequencing technology and traditional capillary electrophoresis to detect gene clonal rearrangement in 48 patients with T-cell lymphoma, and found that next-generation sequencing technology can be applied to clonality testing. A primary method of evaluation, especially when analysis by capillary electrophoresis techniques is difficult. In view of the differences between next-generation sequencing technology and capillary electrophoresis in the detection of gene rearrangement in lymphoma, especially for cases with difficult judgment criteria by capillary electrophoresis, it is necessary to compare the application value of the two methods.
Therefore, in order to clarify the application value of capillary electrophoresis and next-generation sequencing in the detection of immunoglobulin gene rearrangement in the diagnosis of classic Hodgkin’s lymphoma, we screened 20 cases of classic Hodgkin’s lymphoma as the research objects. Electrophoresis and next-generation sequencing methods were used to detect the rearrangement of the immunoglobulin heavy chain H and light chain kappa genes, and to analyze the differences between the two detection techniques, so as to provide more gene clonality for classic Hodgkin’s lymphoma. Rearrange detection information and diagnostic basis.
Material and methods
Cases and samples
In this study, 20 paraffin-embedded specimens from patients with classic Hodgkin’s lymphoma from the Department of Pathology in the First People’s Hospital of Yunnan Province, China, were retrospectively collected from 2014 to 2019, and the diagnoses were confirmed by two pathologists. This study was conducted in accordance with the declaration of Helsinki and approved by the Ethics Committee of the First People’s Hospital of Yunnan Province. Written informed consent was obtained from all participants.
Nucleic acid extraction and quantification
Ten 10-μm white films were cut from each wax block and deoxyribonucleic acid (DNA) was extracted using a nucleic acid extraction kit (Xiamen AmoyDx formalin-fixed paraffin-embedded [FFPE] DNA Extraction Kit). The concentration and purity of DNA were determined by Nanodrop™.
Capillary electrophoresis
The DNA quality was verified using a specimen control size ladder mixture (California USA Invivoscribe Technologies) kit. The Master Mix (IGH Gene Clonality Assay – ABI Fluorescence/IGк Gene Clonality Assay – ABI Fluorescence) clonality detection system was prepared and corresponding negative and positive controls were set up. Polymerase chain reaction (PCR) amplification was conducted (95°C, 7 min; 95°C, 45s; 60°C, 45s; 72°C, 90s; return to step 2 and repeat 34 more times; 72°C, 10 min; 15°C, 1 min). The ABI 3500 Genetic Analyzer was adopted for the detection of the amplification products. Clonality interpretation of the results was conducted according to the determination criteria () [Citation19].
Table 1. Interpretation of capillary electrophoresis results
Next-generation sequencing
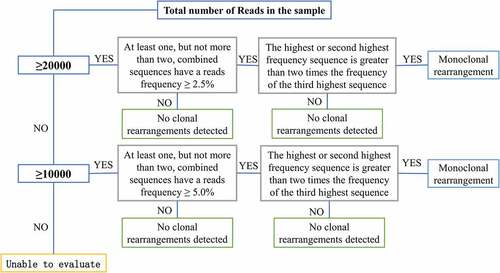
The DNA quality was verified using the specimen control size ladder mix (California USA Invivoscribe). The LymphoTrack (LymphoTrack® IGH FR1/2/3 Assay – S5/PGM™/ LymphoTrack® IGк Assay – S5/PGM™) clonality assay system was prepared and the corresponding negative quality control (QC), positive QC, and blank QC were set up. The composition of the PCR amplification system was as follows: 45 μL of Master Mix, 0.2 μL of AmpliTaq Gold Taq, and 5 μL of sample or control DNA; the total volume was 50 μL. The program details of the amplification were as follows: 95°C, 7 min; 95°C, 45s; 60°C, 45s; 72°C, 90s; return to step 2 and repeat 29 more times; 72°C, 10 min; 15°C, 1 min. The PCR products were purified by the AMPure XP method, and the size and concentration of the purified product fragments were detected using the 4200 D1000 ScreenTape assay. Finally, the samples were diluted to 25 pM, and the gene libraries were constructed using the Ion PGMTM Hi-QTM Reagent Mix, Ion PGMTM Hi-QTM Enzyme Mix, nuclease-free water, and a diluted library system, and sequenced using the ABI Ion GeneStudio S5 Plus Next-generation Sequencing instrument. The LymphoTrack Dx PGM software was adopted for analysis of the sequencing results; clonality determination of the results was conducted based on the determination criteria () [Citation20].
Figure 1. A flow chart showing the interpretation of next-generation sequencing results.

Statistic analysis
The SPSS Statistics 23.0 software was employed for statistical analysis of the data. The Spearman’s rank correlation test and the chi-squared (χ2) exact test were used for comparison between groups; P < 0.05 was considered statistically significant.
Results
In this study, we used capillary electrophoresis technology and next-generation sequencing technology to detect gene rearrangement in paraffin-embedded tissue of classical Hodgkin’s lymphoma, and then performed correlation analysis between the results obtained by the two detection methods. The research shows that the detection results of the two technologies are quite different, and it is reasonable to infer that the detection effect of the next-generation sequencing method is better than that of the capillary electrophoresis method.
The clinical characteristics of the enrolled patients
The general clinical characteristics of the 20 cases with classic Hodgkin’s lymphoma are demonstrated in . There were 15 males and 6 females with an average age of 38.6 years. The maximum age was 86 years and the minimum age was 14 years. In the present study, correlation analyses were conducted among various clinical and pathological indicators such as Ann Arbor staging, serum lactate dehydrogenase (LDH) levels, and the immunohistochemical results of tissue; no significant correlation was found between these general characteristics and various clinical and pathological indicators.
Table 2. The clinicopathological characteristics of the patients
The DNA sample quality
The sample DNA was detected by ultraviolet spectrophotometer, and the optical density (OD) 260/280 ratio ranged between 1.7–2.0. The concentration of DNA extracted from the paraffin-embedded tissue was between 46.2 and 147.2 ng/μL, which was in accordance with the requirements for the library construction.
Results analysis of the Capillary Electrophoresis and Next-generation Sequencing
The detection results of IGH and IGк gene rearrangement in 20 samples are shown in . Five cases with monoclonal rearrangements (25%, 5/20) were detected by Capillary Electrophoresis () and 12 cases (60%, 12/20) were detected by Next-generation Sequencing. There are 9 samples with ≥10,000 sample readings and 17 loci. There are 11 samples with 63 loci with sample readings ≥ 20,000. The detection rate of FR1, FR2, and FR3 clonal rearrangement by Next-generation Sequencing was higher (35% [7/20], 45% [9/20], 50% (10/20)] than that detected by Capillary Electrophoresis (5% [1/20], 10% [2/20], 10% [2/20]) (). The detection rate of IGк clonal rearrangement by Next-generation Sequencing was higher than that by Capillary Electrophoresis (30% [6/20] vs. 15% [3/20]) (). Among all the samples, 9 had consistent results for all loci detected by the two methods. In addition, there were 26 loci in 11 samples with inconsistent results, and the average consistency between the two methods was 67.5%. The detection rate of Capillary Electrophoresis was lower compared with Next-generation Sequencing, and the difference was statistically significant (P < 0.05) ().
Table 3. Sample and loci gene rearrangement test results
Table 4. IGH FR1, IGH FR2, IGH FR3, and IGк rearrangement detection results
Table 5. Comparison of sensitivity of capillary electrophoresis and next-generation sequencing for the sample and loci analysis
The gene use analysis results of the IGк, IGH, and IGHV mutation analyses
Among the 20 samples, IGк clonal rearrangements were detected in 6 samples, and the rearrangement sequence ranked first (tumor cell clonal gene rearrangement sequence) was selected for analysis. The usage frequencies of IGкV1 (33.3%) and IGкV3 (33.3%) were the highest, followed by that of IGкV2 (16.7%) and IGкV4 (16.7%). Among the fragments in the IGHкJ region, the usage frequency of IGкJ4 (66.7%) was the highest, followed by that of IGкJ1 (16.7%) and IGкJ2 (16.7%) (). Among the specific types of IGк genes, the gene with the highest usage frequency was IGкV3D-20 (33.3%), followed by IGкV1-27, IGкV1-13, IGкV2-30, and IGкV4-1, with a usage frequency of 16.7%, respectively (). In addition, IGH clonal rearrangements were detected in 12 of the 20 samples. The IGHJ and IGHV sequences were analyzed and IGHJ4 (50%) was found to be the gene with the highest usage frequency in the IGHJ subgroup of all cases, followed by IGHJ5 (25%), IGHJ6 (16.7%), and IGHJ3 (8.3%); no IGHJ1 or IGHJ2 families were observed (). In the IGHV subgroup, the usage genes included IGHV3 (50%), IGHV1 (25%), and IGHV4 (25%), all of which were the most common V-region fragments; the IGHV2, IGHV5, and IGHV6 families were not detected. Among the IGHV-region genes, IGHV3-9 (25%) was the gene with the highest usage frequency, followed by IGHV3-21 (16.7%), and IGHV4-34 (16.7%) (). The percentage of IGHV mutations ranged from 0% ± 11.45% with an average of 3.34%; among them, 4 cases had IGHV mutations (33.3%) and no mutation was detected in 8 cases (66.6%).
Figure 2. The analysis of IGк and IGHV gene usage. a: The statistical results of IGк gene clones with maximum advantage. b: The specific IGкV region gene usage frequency statistical results. c: The statistical results of IGH gene clones with maximum advantage. d: The specific IGHV region gene usage frequency statistical results.
In the present study, correlation analyses were conducted between gene mutations and various clinically relevant indicators including gender, age, and Ann Arbor stage in patients. However, due to the limited sample size, no significant correlation was found between IGк, IGH gene usage frequency, or between IGHV mutations and various clinical indicators.
Discussion
The diagnosis and differential diagnosis of lymphoma is complex, with a high rate of misdiagnosis [Citation21–24]. Since the late 1980s, molecular genetic analysis has gradually become an important adjunct for providing objective indicators for the diagnosis of lymphoma [Citation25–28]. Currently, Capillary Electrophoresis technology is considered the gold standard for nucleic acid detection because of its low error rate [Citation5] and it is widely applied in clinical practice [Citation11]. However, abnormal results such as peaks out-of-range or low peaks may occur in some cases and fail to guide clonality determination for histological and immunological diagnosis [Citation29]. In recent years, Next-generation Sequencing has emerged as a high-throughput sequencing technology that is characterized by the ability to obtain information on all rearranged loci at one time [Citation30]. The application of Next-generation Sequencing can further improve the detection rate of lymphoma and reduce the incidence of false positivity and false negativity in gene rearrangement assays. In the present study, the gene rearrangement information from paraffin-embedded samples taken from 20 patients with classic Hodgkin’s lymphoma in Yunnan Province, China, and detected by Capillary Electrophoresis and Next-generation Sequencing were compared. The investigation results showed that Next-generation Sequencing had a higher detection rate in the gene clonal rearrangements than Capillary Electrophoresis, and the detection rate of IGH and IGк clonal rearrangements in classical Hodgkin’s lymphoma by Next-generation Sequencing were higher than those by Capillary Electrophoresis (35%/5% 45%/10% 50%/10% 30%/15%). The usage frequency of IGH and IGк genes and IGHV mutations are commonly reported in studies concerning chronic large B-cell lymphoma and chronic lymphocytic leukemia but not in classical Hodgkin’s lymphoma. In the present study, the gene usage of IGH and IGк in classical Hodgkin’s lymphoma and the frequency of IGHV mutations were statistically analyzed. Among the 12 samples analyzed, IGHV mutations occurred in 4 cases, with an average mutation rate of 3.34%. This study found that IGHV mutation frequency was not correlated with the usage frequency of the familial gene, while the correlation with tumor grade could not be assessed. The present study aimed to compare the application results of the two detection methods. To further exclude the abnormal results of Capillary Electrophoresis, particularly in cases where the results of Capillary Electrophoresis were close to the judging criteria and failed to provide sufficient evidence for interpretation, the sequences of the fragment were detected by Next-generation Sequencing; following validation, we found that the results of the two methods were inconsistent in 11 samples ().
Table 6. Samples with non-conforming results for clonogenic rearrangement generation sequencing and next generation sequencing assays
Sample 1: A monoclonal peak was detected at the IGк locus (190 bp) by Capillary Electrophoresis; conversely, monoclonal rearrangements at FR2, FR3, and IGк loci were detected by Next-generation Sequencing and involved the clonotypes of IGHV1-J5, IGHV4-J4, and IGкV3-J4.
Sample 3: Polyclonal rearrangements were detected at the FR1, FR2, and FR3 loci by Capillary Electrophoresis with no corresponding amplification peak at the IGк loci. However, the Next-generation Sequencing results showed that there existed monoclonal rearrangements at FR1, FR2, and IGк, and the clonal types included IGHV3-J3 and IGкV1-J4.
Sample 4: Capillary electrophoresis only detected a high single peak at 139 bp at the IGк locus; conversely, the Next-generation Sequencing results showed that FR2, FR3, and IGк loci all had monoclonal rearrangements, with clonotypes including IGHV1-J4, IGHV4-J6, and IGкV1-J4.
Sample 11: There existed polyclonal peaks at the FR2 and FR3 loci in the Capillary Electrophoresis detection but no corresponding amplification peaks at the FR1 and IGк loci. Conversely, the Next-generation Sequencing results showed monoclonal rearrangement at the FR1 and FR3 loci, in which the clonotypes included IGHV3-J4.
Sample 12: Next-generation sequencing detection revealed monoclonal rearrangements at the FR1, FR2, and FR3 loci.
Sample 13: Next-generation sequencing detection showed monoclonal rearrangements at the FR1, FR2, and FR3 loci.
Sample 14: Next-generation sequencing detection revealed monoclonal rearrangements at the FR1, FR2, and FR3 loci.
Sample 15: Next-generation sequencing detection showed monoclonal rearrangements at the FR1, FR2, and FR3 loci.
Sample 16: Next-generation sequencing detection revealed monoclonal rearrangements at the FR1, FR2, and FR3 loci.
Sample 17: Monoclonal peaks at the FR2 and FR3 loci were detected in the Capillary Electrophoresis assay, and there was no corresponding amplification peak at the FR1 and IGк loci. The Next-generation Sequencing results showed that there existed monoclonal rearrangements at the FR1, FR2, FR3, and IGк loci, in which the clonotypes included IGHV3-J6, IGHV1-J4, and IGкV3-J2.
Sample 20: A corresponding amplification peak was detected by Capillary Electrophoresis at the IGк locus, while Next-generation Sequencing found monoclonal rearrangements at the FR1, FR2, and FR3 loci.
High-quality nucleic acid is an important prerequisite for getting accurate sequencing results. Compared with the fresh specimens, paraffin-embedded samples are abundant, easy to transport, can be stored for a long time, and represent the most commonly used preservation method [Citation31]. With the development of precision medicine, paraffin-embedded specimens are playing an increasingly important role in tumor genetic testing; however, they are affected by reagents and other factors during the production process, resulting in DNA degradation by fragmentation [Citation32]. Guyard et al. observed a decrease in both the quantity and quality of DNA extracted from paraffin-embedded samples that had been stored for many years [Citation33]. The present study found that different sequencing methods resulted in a different positivity for the same batch of samples. When sequencing was conducted by Capillary Electrophoresis, monoclonal rearrangements were detected in 5 of 20 specimens (25%, 5/20), while the same DNA samples were found to have monoclonal rearrangements in 12 specimens when tested by Next-generation Sequencing (60%, 12/20). The results of the comparison showed that the sensitivity of Capillary Electrophoresis and Next-generation Sequencing techniques differed when adopting the same DNA. Notably, these results suggested that storage time influenced the paraffin-embedded specimens in terms of the adopted sequencing method; furthermore, as well as a difference between Capillary Electrophoresis and Next-generation Sequencing measurements, Next-generation Sequencing was better suitable for use in retrospective studies. Therefore, in cases of severe DNA fragmentation, Next-generation Sequencing technology can be adopted to further improve the accuracy of diagnosis and treatment.
In the present study, the comparison of Capillary Electrophoresis and Next-generation Sequencing results () showed that the rearrangement results of different loci of the same sample were different. For example, in sample 18, a clonal rearrangement in FR2 and FR3 was detected by Capillary Electrophoresis, while the presence of FR1, FR2, FR3, and IG1 gene rearrangements was detected by Next-generation Sequencing (), where the total number of reads detected for FR1 was 88,105, including two clonotypes (IGVH3-J6 and IGHV1-J4) (). The comparison revealed that several loci in the Capillary Electrophoresis results failed to show the expected amplification peaks. Several similar studies have been conducted [Citation34–36]. This phenomenon may have been the result of changes in the primer binding sites due to rearrangement, which affected the effective binding of genes to primers and resulted in PCR amplification failure. It was verified that in the detection of B-cell non-Hodgkin’s lymphoma, somatic hypermutation of the IGH in the germinal center affected the positivity of monoclonal assays for lymphoma originating from the germinal center, and somatic hypermutation at the primer binding site may have led to the occurrence of the above phenomenon [Citation37]. Therefore, when it is difficult to judge the Capillary Electrophoresis results in some cases, Next-generation Sequencing technology can be adopted to obtain rearrangement sequences to further clarify the gene rearrangement clones and provide more accurate information for clinical practice.
Table 7. Sequencing results of representative confirmed patients
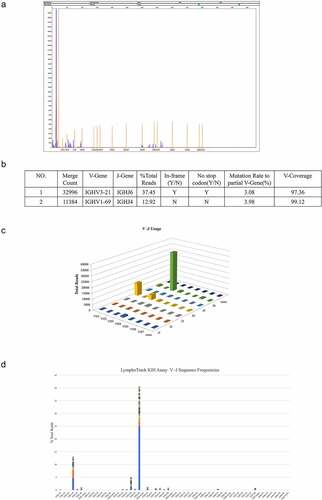
Figure 3. The FR1 sequencing results (sample). a: First-generation sequencing clonality assessment shows the absence of clonal rearrangement by FR1 sets. b–d: The major clone-utilizing IGHV3-21 and IGHJ6 sequences merge count is 32,996 and represents 37.45% of the total sequences, whereas the minor clone utilizing IGHV1-69 and IGHJ4 merge count is 11,384 and represents 12.92% of the total sequences. Both rearrangements show a similar mutation rate (3.08% and 3.98%) relative to the reference V-gene sequence.
It is worth noting that in the 20th sample (), the results of capillary electrophoresis showed that the IGк site was rearranged monoclonally. In the next-generation sequencing, the FR1, FR2, and FR3 sites were single-clonally rearranged, while the IGк site was a polyclonal rearrangement. Row. The possible reasons for this result are that, on the one hand, the diversity of the Vк-Jк junction region is low, and it is easy to form false positive clones, which is also the reason why a false dominant clone peak always appears around 150bp in normal lymphoid tissue. On the one hand, the capillary electrophoresis method distinguishes different clones based on the length of the rearranged sequence, and the primers in the Vк region are prone to mismatches. From the quality control results, it can be found that the quality of the nucleic acid of sample No. 20 is poor, resulting in the expansion of the advantage of small fragments. increased, and a dominant monoclonal peak appeared at the lower limit of the calling range of 120 bp. The next-generation sequencing method distinguishes different clones based on the rearrangement sequence, and can obtain complete sequence information. Compared with the simple fragment size of capillary electrophoresis, the diversity of Vк-Jк can be greatly enriched. Some clones are distinguished with higher accuracy. Therefore, IG gene rearrangement detected by next-generation sequencing is a better and more feasible method than capillary electrophoresis for the clonality assessment of paraffin-embedded samples of classical lymphoproliferative diseases.
In a recent study that included 1,189 cases with B-cell and plasma cell tumors, both Capillary Electrophoresis and Next-generation Sequencing methods were shown to have good application for gene rearrangement detection, and it was concluded that the Next-generation Sequencing results were superior to Capillary Electrophoresis in the routine identification of IGH clonality [Citation20]. The comparative data in the present study revealed a significant difference in the positivity of clonal rearrangements detected by the two methods (). In summary, it was feasible to adopt Next-generation Sequencing to detect IG gene rearrangements and apply to the paraffin-embedded specimens of patients with classical Hodgkin’s lymphoma. Compared with Capillary Electrophoresis, Next-generation Sequencing had a higher positive detection rate for clonal rearrangements and may have been more accurate in the interpretation of results. In addition, when gene rearrangement analysis is used to diagnose lymphoma, these data should be combined with the PCR results, clinical data, the results of histomorphology, and immunohistochemistry to allow for a comprehensive evaluation of the disease.
Conclusion
In this study, 20 cases of classic Hodgkin lymphoma pathology were used as the research objects. The clonal rearrangement of immunoglobulin heavy chain H and light chain κ genes was detected by capillary electrophoresis and next-generation sequencing technology. The results show that the next-generation sequencing technology has higher sensitivity and specificity than capillary electrophoresis for detecting gene clonal rearrangements. In addition, the second-generation sequencing technology also has other advantages, such as higher resolution and more objective interpretation standards. The overall detection effect is better than that of capillary electrophoresis, and it can be used as an important auxiliary method for the diagnosis of classic Hodgkin lymphoma.
Disclosure statement
No potential conflict of interest was reported by the author(s).
Data availability statement
The datasets used and/or analysed during the current study available from the corresponding author on reasonable request.
Additional information
Funding
References
- Ok CY, Medeiros LJ, Thakral B, et al. High-grade B-cell lymphomas with TdT expression: a diagnostic and classification dilemma. Mod Pathol. 2019;32(1):48–58.
- Bray F , Ferlay J , Soerjomataram I. Global cancer statistics 2018: GLOBOCAN estimates of incidence and mortality worldwide for 36 cancers in 185 countries[J]. CA Cancer J Clin. 2018;68(6):394–424.
- Swerdlow SH, Campo E, Pileri SA, et al. The 2016 revision of the world health organization classification of lymphoid neoplasms. Blood. 2016;127(20):2375–2390.
- Zhu J, Ma J, For China lymphoma investigators of Csco U. Chinese Society of Clinical Oncology (CSCO) diagnosis and treatment guidelines for malignant lymphoma 2021 (English version). Chin J Cancer Res. 2021;33(3):289–301.
- Bluth MJ, Bluth MH. Molecular Pathology Techniques: advances in 2018. Clin Lab Med. 2018;38(2):215–236.
- Nikiforova MN, Hsi ED, Braziel RM, et al. Detection of clonal IGH gene rearrangements: summary of molecular oncology surveys of the College of American Pathologists. Arch Pathol Lab Med. 2007;131(2):185–189.
- Illes A, Simon Z. New trends and novel possibilities in the diagnosis of lymphomas. Magy Onkol. 2015;59(1):73–78.
- van der Burg M, Tumkaya T, Boerma M, et al. Ordered recombination of immunoglobulin light chain genes occurs at the IGK locus but seems less strict at the IGL locus. Blood. 2001;97(4):1001–1008.
- H. W W, J. P B, Pittaluga S, et al. Diagnosis of Hodgkin lymphoma in the modern era. Br J Haematol. 2019;184(1):45–59.
- Jeon YK, Yoon SO, Paik JH, et al. Molecular testing of lymphoproliferative disorders: current status and perspectives. J Pathol Transl Med. 2017;51(3):224–241.
- Nguyen JT, Kini AR, Li Y, et al. Analysis of immunoglobulin heavy chain rearrangement in a child with recurrent Burkitt lymphoma to determine clonality. J Pediatr Hematol Oncol. 2014;36(2):e125–e127.
- van Krieken JH, Langerak AW, Macintyre EA, et al. Improved reliability of lymphoma diagnostics via PCR-based clonality testing: report of the BIOMED-2 concerted action BHM4-CT98-3936. Leukemia. 2007;21(2):201–206.
- Ohshima K, Kikuchi M, Shibata T, et al. Clonal analysis of hodgkin’s disease shows absence of TCR/Ig gene rearrangement, compared with T-cell-rich B-cell lymphoma and incipient adult T-cell leukemia/lymphoma. Leuk Lymphoma. 1994;15(5–6):469–479.
- Patel KP, Pan Q, Wang Y, et al. Comparison of BIOMED-2 versus laboratory-developed polymerase chain reaction assays for detecting T-cell receptor-gamma gene rearrangements. J Mol Diagn. 2010;12(2):226–237.
- Kokovic I, Jezersek NB, Novakovic S. Diagnostic value of immunoglobulin kappa light chain gene rearrangement analysis in B-cell lymphomas. Int J Oncol. 2015;46(3):953–962.
- Chi X, Li Y, Qiu X. V(D)J recombination, somatic hypermutation and class switch recombination of immunoglobulins: mechanism and regulation. Immunology. 2020;160(3):233–247.
- Scott GB, de Wynter EA, Cook GP. Detecting variable (V), diversity (D) and joining (J) gene segment recombination using a two-colour fluorescence system. Mob DNA. 2010;1(1):9.
- Schumacher JA, Duncavage EJ, Mosbruger TL, et al. A comparison of deep sequencing of TCRG rearrangements vs traditional capillary electrophoresis for assessment of clonality in T-Cell lymphoproliferative disorders. Am J Clin Pathol. 2014;141(3):348–359.
- van Dongen JJ, Langerak AW, Brüggemann M, et al. Design and standardization of PCR primers and protocols for detection of clonal immunoglobulin and T-cell receptor gene recombinations in suspect lymphoproliferations: report of the BIOMED-2 Concerted Action BMH4-CT98-3936. Leukemia. 2003;17(12):2257–2317.
- M.e A, Yu W, Syed M, et al. Establishment of immunoglobulin heavy (igh) chain clonality testing by next-generation sequencing for routine characterization of b-cell and plasma cell neoplasms. J Mol Diagn. 2019;21(2):330–342.
- Li X. Pitfalls in the pathological diagnosis of lymphoma. Chin Clin Oncol. 2015;4(1):3.
- Chan JK, Kwong YL. Common misdiagnoses in lymphomas and avoidance strategies. Lancet Oncol. 2010;11(6):579–588.
- Liu PL, Cheng ZX, Lu MP, et al. Misdiagnosis analysis: 120 patients with nasal extranodal NK/T cell lymphoma in head and neck. Lin Chung Er Bi Yan Hou Tou Jing Wai Ke Za Zhi. 2020;34(1):73–78.
- Tokola S, Kuitunen H, Turpeenniemi-Hujanen T, et al. Interim and end-of-treatment PET-CT suffers from high false-positive rates in DLBCL: biopsy is needed prior to treatment decisions. Cancer Med. 2021;10(9):3035–3044.
- Rea B, Haun P, Emerson R, et al. Role of high-throughput sequencing in the diagnosis of cutaneous T-cell lymphoma. J Clin Pathol. 2018;71(9):814–820.
- Deonizio JM, Guitart J. The role of molecular analysis in cutaneous lymphomas. Semin Cutan Med Surg. 2012;31(4):234–240.
- Hiemcke-Jiwa LS, Leguit RJ, Snijders TJ, et al. Molecular analysis in liquid biopsies for diagnostics of primary central nervous system lymphoma: review of literature and future opportunities. Crit Rev Oncol Hematol. 2018;127:56–65.
- Maezawa M, Watanabe KI, Horiuchi N, et al. Molecular diagnosis of bovine B-cell lymphoma using polymerase chain reaction for immunoglobulin heavy chain gene. J Vet Med Sci. 2020;82(1):61–63.
- Rothberg P.G., Langerak L.W., and Verhaaf B, et al. Bacon Penny Wright Anthony Bench Ming-Qing Du Hongxiang Liu P G R A. Clonal antigen receptor gene PCR products outsidethe expected size range. J Hematopathol. 2012;53:57–67.
- Sufficool KE, Lockwood CM, Abel HJ, et al. T-cell clonality assessment by next-generation sequencing improves detection sensitivity in mycosis fungoides. J Am Acad Dermatol. 2015;73(2):228–236.
- Rivero ER, Neves AC, Silva-Valenzuela MG, et al. Simple salting-out method for DNA extraction from formalin-fixed, paraffin-embedded tissues. Pathol Res Pract. 2006;202(7):523–529.
- Watanabe M, Hashida S, Yamamoto H, et al. Estimation of age-related DNA degradation from formalin-fixed and paraffin-embedded tissue according to the extraction methods. Exp Ther Med. 2017;14(3):2683–2688.
- Guyard A, Boyez A, Pujals A, et al. DNA degrades during storage in formalin-fixed and paraffin-embedded tissue blocks. Virchows Arch. 2017;471(4):491–500.
- Liu X, He H, Li Y, et al. The application of antigen receptor gene rearrangement of BIOMED-2 in the pathologic diagnosis of 348 cases with non-Hodgkin lymphoma in a single institution in Southwest of China. Pathol Res Pract. 2019;215(11):152615.
- Han S, Masaki A, Sakamoto Y, et al. Improved clonality detection in Hodgkin lymphoma using a semi-nested modification of the BIOMED-2 PCR assay for IGH and IGK rearrangements: a paraffin-embedded tissue study. Pathol Int. 2018;68(5):287–293.
- Zhang Y, Xu N, B. J D, et al. Diagnostic significance of BIOMED-2 standardized gene rearran-gement system in patients with non-hodgkin’s lymphoma. Zhongguo Shi Yan Xue Ye Xue Za Zhi. 2017;25(1):115–119.
- Krause JC, Ekiert DC, Tumpey TM, et al. An insertion mutation that distorts antibody binding site architecture enhances function of a human antibody. mBio. 2011;2(1):e310–e345.