
ABSTRACT
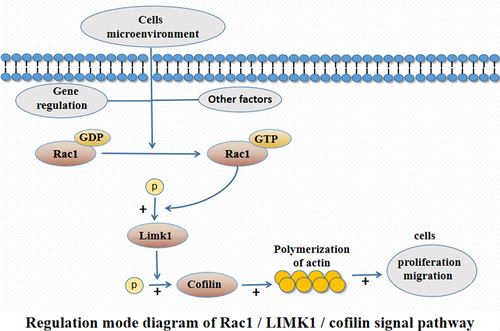
Rac1 can affect the migration of neural crest cells by regulating the polymerization of actin and the membrane formation process. But the role of the Rac1 signaling pathway in the pathogenesis of Hirschsprung’s disease (HSCR) remains unclear. In order to investigate the mechanism of the abnormal protein phosphorylation of Rac1, Lim-kinase 1 (Limk1) and Cofilin involved in the pathogenesis of HSCR. The protein phosphorylation levels of these proteins were detected by Western blot in 30 samples of HSCR narrow segment, 30 samples of transitional segment tissues, and 14 samples of normal intestinal tissues. Subsequently, in the SH-SY5Y human neuroblastoma cell line, a Rac1, Limk1, and Cofilin inhibitor group, a Rac1 overexpression group (PDGF-BB group), a Rac1 overexpression group + a Limk1 inhibitor group (P-B group), a Rac1 overexpression group + a Cofilin inhibitor group (P-C group) were established. The results showed that the expressions of p-Rac1, p-Limk1, and p-Cofilin in HSCR narrow segment and transitional segment were lower than those in normal intestine (p < 0.05). The expression levels of p-Rac1, p-Limk1, and p-Cofilin in the relative inhibitor group were significantly lower than those in the control group (p < 0.05), and the proliferation and migration levels in the control group and Rac1 overexpression group were significantly higher than those in the Rac1, Limk1, and Cofilin inhibitor group (p < 0.05). In conclusion, the decreased phosphorylation of the Rac1/Limk1/Cofilin signaling pathway in HSCR could inhibit the proliferation and migration of SH-SY5Y cells, and this might be associated with the pathogenesis of HSCR.
Graphical Abstract
Introduction
Hirschsprung’s disease (HSCR), also known as colonic aganglionosis, is one of the most common congenital structural abnormalities in children, but its specific pathogenesis remains unknown [Citation1]. It is believed that HSCR arises due to abnormalities in the embryonic period, differentiation, and colonization, but its specific regulatory mechanism is still not clear [Citation2,Citation3]. The diagnosis and treatment of HSCR are still limited to barium enema, anorectal manometry, and rectal mucosal biopsy [Citation4,Citation5], and sensitive genetic diagnosis and prenatal screening methods are lacking [Citation6]. Therefore, there is an urgent need to conduct more studies on the mechanisms leading to the proliferation, migration, and colonization of neural ridge cells, so that a more accurate, simpler, and faster method for the early diagnosis of HSCR can be found. This etiological perspective will allow for better diagnosis and treatment of children with HSCR.
Rac1, a member of the Rho guanosine triphosphate (GTP) family, is regarded as a ‘molecular switch’ in the signal transduction of various cells, and it is associated with the development of a variety of diseases. Studies have found that Rac1 can affect the migration of neural crest cells by regulating the polymerization of actin and the membrane formation process of neural crest cells [Citation7,Citation8]. Limk1 is a serine/threonine protein kinase component, and the phosphorylation of the upstream factor Rac1 can activate the phosphorylation of Limk1 and promote the expression and phosphorylation of Cofilin (the only downstream effector molecule), thus affecting the polymerization of actin and the migration ability of cells [Citation9]. However, there is still no research into how the Rac1 signaling pathway can affect the biological function of neural crest cells in the pathogenesis of HSCR. In order to further explore the mechanism of the Rac1 signaling pathway in the pathogenesis of HSCR, the expression levels of p-Rac1, p-Limk1, and p-Cofilin in narrow segment tissues and transitional segment tissues of HSCR tissue were detected, and the effect of regulating p-Rac1, p-Limk1, and p-Cofilin on the proliferation and migration of neural crest cells (SH-SY5Y) was evaluated to observe the effect of Rac1 signaling pathway and explore the key factors and regulatory network in the pathogenesis of HSCR.
Materials and methods
Materials
The following materials were used: the SH-SY5Y human neuroblastoma cell line (Shanghai Zhong Qiao Xin Zhou Biotechnology Co., Ltd., http://www.zqxzbio.com, sample No.: 20,161,116–02); Phospho-RAC1 (Ser71) antibody (Thermo Fisher); Phospho-Limk1-T508 Rabbit Polyclonal Antibody (pAb) (ABclonal); Phospho-Cofilin (Ser3) (77G2) Rabbit mAb (Cell Signaling Technology, USA), Goat Anti-Rabbit IgG (Abcam); Fetal Bovine Serum (FBS) (Gibco, USA); Cell Counting Kit-8 (CCK-8) (Shanghai Dongren Chemical Technology Co., Ltd.); a Transwell well plate (Corning, USA); Rac1 inhibitor (nsc23766); Rac1 agonist (PDGF-BB); Limk1 inhibitor (BMS-3); and Cofilin inhibitor (Cytochalasin D) (MCE).
Subjects
A total of 30 samples of narrow segment tissues and 30 cases of transitional segment tissues were selected from children undergoing surgical treatment after being pathologically diagnosed as having HSCR in the Pediatric General Thoracic and Urinary Surgery Department of the Affiliated Hospital of Zunyi Medical University between January 2018 and January 2021. Fourteen samples of normal intestinal tissues were taken from the intestinal canals of children without HSCR at the posterior fistula closure (all incarcerated hernia and intussusception fistula). This study was conducted in accordance with the Declaration of Helsinki and was approved by the Ethics Committee of the Affiliated Hospital of Zunyi Medical University (Ethics Review Approval No.: KLLY-2019-038).
The construction of cell models
SH-SY5Y cells were cultured under 37°C and 5% CO2 in DMEM medium supplemented with 10% FBS, 100 U/mL penicillin, and 100 μg/mL streptomycin [Citation10]. Cell models were constructed by the addition of inhibitors and agonists: a Rac1, Limk1, and Cofilin inhibitor group; a Rac1 overexpression group (the PDGF-BB group); a Rac1 overexpression group + a Limk1 inhibitor group (the P-B group); and a Rac1 overexpression group + a Cofilin inhibitor group (the P-C group).
Western blot assay
The assay was conducted following the steps of sample preparation (the extraction and quantification of proteins using radioimmunoprecipitation and bicinchoninic acid assays), electrophoresis, membrane transfer, sealing, primary antibody incubation, secondary antibody incubation, and development.
CCK-8 assay
Cells from the Rac1, Limk1, and Cofilin inhibitor group, the Rac1 overexpression group, the P-B group, and the P-C group were added to the 96-well plate (100 uL/well, 5,000 cells/well), and they were placed in a CO2 incubator for incubation. Ten microliters of CCK-8 reagent was added to each well 2 h before the assay. Then, the absorbance value of each well at 450 nm was measured using a microplate reader at 24 h, 48 h, 72 h, and 96 h [Citation11].
Transwell assay
Cells from the Rac1, Limk1, and Cofilin inhibitor group, the Rac1 overexpression group, the P-B group, and the P-C group were added to the upper chamber of the Transwell plate, and 20% FBS complete medium was added to the lower chamber. The cells were fixed in the tissue fix solution for 20 min, and then they were stained in the crystal violet staining solution for 5 min, after which they were sealed with neutral balsam. Finally, the number of cells is counted in five random visual fields (200×) [Citation12].
Statistical method
The experimental data were statistically analyzed using SPSS18.0 software and mapped using the GraphPad Prism 6. The measurement data were expressed as mean ± standard error (SEM), and for the measurement data of normal or near normal distribution, two independent sample t tests were used to compare the two groups of data. A one-way analysis of variance was used for the comparison between multiple groups of data, and a corrected threshold values or Tamhane’s T2 test was used in the case of heterogeneity of population variance.
Results
It has been found that the phosphorylated Rac1 can activate the phosphorylation of Limk1, which promotes the expression and phosphorylation of Cofilin, and finally affect the biological function of cells. Therefore, we here further explored the phosphorylation levels of Rac1, Limk1, and Cofilin in HSCR tissues, as well as the effect of regulating phosphorylation of Rac1, Limk1, and Cofilin on the biological function of neural crest cells and the pathogenesis of HSCR.
The expression of p-Rac1, p-Limk1, and p-Cofilin proteins in the HSCR narrow segment and transitional segment and the normal intestine canal
The protein expression levels of p-RAC1 and p-Cofilin were as follows: p-Rac1 0.39 ± 0.04 vs. 0.55 ± 0.05 vs. 1.08 ± 0.07 and p-Cofilin 0.39 ± 0.04 vs. 0.66 ± 0.06 vs. 1.43 ± 0.11, and the differences between the groups were statistically significant (F = 42.47 and 44.60, p < 0.05); the expression level of p-Limk1 protein in the HSCR narrow segment and transitional segment was significantly lower than that in the normal intestine canal (p-Limk1 0.33 ± 0.03 vs. 0.33 ± 0.03 vs. 1.15 ± 0.05), and the difference was statistically significant (F = 163.74, p < 0.05). However, there was no statistically significant difference between the narrow-segment and the transitional segment (p > 0.05) ().
Figure 1. Expression of p-RAC1, p-Limk1 and p-Cofilin proteins in HSCR narrow segment, transitional segment, and normal intestine canal.
The expression of p-Rac1, p-Limk1, and p-Cofilin proteins in the control group and the Rac1, Limk1, and Cofilin inhibitor group
The expression levels of p-Rac1, p-Limk1, and p-Cofilin in the Rac1, Limk1, and Cofilin inhibitor group were significantly lower than those in the control group (p-Rac1: 0.73 ± 0.06 vs. 1.16 ± 0.06; p-Limk1: 1.12 ± 0.10 vs. 0.36 ± 0.07; p-Cofilin: 1.36 ± 0.05 vs. 0.68 ± 0.06), and the differences were statistically significant (T = 5.17, 6.39, and 8.38, p < 0.05) ().
Figure 2. Relative expression levels of P-RAC1, P-Limk1 and P-Cofilin proteins in the control group and the Rac1, Limk1 and Cofilin inhibitor group.
Cell proliferation in the control group and the Rac1, Limk1, and Cofilin inhibitor group
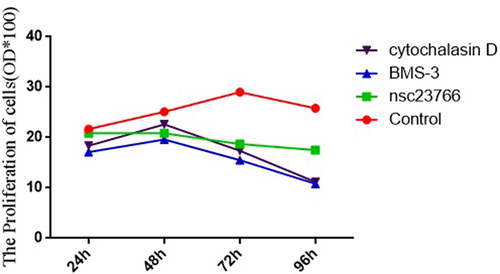
The absorbance values of the control group at 24 h, 48 h, 72 h, and 96 h were significantly higher than those of the Rac1, Limk1, and Cofilin inhibitor group (24 h: 21.68 ± 0.36 vs. 20.88 ± 0.23 vs. 17.13 ± 0.17 vs. 18.40 ± 0.21; 48 h: 25.12 ± 0.48 vs. 20.83 ± 0.71 vs. 19.60 ± 0.47 vs. 22.63 ± 0.47; 72 h: 27.70 ± 1.44 vs. 18.71 ± 0.26 vs. 15.50 ± 0.25 vs. 17.37 ± 0.41; and 96 h: 25.80 ± 0.43 vs. 21.48 ± 0.37 vs. 10.81 ± 0.16 vs. 11.18 ± 0.21), and the differences were statistically significant (F = 70.53, 19.54, 42.55, and 576.23, p < 0.05) ().
Figure 3. Absorbance values of the cells in the control group and the Rac1, Limk1, Cofilin inhibitor group.
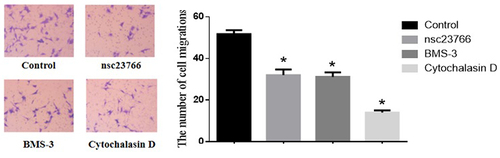
Cell migration in the control group and the Rac1, Limk1, and Cofilin inhibitor group
The amount of cell migration in the control group was significantly higher than that in the Rac1, Limk1, and Cofilin inhibitor group (51.77 ± 1.92 vs. 32.08 ± 2.67 vs. 31.15 ± 2.16 vs. 14.08 ± 1.07), and the difference was statistically significant (F = 57.18, p < 0.05) ().
Figure 4. Number of cell migrations in the control group and the Rac1, Limk1, and Cofilin inhibitor group.
The relative expression levels of p-Rac1, p-Limk1, and p-Cofilin proteins in the PDGF-BB group, control group, P-B group, and P-C group
The expression levels of p-Rac1, p-Limk1, and p-Cofilin proteins in the PDGF-BB group were significantly higher than those in the control group, the P-B group, and the P-C group (p-Rac1: 1.22 ± 0.09 vs. 0.84 ± 0.06 vs. 0.52 ± 0.08 vs. 0.49 ± 0.10; p-Limk1: 1.34 ± 0.08 vs. 0.50 ± 0.05 vs. 0.20 ± 0.03 vs. 0.28 ± 0.07; and p-Cofilin: 1.25 ± 0.09 vs. 0.70 ± 0.08 vs. 0.66 ± 0.06 vs. 0.60 ± 0.07), and the differences were statistically significant (F = 16.82, 68.53, and 17.21, p < 0.05) ().
Figure 5. Relative expression levels of p-Rac1, p-Limk1 and p-Cofilin proteins in the control group, PDGF-BB group, P-B group and P-C group.

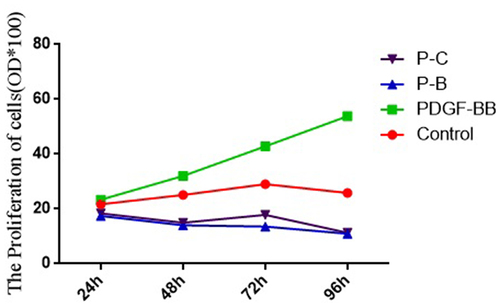
Cell proliferation in the PDGF-BB group, control group, P-B group, and P-C group
The absorbance values of cells in the PDGF-BB group at 24 h, 48 h, 72 h, and 96 h were significantly higher than those in the control group, P-B group, and P-C group (24 h: 23.37 ± 0.35 vs. 21.68 ± 0.36 vs. 17.43 ± 0.22 ± vs. 18.35 ± 0.22; 48 h: 32.03 ± 1.01 vs. 25.11 ± 0.48 vs. 14.03 ± 0.16 vs. 14.95 ± 0.21; 72 h: 42.81 ± 1.62 vs. 29.00 ± 0.74 vs. 13.75 ± 0.26 vs. 17.80 ± 1.13; and 96 h: 53.83 ± 1.95 vs. 25.80 ± 0.43 vs. 10.98 ± 0.08 vs. 11.27 ± 0.10), with the differences being statistically significant (F = 90.24, 222.07, 151.64, and 405.62, p < 0.05) ().
Figure 6. Absorbance values of the PDGF-BB group, control group, P-B group and P-C group.
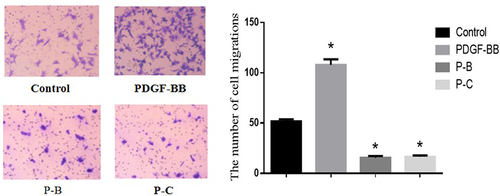
Cell migration in the control group, PDGF-BB group, P-B group, and P-C group
The amount of cell migration in the PDGF-BB group was significantly higher than that in the control group, P-B group, and P-C group (107.93 ± 5.54 vs. 51.77 ± 1.92 vs. 15.57 ± 1.75 vs. 16.54 ± 1.31), with the difference being statistically significant (F = 176.64, p < 0.05) ().
Figure 7. Number of cell migrations in the control group, PDGF-BB group, P-B group and P-C group.
Discussion
As one of the most common congenital intestinal structural malformations in children, HSCR has an incidence rate of about 1/5000 [Citation13]. Although its exact cause remains unknown, it is generally considered to be connected with the halt of the development of neural crest cells in the ectoderm. Between weeks 5–12 of the embryonic period, the neuroblasts of neural crest cells migrate to the wall of the digestive tract from head to tail, forming ganglia cells and glial cells and eventually contributing to the formation of intermuscular plexus and submucosal plexus [Citation14]; the developmental disorder of neural crest cells before the 12th week of the embryonic period can lead to the decrease or absence of intestinal ganglion cells, resulting in the developmental disorder of the enteric nervous system [Citation15], which will lead to the occurrence of HSCR. Nevertheless, HSCR is a very complex disease, and it is considered to be the result of the joint action of gene polymorphism and the environment [Citation16]. Although some susceptibility genes related to the incidence of HSCR have been identified, such as RET, GDNF, END3, NRTN, and SOX10, only certain cases can currently be explained, and there are a large number of factors associated with the incidence of HSCR that still have to be determined [Citation17,Citation18]. Therefore, there is still a long way to go in investigating the etiology and pathogenesis of HSCR.
Protein phosphorylation refers to the transfer of adenosine triphosphate groups to the amino acid residues of proteins through the action of protein kinases or the binding to GTP via signaling, and it is one of the most common regulatory modes in vivo [Citation19]. Abnormal protein phosphorylation can lead to the abnormal migration and proliferation of cells [Citation20,Citation21]. In HSCR studies, some scholars have found the abnormal phosphorylation of RET, ERK, and other proteins in HSCR [Citation22,Citation23], indicating the presence of abnormal protein phosphorylation in the pathogenesis of HSCR, but there are few related literature reports.
Rac1, a member of the RAC subfamily of the Rho family, is one of the small G proteins of the Rho family. Rac1 is involved in GTP enzyme activity, and the basic biological role of this activity is binding and hydrolyzing guanylate. In other words, it plays the biological role of binding with GTP through phosphorylation [Citation24–26], and it is considered to be a ‘molecular switch’ in the signal transduction process of various cells, participating in cell migration, proliferation, and other processes [Citation27,Citation28]. Rac1 phosphorylation can promote the expression and phosphorylation of Limk1 and Cofilin, thereby affecting the rearrangement of cytoskeleton and promoting cell migration and invasion [Citation29]. It has been found in recent studies that abnormal Rac1 activity is associated with a variety of disorders in neural crest development, such as cardiac outflow tract formation defects, melanoma, and neuroblastoma [Citation30,Citation31]. Moreover, Goto et al. [Citation32] found that Rac1 was involved in the migration of mouse intestinal neural crest cells, and Limk1 was a component of serine/threonine protein kinase. It was seen that the phosphorylation of upstream factor Rac l could activate the phosphorylation of Limk1 and promote the expression and phosphorylation of Cofilin (the only downstream effector molecule), thus affecting the polymerization of actin and cell migration ability. However, it has not been possible to determine how the Rac1/Limk1/Cofilin signaling pathway is involved in the pathogenesis of HSCR.
This study demonstrated that the phosphorylation level of the Rac1/Limk1/Cofilin signaling pathway was decreased in both the narrow segment and the transitional segment of HSCR children, and the expression levels of p-Rac1 and p-Cofilin in the narrow segment and the transitional segment were significantly different. The inhibition of the phosphorylation of Rac1, Limk1, and Cofilin could result in the reduced migration and proliferation of SH-SY5Y cells, and the phosphorylation level of the Rac1/Link1/Cofilin signaling pathway, as well as cell proliferation and migration, could be promoted by PDGF-BB. It is therefore concluded that the increased phosphorylation level of the Rac1/Limk1/Cofilin signaling pathway could either promote or inhibit the migration and proliferation of neural crest cells, which might be associated with the pathogenesis of HSCR.
Although the results of this study suggest that the abnormal phosphorylation level of Rac1 signaling pathway proteins might be associated with the pathogenesis of HSCR, further validation should be conducted in normal neural crest cells and animal models. In addition, the establishment of stable and highly repeatable cell and animal models suitable for HSCR studies is still an open question. Although human neuroblastoma SH-SY5Y cells, which have physiological functions similar to neural crest cells, are currently the most widely studied cell replacement model for HSCR in vitro, they still cannot completely simulate the physiological conditions of neural crest cells in vivo or accurately reflect the pathogenesis of the disease. Therefore, the regulatory mechanism of the Rac1 signaling pathway in the pathogenesis of HSCR needs further investigation.
Conclusion
In summary, the results of this study indicated that the abnormal phosphorylation of Rac1/Limk1/Cofilin signaling pathway can lead to the proliferation and migration impairment of neural crest cells, which may be related to the pathogenesis of HSCR.
Highlights
1. P-Rac1, p-Limk1, and p-Cofilin were decreased in HSCR narrow segment and transitional segment compared to those in normal intestine.
2. Inhibiting levels of p-Rac1, p-Limk1, and p-Cofilin suppressed the proliferation and migration in the SH-SY5Y human neuroblastoma cell line.
3. The upregulated proliferation and migration of SH-SY5Y cells induced by the Rac1 agonist could be suppressed by the inhibitors of Limk1, and Cofilin.
Disclosure statement
No potential conflict of interest was reported by the author(s).
Additional information
Funding
References
- Tilghman JM, Ling AY, Turner TN, et al. Molecular genetic anatomy and risk profile of Hirschsprung’s disease. N Engl J Med. 2019;380:1421–1432.
- Luzón-Toro B, Villalba-Benito L, Torroglosa A, et al. What is new about the genetic background of Hirschsprung disease? Clin Genet. 2020;97:114–124.
- Nagy N, Goldstein AM. Enteric nervous system development: a crest cell’s journey from neural tube to colon. Semin Cell Dev Biol. 2017;66:94–106.
- Meinds RJ, van der Steeg AFW, Sloots CEJ, et al. Long-term functional outcomes and quality of life in patients with Hirschsprung’s disease. Br J Surg. 2019;106(4):499–507.
- Drissi F, Meurette G, Baayen C, et al. Long-term outcome of Hirschsprung disease: impact on quality of life and social condition at adult age. Dis Colon Rectum. 2019;62(6):727–732.
- Wang XJ, Camilleri M. Hirschsprung disease: insights on genes, penetrance, and prenatal diagnosis. Neurogastroenterol Motil. 2019;31(11):e13732.
- Al-Koussa H, Atat OE, Jaafar L, et al. The role of Rho GTPases in motility and invasion of glioblastoma cells. Analytical Cellular Pathology (Amsterdam). 2020;2020:9274016.
- Ungefroren H, Witte D, Lehnert H. The role of small GTPases of the Rho/Rac family in TGF-β-induced EMT and cell motility in cancer. Dev Dyn. 2018;247:451–461.
- Tang M, Li H, Zhou GM, et al. Rhein inhibits the movement and invasion of human ovarian carcinoma cells through Rac1/LIMK1/cofilin signaling pathway. Chin Pharmacol Bull. 2016;32:366–372. In Chinese.
- Zhi Z, Zhu H, Lv X, et al. IGF2-derived miR-483-3p associated with Hirschsprung’s disease by targeting FHL1. J Cell Mol Med. 2018;22:4913–4921.
- Wang S, Xia B, Qiao Z, et al. Tetramethylpyrazine attenuated bupivacaine-induced neurotoxicity in SH-SY5Y cells through regulating apoptosis, autophagy and oxidative damage. Drug Des Devel Ther. 2019;13:1187–1196.
- Chen G, Du C, Shen Z, et al. MicroRNA-939 inhibits cell proliferation via targeting LRSAM1 in Hirschsprung’s disease. Aging (Albany NY). 2017;9:2471–2479.
- Zheng L, Liu YM. Research advances of DNA methylation in Hirschsprung’s disease. Chin J Pediatr Surg. 2021;42:87–91. In Chinese.
- Klein M, Varga I. Hirschsprung’s disease-recent understanding of embryonic aspects, etiopathogenesis and future treatment avenues. Medicina (Kaunas). 2020;56:611.
- Lake JI, Heuckeroth RO. Enteric nervous system development: migration, differentiation, and disease. Am J Physiol Gastrointest Liver Physiol. 2013;305(1):G1–24.
- Peng XN, Shen C. Advances in transcriptomics of Hirschsprung’s disease. Chin J Pediatr Surg. 2019;40:567–573. In Chinese.
- Tian J, Zeng C, Tian Z, et al. Downregulation of protein tyrosine phosphatase receptor type R accounts for the progression of Hirschsprung disease. Front Mol Neurosci. 2019;12:92.
- Huang L, Liu YM. Research progress on signal pathways relevant to Hirschsprung’s disease. Chin J Appl Clin Pediatr. 2018;33:957–959. In Chinese.
- Huang B, Liu Y, Yao H, et al. NMR-based investigation into protein phosphorylation. Int J Biol Macromol. 2020;145:53–63.
- Zhang X, Flores LR, Keeling MC, et al. Ezrin phosphorylation at T567 modulates cell migration, mechanical properties, and cytoskeletal organization. Int J Mol Sci. 2020;21:435.
- Zhang J, Li L, Zhang Q, et al. Microtubule-associated protein 4 phosphorylation regulates epidermal keratinocyte migration and proliferation. Int J Biol Sci. 2019;15:1962–1976.
- Sribudiani Y, Chauhan RK, Alves MM, et al. Identification of variants in RET and IHH pathway members in a large family with history of Hirschsprung disease. Gastroenterology. 2018;155:118–129.e6.
- Ohgami N, Iizuka A, Hirai H, et al. Loss-of-function mutation of c-Ret causes cerebellar hypoplasia in mice with Hirschsprung disease and Down’s syndrome. J Biol Chem. 2021;296:100389.
- Marei H, Malliri A. GEFs: dual regulation of Rac1 signaling. Small GTPases. 2017;8(2):90–99.
- Abdrabou A, Wang Z. Post-translational modification and subcellular distribution of Rac1: an update. Cells. 2018;7(12):263.
- Espinosa-Medina I, Jevans B, Boismoreau F, et al. Dual origin of enteric neurons in vagal Schwann cell precursors and the sympathetic neural crest. Proc Natl Acad Sci U S A. 2017;114(45):11980–11985.
- Marei H, Malliri A. Rac1 in human diseases: the therapeutic potential of targeting Rac1 signaling regulatory mechanisms. Small GTPases. 2017;8(3):139–163.
- Nguyen LK, Kholodenko BN, von Kriegsheim A. Rac1 and RhoA: networks, loops and bistability. Small GTPases. 2018;9(4):316–321.
- Frendo ME, da Silva A, Phan KD, et al. The Cofilin/Limk1 pathway controls the growth rate of both developing and regenerating motor axons. J Neurosci. 2019;39(47):9316–9327.
- Peng D, Dong J, Zhao Y, et al. <p>miR-142-3p suppresses uveal melanoma by targeting CDC25C, TGFβR1, GNAQ, WASL, and RAC1. Cancer Manag Res. 2019;11:4729–4742.
- Etchevers HC, Dupin E, Le Douarin NM. The diverse neural crest: from embryology to human pathology. Development. 2019;146(5):dev169821.
- Goto A, Sumiyama K, Kamioka Y, et al. GDNF and endothelin 3 regulate migration of enteric neural crest-derived cells via protein kinase A and Rac1. J Neurosci. 2013;33(11):4901–4912.