ABSTRACT
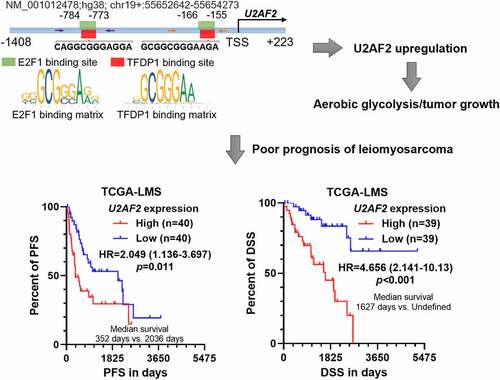
The dysregulation of U2 Small Nuclear RNA Auxiliary Factor 2 (U2AF2) is associated with malignant behaviors of multiple types of tumors. In this study, we explored the association between U2AF2 dysregulation and the survival of patients with primary leiomyosarcoma, the regulatory effect of U2AF2 on cell growth/aerobic glycolysis, and the mechanisms of U2AF2 dysregulation at the transcriptional level. Gene expression and survival time of patients with primary leiomyosarcoma were extracted from TCGA-Sarcoma (SARC). Leiomyosarcoma cell lines SK-LMS-1 and SK-UT-1 were utilized to construct in vitro and in vivo models. Results showed that the higher U2AF2 expression group had significantly shorter progression-free survival (HR: 2.049, 95%CI: 1.136–3.697, p = 0.011) and disease-specific survival (4.656, 95%CI: 2.141–10.13, p < 0.001) compared to the lower U2AF2 expression group. U2AF2 knockdown suppressed leiomyosarcoma cell growth and aerobic glycolysis (decreased glucose uptake, lactate production, and extracellular acidification rate) in vitro. Tumors derived from SK-LMS-1 cells with U2AF2 knockdown grew significantly slower, with lower GLUT1, PGK1, and PGAM1 protein expression than the control groups. TFDP1 and E2F1 could interact with each other in leiomyosarcoma cells. Both TFDP1 and E2F1 could bind to the promoter of U2AF2 and exert a synergistic activating effect on U2AF2 transcription. In conclusion, this study revealed that U2AF2 upregulation is associated with poor survival of leiomyosarcoma. Its upregulation enhances proliferation and aerobic glycolysis of leiomyosarcoma cells in vitro and in vivo. TFDP1 and E2F1 can form a complex, which binds to the U2AF2 gene promoter and synergistically activates its transcription.
Graphical Abstract
Highlights
Leiomyosarcoma patients with high U2AF2 expression have a poor prognosis.
U2AF2 enhances cell proliferation and aerobic glycolysis in leiomyosarcoma cells.
U2AF2 knockdown impairs leiomyosarcoma cell growth in vivo.
The TFDP1/E2F1 complex enhances U2AF2 transcription via promoter binding.
Introduction
Soft tissue sarcomas (STS) is a group of malignant mesenchymal neoplasms with a broad spectrum of biologic behaviors and clinical heterogeneity [Citation1–3]. Leiomyosarcoma, which arises from smooth muscle cells, comprises approximately 10% to 20% of all newly diagnosed STS [Citation4]. This tumor has a high rate of recurrence and metastasis [Citation4]. However, due to limited understanding of the molecular mechanisms of this disease, no targeted therapy is available. Currently, the most effective treatment strategy is still surgical resection (for patients with localized tumors), in combination with a multimodal approach of chemo- and radio-therapy [Citation4].
U2 Small Nuclear RNA Auxiliary Factor 2 (U2AF2), also called U2AF65 is a non-small nuclear ribonucleoprotein (snRNP) required for the binding of U2 snRNP to the pre-mRNA branch site [Citation5]. It supports pre-mRNA splicing, exon inclusion, and 3’-end processing via recruiting other factors or complexes to the RNA polymerase II [Citation5,Citation6]. Recent studies revealed that its dysregulation was associated with malignant behaviors of multiple types of tumors. In glioma stem cells, U2AF2 binds to circRNA ARF1 (cARF1) and enhances its stability and expression [Citation7]. Then, cARF1 sponges miR-342-3p and increases ISL LIM Homeobox 2 (ISL2) expression, leading to enhanced angiogenesis [Citation7]. In melanoma, U2AF2 upregulation can enhance CD44v8-10 alternative splicing, supporting melanoma migration in vitro and lung and liver metastasis in vivo [Citation8]. In non-small cell lung cancer, U2AF2, which is stabilized by OTU Deubiquitinase, Ubiquitin Aldehyde Binding 2 (OTUB2), can increase the expression of multiple critical proteins in aerobic glycolysis [Citation9]. Therefore, U2AF2 upregulation contributes to enhanced Warburg effect and tumor progression [Citation9]. Suppressing the Warburg effect by melatonin can significantly inhibit sarcoma tumor growth and invasion [Citation10,Citation11]. Our preliminary screening found an association between U2AF2 upregulation and poor survivals of patients with primary leiomyosarcoma, using data from the Cancer Genome Atlas (TCGA).
We hypothesized that U2AF2 might have tumor-promoting effects in leiomyosarcoma. Therefore, by utilizing SK-LMS-1 and SK-UT-1 cells, we aimed to investigate the regulatory effect of U2AF2 on cell growth and aerobic glycolysis in vitro and in vivo. The mechanisms of U2AF2 dysregulation at the transcriptional level were also studied.
Materials and methods
Bioinformatic analysis
Gene expression data and survival time of patients with primary leiomyosarcoma were extracted from TCGA-Sarcoma (SARC). Kaplan–Meier survival analysis was performed between the cases with high and low gene expression via using median expression as the cutoff value. U2AF2 promoter (HPRM32044, NM_001012478) information was obtained from GeneCopoeia (Supplementary Figure 1). The binding sites of TFDP1 and E2F1 in the promoter of U2AF2 were scanned using JASPAR 2022 (https://jaspar.genereg.net/) [Citation12].
IHC staining
Commercial sarcoma tissue microarrays were purchased from Taibosi Bio (Xian, China). The microarrays were stained using a BOND-III Automated IHC Stainer for Immunostaining (Leica, Wetzlar, Germany), with anti-U2AF2 purchased from Proteintech (15,624-1-AP, Wuhan, China). Only the leiomyosarcoma cases (n = 18) in the microarray were extracted for analysis. IHC staining was scored using the criteria proposed by The Human Protein Atlas [Citation13], in which staining is scored by combining staining intensity (negative, weak, moderate or strong) and the fraction of stained cells (<25%, 25–75% or >75%).
Cell culture and treatment
Leiomyosarcoma cell lines SK-LMS-1 (derived from leiomyosarcoma in vulva) and SK-UT-1 (a human uterine leiomyosarcoma cell line) were purchased from American Type Culture Collection (ATCC, Manassas, VA, USA). They were cultured following the methods introduced previously [Citation14]. Lentiviral shRNAs were generated using the pLKO.1-puro plasmid, with the following shRNA sequence: shU2AF2#1, 5’- CCTTTGACCAGAGGCGCTAAA-3’; shU2AF2#2, 5’- CGACGAGGAGTATGAGGAGAT-3’; shE2F1#1, 5’-ACATCACCAACGTCCTTGAG-3’; shE2F1#2, 5’- CTACTCAGCCTGGAGCAAGAA-3’; shTFDP1#1, 5’- GACGATGACTTCAACGAGAAT-3’; shTFDP1#2, 5’-CCTACGGCATTTCTCCATGAA-3’. Lentiviruses were produced in packaging cells (HEK293T) by transfecting with psPAX2 packaging plasmid and pMD2.G envelope plasmid, following the protocols introduced previously [Citation15]. Cells were infected with 6 μg/ml polybrene.
qRT-PCR
Total RNA samples were extracted using RNeasy Mini Kit (Qiagen, Hilden, Germany). cDNA was then synthesized using the PrimeScript RT Reagent Kit (TaKaRa, Dalian, China) following the manufacturer’s protocol. Real-time polymerase-chain reaction (qPCR) was conducted using SYBR Premix Ex Taq II kit (TaKaRa), on a 7900HT Fast Real-Time PCR System (Thermo Fisher Scientific, Waltham, MA, USA). ACTB was used as the internal control. 2−ΔΔCt method was used to calculate relative gene expression [Citation16]. The primers are as follows: U2AF2, F: 5'-TACGGGCTTGTCAAGTCCATCG-3', R: 5'-CTGGCAGTCAAACACAGAGGTG-3’; E2F1, F: 5'-GGACCTGGAAACTGACCATCAG-3', R: 5'-CAGTGAGGTCTCATAGCGTGAC-3’; TFDP1, F: 5'- CACTTTGCCTCTCAGAACCAGC-3', R: 5'- CTTTCCTCTGCACCTTCTCGCA-3’; ACTB, F: 5'-CACCATTGGCAATGAGCGGTTC-3', R: 5'-AGGTCTTTGCGGATGTCCACGT-3'.
Western blotting and co-immunoprecipitation (IP)
Western blot was conducted following the methods introduced previously [Citation17]. Total proteins were extracted using radioimmunoprecipitation (RIPA) lysis buffer (Beyotime, Shanghai, China) with cOmplete Protease Inhibitor Cocktail (MilliporeSigma, Burlington, MA, USA). The concentration of protein samples was determined using a bicinchoninic acid assay (BCA) protein assay kit (Beyotime). Then, 30 μg protein/sample was added to one lane and separated by sodium dodecyl sulfate-polyacrylamide gel electrophoresis (SDS-PAGE). After separation, the proteins were transferred to nitrocellulose (NC) membranes, blocked in 5% skimmed milk and incubated with primary antibodies at 4°C overnight. The membranes were washed and incubated with horseradish peroxidase (HRP)-conjugated secondary antibody at room temperature for 1 h. Protein signals were developed using an enhanced chemiluminescence kit (BeyoECL Star, Beyotime), with ChemiScope 6200 T Machine (Clinx Science Instruments, Shanghai, China). The primary antibodies used include: anti-U2AF2 (1:1000, 15,624-1-AP, Proteintech), anti-GLUT1 (1: 2000, 66,290-1-Ig, Proteintech), anti-HK2 (1: 5000, 22,029-1-AP, Proteintech), anti-PGK1 (1: 1000, 17,811-1-AP, Proteintech), anti-PGAM1 (1: 2000, 16,126-1-AP, Proteintech), anti-TFDP1 (1:1000, sc-70,989, Santa Cruz Biotechnology, Dallas, TX, USA), anti-E2F1 (1:1000, M00257, Boster, Beijing, China). and anti-β-actin (1: 2000, 20,536-1-AP, Proteintech).
For co-IP assay, mouse anti-TFDP1 (1:100, sc-70,989, Santa Cruz Biotechnology) or rabbit anti-E2F1 (1:50, M00257, Boster) was added to 400 μl lysate (1 μg/ml) of SK-LMS-1 and SK-UT-1 cells. IgG served as a negative control. The mixtures were gently rocked at 4°C overnight. Then, 40 μl Protein G agarose beads were added and gently rocked at 4°C for 1 h. Then, the samples were centrifuged, washed, and eluted. The eluted samples were subjected to western blotting assays.
Cell viability and clonogenic assays
Cell viability was measured by CCK-8 assay, using a CCK-8 from Beyotime (Shanghai, China) [Citation18]. Briefly, cells with or without U2AF2 knockdown were seeded in 96-well plates with 2000 cells/well and cultured for 24, 48, 72 h. At each time point, 10 μl/well CCK8 solution were added into cells and incubated at 37°C for 2 h. Absorbance at 450 nm was measured using a Tecan SPARK multimode microplate reader.
For clonogenic assays, 200 cells with or without U2AF2 knockdown were seeded into 24-well plate. The culture medium was replaced every 3 days until colonies were visible approximately 10 days later. Then, colonies were fixed with 4% paraformaldehyde and stained with 0.5% crystal violet solution. The numbers of colonies were counted manually.
Measurement of glucose uptake and lactate production
Glucose uptake and lactate production were measured using Glucose Uptake Assay Kit (Colorimetric) (ab136955, Abcam, Cambridge, UK) and L-Lactate Assay Kit (Colorimetric) (ab65331, Abcam), respectively, according to the manufacturer’s instructions and previous methods [Citation19].
Measurement of extracellular acidification rate (ECAR)
ECAR was measured using the Agilent Seahorse XF Glycolysis Stress Test Kit, 103,020–100, Agilent Technologies, Santa Clara, CA, USA) and the Seahorse XF96 Extracellular Flux Analyzer (Agilent Technologies), following the manufacturer’s instructions [Citation20]. Cells were plated in XF96 Cell Culture Microplates (Seahorse Bioscience) at a density of 2 × 10⁴ cells/well the day before measurement. Cells were incubated with non-buffered culture medium under basal conditions followed by sequential injection of Glucose (10 mM), Oligomycin (1 μM), and 2-DG (50 mM), at indicated time points. Each test was repeated three times with five replicates each time.
Xenograft tumor models
Animal studies were approved by the Institutional Animal Care and Use Committee (IACUC) of Southwest Medical University, China. Five-week-old BALB/c-nu/nu nude female mice were purchased from Vital River (Beijing, China). All mice were maintained in specific-pathogen-free (SPF) conditions. SK-LMS-1 cells with or without U2AF2 knockdown (5 × 10⁶) were suspended in 200 μl of PBS/Matrigel (Corning) (1:1) and then subcutaneously inoculated into the flank of each mouse (n = 6 per group). The tumor-bearing mice were sacrificed 28 days after inoculation, and the tumors were removed and weighted. Tumors were further sectioned for IHC staining of Ki-67 and used for western blotting assays.
Immunofluorescent (IF) staining
Cells were plated on coverslips. When cells reached about 50% confluence, they were fixed with 4% paraformaldehyde, permeabilized with 0.1% Triton X-100. The permeabilized cells were stained with mouse anti-TFDP1 (1:100, sc-70,989, Santa Cruz Biotechnology) or rabbit anti-E2F1 (1:200, M00257, Boster) overnight at 4°C. The coverslips were thoroughly washed and the primary antibodies were detected with Dylight 488-conjugated anti-rabbit IgG and Dylight 549-conjugated anti-mouse IgG secondary antibodies. Nuclei were stained with DAPI. Coverslips on slides were observed using a fluorescence microscope (BX63, Olympus, Tokyo, Japan) [Citation21].
Dual-luciferase assay
The full-length of U2AF2 promoter segments were PCR amplified from the U2AF2 promoter clone (HPRM32044) and then inserted into the sites between KpnI and pGL3-basic plasmids. The recombinant luciferase reporter plasmid is named pGL3-U2AF2-promoter-WT. SK-LMS-1 cells with E2F1 or TFDP1 knockdown alone or in combination were seeded into 48-well plates at a density of 3 × 10⁴ cells/well and allowed to settle for 24 h. Then, 0.3 μg of pGL3-U2AF2-promoter-WT reporter plasmid, or the control-luciferase plasmid, plus 30 ng of phRG-TK plasmid were transfected into cells using the Lipofectamine 3000 reagent (Thermo Fisher Scientific), according to the manufacturer’s protocol. 24 h later, luciferase and renilla luciferase activities were measured using the Dual-Luciferase Reporter Assay System (Promega, Madison, WI, USA) [Citation22].
Chromatin immunoprecipitation (ChIP)-qPCR assay
ChIP was performed using the ChIP Assay Kit (Beyotime) according to the manufacturer’s instructions and previous protocols [Citation23]. The chromatin complexes were immunoprecipitated using anti-E2F1 (66,515-1-Ig, Proteintech), anti-TFDP1 (sc-70,989, Santa Cruz Biotechnology) antibody or normal rabbit IgG. Then, the immunoprecipitated DNA samples were purified and were used for qPCR assay, with the following primers: primer set 1, F: 5'-CTTGGCCTCAGCCTCTTC-3', R: 5'-GGGCTAATTACACCGTATCCTAC-3'; primer set 2, F: 5'-GGCAGTAACGCCAGATCAT-3', R: 5'-CCACCCTCTTGGTTGTCTC-3'.
Statistical analysis
Data are presented as the mean ± SD from three independent experiments of at least three technical repeats. Statistical analysis was conducted using GraphPad Prism 8.10 . The difference in survival curves was compared by using the log-rank test. Statistical differences between two groups were conducted by Welch’s unpaired t-test [Citation24]. Correlation analysis was performed by calculating Pearson’s correlation coefficients. Values of p < 0.05 were considered statistically significant.
Results
This study aimed to explore the biological regulation of U2AF2 in leiomyosarcoma and the transcriptional mechanisms regulating its expression. We hypothesized that U2AF2 might have tumor-promoting effects in leiomyosarcoma. The following findings demonstrated that U2AF2 upregulation enhances the proliferation and aerobic glycolysis of leiomyosarcoma cells in vitro and in vivo. TFDP1 and E2F1 can form a complex, which binds to the U2AF2 promoter and synergistically activates its transcription.
Leiomyosarcoma patients with high U2AF2 expression have a poor prognosis
By combining RNA-seq and survival data in the leiomyosarcoma subset of TCGA-SARC, we assessed the association between U2AF2 expression and the prognosis of patients with leiomyosarcoma. Since both uterine leiomyosarcoma (ULMS) and soft tissue leiomyosarcoma (STLMS) were included in the database, we compared U2AF2 expression between these two subtypes (). No significant difference was observed between them (). Therefore, all 80 leiomyosarcoma cases were treated as a whole group for survival analysis.
Figure 1. Leiomyosarcoma patients with high U2AF2 expression have a poor prognosis A. Comparison of U2AF2 mRNA expression between ULMS and STLMS cases in TCGA. B-C. K-M survival analysis was performed to explore the differences in PFS (b) and DSS (c) in leiomyosarcoma patients with high or low U2AF2 expression. D. Representative images of IHC staining was provided to show the expression and distribution of U2AF2 in leiomyosarcoma. Phosphate-buffered solution (PBS) (with primary anti-U2AF2) served as the negative control. E. Statistical summary of IHC staining results in 18 cases of primary leiomyosarcoma.
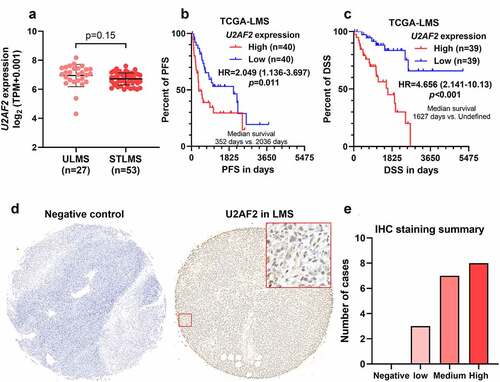
Kaplan–Meier (K-M) survival curves, including progression-free survival (PFS) and disease-specific survival (DSS) were generated between patients with high (top 50%) and low (bottom 50%) U2AF2 expression. Log-rank test indicated that the high U2AF2 expression group had significantly shorter PFS (HR: 2.049, 95%CI: 1.136–3.697, p = 0.011) and DSS (4.656, 95%CI: 2.141–10.13, p < 0.001) (). IHC staining confirmed U2AF2 protein expression in primary leiomyosarcoma tissues, mainly in the nucleus (). Medium to high U2AF2 expression was observed in 15/18 cases (). The pathology diagnosis and the stage of tumors in the tissue microarray were provided in Supplementary Table 1.
U2AF2 contributes to enhanced cell proliferation and aerobic glycolysis in leiomyosarcoma cells in vitro
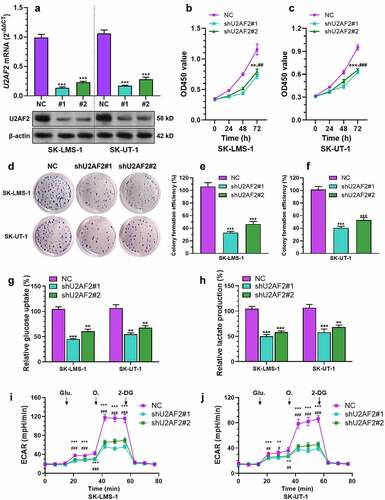
Since U2AF2 has been verified as a regulator of aerobic glycolysis in cancer [Citation9], we explored its regulation on leiomyosarcoma cell growth and energy metabolism. Both SK-LMS-1 and SK-UT-1 cells were infected by lentiviral shU2AF2 (). CCK-8 and colony formation assays showed that U2AF2 knockdown significantly suppressed tumor cell proliferation and colony formation (). In addition, U2AF2 knockdown also remarkedly decreased glucose uptake (), lactate production () and ECAR () of SK-LMS-1 and SK-UT-1 cells.
Figure 2. U2AF2 contributes to enhanced cell proliferation and aerobic glycolysis in leiomyosarcoma cells in vitro A-B. QRT-PCR analysis (a) and western blotting assays were conducted to detect the expression of U2AF2 at the mRNA and protein levels in SK-LMS-1 and SK-UT-1 cells 48 h after lentiviral mediated U2AF2 knockdown (n = 3). B-F. CCK-8 assay was performed to measure cell viability (b-c) and colony formation assay was conducted to assess colony formation capability (d-f) of SK-LMS-1 and SK-UT-1 cells with or without U2AF2 knockdown (n = 3). G-H. Glucose uptake (g) and lactate production (h) were measured in SK-LMS-1 and SK-UT-1 cells with or without U2AF2 knockdown by colorimetric analysis (n = 3). I-J. ECAR was measured in SK-LMS-1 and SK-UT-1 cells with or without U2AF2 knockdown (n = 5). Glu.: glucose; O.: Oligomycin. Data represent the mean ± SD. * comparison between NC and shU2AF1#1, #comparison between NC and shU2AF1#2; *p < 0.05, ## and **p < 0.01, ### and ***p < 0.001.
U2AF2 knockdown impairs leiomyosarcoma cell growth in vivo
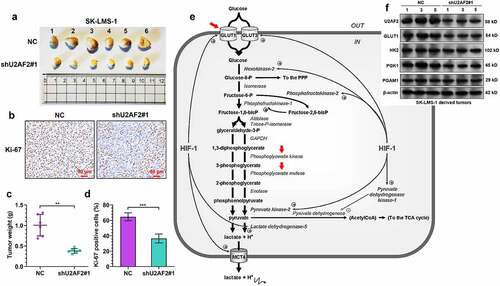
To explore whether U2AF2 modulates leiomyosarcoma cell growth in vivo, we generated xenograft tumor models using SK-LMS-1 cells with or without U2AF2 knockdown. Tumors derived from SK-LMS-1 cells with U2AF2 knockdown grew significantly slower than the control group (). IHC staining confirmed a substantially smaller proportion of Ki-67 positive cells in the U2AF2 knockdown group than the NC group (). One previous study found that U2AF2 knockdown can significantly reduce the expression of GLUT1, PGK1, and PGAM1 but could not influence the expression of other enzymes, including HK2, GPI, ALDO, GAPDH, ENO1, PKM2, or LDHA [Citation9]. Using the aerobic glycolytic flow chart from one previous publication [Citation25], we marked the three transporters or enzymes (GLUT1, PGK1, and PGAM1) that could be modulated by U2AF2 (red arrows, ). The SK-LMS-1 derived tumors in panel A (samples 1, 3, and 5 in both NC and shU2AF2#1 groups) were subjected to western blot assay. Results showed that U2AF2 shRNA significantly decreased GLUT1, PGK1, and PGAM1 protein expression in the NC group (). However, no alteration in HK2 expression was observed ().
Figure 3. U2AF2 knockdown impairs leiomyosarcoma cell growth in vivo A. The xenograft tumors formed by U2AF2 knockdown (shU2AF2#1) or control vector (NC) SK-LMS-1 cells in nude mice models. B. The weight of the xenograft tumors in panel A. C-D. Representative images (c) and quantitation of Ki-67 positive tumor cells (d) in the xenograft tumors formed by SK-LMS-1 cells with or without U2AF2 knockdown. E. Schematic diagram of the aerobic glycolysis pathway. The enzymes and transporters that might be modulated by U2AF2 were marked by red arrows. F. Western blotting assays were conducted to detect the expression of U2AF2, GLUT1, HK2, PGK1, and PGAM1 in representative tumors (no. 1, 3 and 5 in panel A) formed by SK-LMS-1 cells with or without U2AF2 knockdown. **p < 0.01, ***p < 0.001.
Bioinformatic analysis predicted a TFDP1/E2F1 complex that binds to the promoter of U2AF2
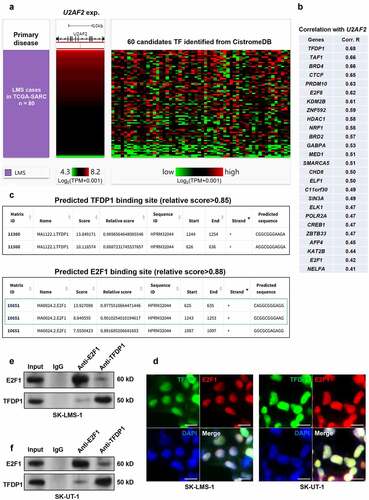
To explore the mechanisms underlying U2AF2 dysregulation at the transcriptional level, we checked the transcriptional factors (TFs) with physical binding in the promoter region of U2AF2, using ChIP-seq data from CistroDB. 61 TFs were identified as the candidates (Supplementary Table 2). Then, the expression correlations between U2AF2 and the 61 TF genes in 80 primary leiomyosarcoma cases in TCGA-SARC were calculated (). By setting moderate Pearson’s correlation (coefficient > 0.40) as the cutoff, we identified 26 high potential candidates (). TFDP1 has the highest level of positive correlation with U2AF2 expression (Pearson’s r = 0.68) (). Previous studies indicated that TFDP1 exerts transcriptional regulation via forming a dimer with other TFs, such as E2F1 [Citation26,Citation27]. Interesting, E2F1 is also among the high potential candidates (). By scanning the promoter region of U2AF2 gene (Supplementary Figure 1), we found that TFDP1 and E2F1 had two high-score binding sites in common (). IF staining confirmed co-localization of TFDP1 and E2F1 in the nucleus (). By performing co-IP assays, we observed mutual interactions between endogenous TFDP1 and E2F1 in both SK-LMS-1 and SK-UT-1 cells (). Therefore, we hypothesized that the TFDP1 might regulate U2AF2 expression via forming a complex with E2F1.
Figure 4. Bioinformatic analysis predicted a TFDP1/E2F1 complex that binds to the promoter of U2AF2 A. a heatmap showing the correlation between the expression of U2AF2 and the candidates TFs identified from CistroDB. B. A list of high potential candidate TFs modulating U2AF2 expression (Pearson’s r > 0.4). C. The high potential (relative score >0.85) binding site of TFDP1 (top panel) and E2F1 (bottom panel) in the promoter region of U2AF2. Promoter scanning was conducted using the Jaspar database. D. IF staining of TFDP1 (green) and E2F1 (red) in SK-LMS-1 and SK-UT-1 cells. E-F. Co-IP assays to assess the interaction between endogenous TFDP1 and E2F1 in SK-LMS-1 (e) and SK-UT-1 (f) cells. IP was performed using mouse anti-E2F1 or rabbit anti-TFDP1. IgG served as a negative control. Scale bar: 20 μm.
TFDP1/E2F1 complex enhances U2AF2 transcription
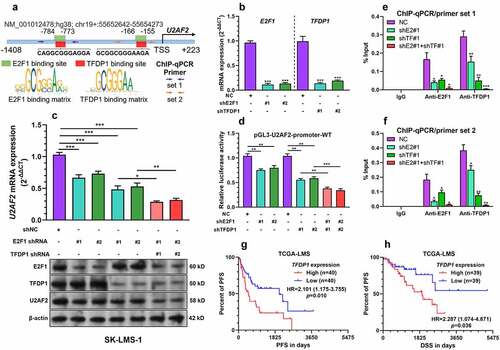
Since bioinformatic analysis identified two high-score TFDP1 and E2F1 binding sites in the promoter region U2AF2 (), we tried to validate the transcriptional regulatory effect of the TFDP1 and E2F1 complex. Both SK-LMS-1 and SK-UT-1 cells were infected for TFDP1 and E2F1 knockdowns, respectively, or in combination ( b and c). TFDP1 or E2F1 knockdown significantly reduced U2AF2 mRNA and protein expression (). Combined TFDP1 and E2F1 knockdown generated a stronger suppressive effect on U2AF2 expression than TFDP1 or E2F1 knockdown alone (). Then, the full-length of U2AF2 promoter fragments were PCR amplified and cloned into the pGL3-basic plasmids. TFDP1 or E2F1 knockdown significantly reduced the relative luciferase expression of pGL3-U2AF2-promoter-WT. Combined TFDP1 and E2F1 knockdown had a stronger suppressive effect on luciferase expression (). ChIP-qPCR assay showed that both primer set 1 and 2 that cover the predicted binding sites in the U2AF2 promoter could be amplified from the samples immunoprecipitated by anti-E2F1 or anti-TFDP1 (). When, TFDP1 or E2F1 was knocked down, the enrichment of the promoter fragments was significantly reduced (). The group with combined TFDP1 and E2F1 knockdown had the lowest enrichment (). These findings imply that TFDP1 and E2F1 can form a complex, which binds to the U2AF2 promoter and activate its transcription. Since TFDP1 has been characterized as an oncogene in multiple cancers [Citation26,Citation28], we assessed its expression and the survival outcomes of patients with primary leiomyosarcoma. K-M survival analysis showed that patients with high (top 50%) TFDP1 expression had significantly shorter PFS (HR: 2.101, 95%CI: 1.175–3.755, p = 0.010) and DSS (4.656, 95%CI: 1.074–4.871, p = 0.036) ().
Figure 5. The TFDP1/E2F1 complex enhances U2AF2 transcription A. A schematic image showing the predicted binding site of TFDP1 and E2F1 in the promoter region of U2AF2. The positions of primers used for ChIP-qPCR assay were indicated by arrows. B. QRT-PCR was conducted to detect the expression of E2F1 and TFDP1 at the mRNA level in SK-LMS-1 cells 48 h after lentiviral mediated E2F1 or TFDP1 knockdown (n = 3). C. U2AF2 expression at the mRNA level (top panel) and E2F1, TFDP1, and U2AF2 expression at the protein level (bottom panel) in SK-LMS-1 cells 48 h after lentiviral mediated E2F1 or TFDP1 knockdown alone or in combination (n = 3). D. Relative luciferase activity of pGL3-U2AF2-promoter-WT in SK-LMS-1 cells with lentiviral mediated E2F1 or TFDP1 knockdown alone or in combination (n = 3). E-F. ChIP-qPCR assay was performed to quantify the relative enrichment of U2AF2 promoter fragments (by primer sets indicated in panel A) in the ChIP samples immunoprecipitated by anti-E2F1 or anti-TFDP1 in the lysates of SK-LMS-1 cells with E2F1 or TFDP1 knockdown alone (shE2#1 or shTF#1) or in combination (shE2#1 and shTF#1) (n = 3). G-H. K-M survival analysis was performed to explore the differences in PFS (g) and DSS (h) in leiomyosarcoma patients with high or low TFDP1 expression. *p < 0.05, **p < 0.01, ***p < 0.001. ShE2: shE2F1, ShtTF: shTFDP1.
Discussion
Pre-mRNA splicing is a critical post-transcriptional process, through which exonic segments are spliced together, and the intronic sequences are excised by the spliceosome to form mature mRNA [Citation29]. Over 90% of protein-encoding transcripts are alternatively spliced, generating multiple mRNA and protein products from a single gene [Citation30]. Dysregulated alternative splicing is associated with many human diseases, including cancers [Citation31,Citation32]. As an important regulator of pre-mRNA splicing, U2AF2 dysregulations, including upregulation and mutations were observed in multiple cancers [Citation9,Citation33,Citation34]. Tumor cells usually have reprogramed energy metabolism, supporting aerobic glycolysis even with sufficient oxygen supply [Citation35]. This alteration brings multiple benefits to tumors. Firstly, increased glucose consumption might provide a carbon source for anabolic processes, which is essential for rapid tumor cell proliferation [Citation35]. Secondly, excessive lactate production can generate an acidified microenvironment that is immunosuppressive and supports cancer immune evasion [Citation35]. One recent study explored 11 glycolysis-related genes in the glycolytic pathway and found that knockdown of U2AF2 can decrease the expression of GLUT1, PGK1, and PGAM1 [Citation9]. PGK1 catalyzes the conversion of 1,3-bisphosphoglycerate (1,3-BPG) and ADP to 3-phosphoglycerate (3-PG) and ATP [Citation36]. PGAM1 catalyzes the reversible conversion of 3-PG and 2-phosphoglycerate (2-PG). PGK1 upregulation was associated with chemoresistance of some sarcoma subtypes [Citation37,Citation38].
In the current study, bioinformatic analysis confirmed a significant association between U2AF2 upregulation and poor survivals of patients with primary leiomyosarcoma. By using SK-LMS-1 and SK-UT-1 cells as cell models, we confirmed that knockdown of U2AF2 remarkably suppressed leiomyosarcoma growth and aerobic glycolysis in vitro and in vivo. These findings imply that U2AF2 also acts as an important regulator of aerobic glycolysis in leiomyosarcoma.
The mechanisms underlying U2AF2 dysregulation is quite complex. For example, acquired U2AF2 mutations such as N196K or G301D amino acid substitutions were observed in leukemia [Citation33]. G176V/E and Q190L were observed in lung adenocarcinoma [Citation39]. These mutations might alter RNA interactions and splicing [Citation33]. However, bioinformatic studies did not find such somatic alterations in leiomyosarcoma cases in TCGA (data were not shown). In comparison, we observed that U2AF2 expression is positively correlated to its gene-level copy number (Pearson’s r = 0.53, p < 0.001) (Supplementary Figure 2A), but might not be related to the methylation status of the CpG sites within the gene locus (Supplementary Figure 2B).
To explore other mechanisms underlying its dysregulation, we focused on the regulation at the transcriptional level. Bioinformatic analysis via combining previous ChIP-seq data and promoter scanning prediction showed that TFDP1 and E2F1 had high potential in activating U2AF2 transcription. TFDP1 and E2F1 contain hydrophobic heptad repeats, supporting their heterodimer formation [Citation28]. By forming a complex, they can increase PITX1 expression in normal and osteoarthritic articular chondrocytes [Citation40], STMN1 expression in hepatocellular carcinoma cells [Citation41], and KNPA2 expression in lung cancer [Citation42]. In this study, we confirmed the interaction between TFDP1 and E2F1 in leiomyosarcoma cells. Both TFDP1 and E2F1 can bind to the promoter of the U2AF2 gene and exert a synergistic activating effect on U2AF2 transcription. Based on these findings, we infer that TFDP1 and E2F1 are two important regulators of U2AF2 transcription in leiomyosarcoma.
Conclusion
This study revealed that U2AF2 upregulation is associated with poor survival of leiomyosarcoma. Its upregulation enhances proliferation and aerobic glycolysis of leiomyosarcoma cells in vitro and in vivo. TFDP1 and E2F1 can form a complex, which binds to the U2AF2 promoter and synergistically activates its transcription. It is clinically meaningful to explore whether U2AF2 serves as a therapeutic target in leiomyosarcoma in the future.
Data availability
The data and material used to support the findings of this study are available from the corresponding author upon request.
Supplemental Material
Download Zip (1.1 MB)Acknowledgements
The authors have no conflict of interest.
Disclosure statement
No potential conflict of interest was reported by the author(s).
Supplementary material
Supplemental data for this article can be accessed here
Additional information
Funding
References
- Saluja TS, Iyer J, Singh SK. Leiomyosarcoma: prognostic outline of a rare head and neck malignancy. Oral Oncol. 2019;95:100–105.
- Farid M, Ngeow J. Sarcomas associated with genetic cancer predisposition syndromes: a review. Oncologist. 2016;21(8):1002–1013.
- Chen J, Liang T, Cen J, et al. A seven-gene signature and the C-C motif chemokine receptor family genes are the sarcoma-related immune genes. Bioengineered. 2021;12(1):7616–7630.
- George S, Serrano C, Hensley ML, et al. Soft tissue and uterine leiomyosarcoma. J Clin Oncol. 2018;36(2):144–150.
- Millevoi S, Loulergue C, Dettwiler S, et al. An interaction between U2AF 65 and CF I(m) links the splicing and 3’ end processing machineries. EMBO J. 2006;25(20):4854–4864.
- David CJ, Boyne AR, Millhouse SR, et al. The RNA polymerase II C-terminal domain promotes splicing activation through recruitment of a U2AF65-Prp19 complex. Genes Dev. 2011;25(9):972–983.
- Jiang Y, Zhou J, Zhao J, et al. The U2AF2 /circRNA ARF1/miR-342–3p/ISL2 feedback loop regulates angiogenesis in glioma stem cells. J Exp Clin Cancer Res. 2020;39(1):182.
- Zhang P, Feng S, Liu G, et al. CD82 suppresses CD44 alternative splicing-dependent melanoma metastasis by mediating U2AF2 ubiquitination and degradation. Oncogene. 2016;35(38):5056–5069.
- Li J, Cheng D, Zhu M, et al. OTUB2 stabilizes U2AF2 to promote the warburg effect and tumorigenesis via the AKT/mTOR signaling pathway in non-small cell lung cancer. Theranostics. 2019;9(1):179–195.
- Mao L, Dauchy RT, Blask DE, et al. Melatonin suppression of aerobic glycolysis (Warburg effect), survival signalling and metastasis in human leiomyosarcoma. J Pineal Res. 2016;60(2):167–177.
- Zhang Q, Wang L, Cao L, et al. Novel circular RNA circATRNL1 accelerates the osteosarcoma aerobic glycolysis through targeting miR-409-3p/LDHA. Bioengineered. 2021;12(2):9965–9975.
- Fornes O, Castro-Mondragon JA, Khan A, et al. JASPAR 2020: update of the open-access database of transcription factor binding profiles. Nucleic Acids Res. 2020;48(D1):D87–D92.
- Uhlen M, Oksvold P, Fagerberg L, et al. Towards a knowledge-based Human Protein Atlas. Nat Biotechnol. 2010;28(12):1248–1250.
- Chudasama P, Mughal SS, Sanders MA, et al. Integrative genomic and transcriptomic analysis of leiomyosarcoma. Nat Commun. 2018;9(1):144.
- Yang C, Wu J, Liu X, et al. Circadian rhythm is disrupted by znf704 in breast carcinogenesis. Cancer Res. 2020;80(19):4114–4128.
- Livak KJ, Schmittgen TD. Analysis of relative gene expression data using real-time quantitative PCR and the 2(-Delta Delta C(T)) method. Methods. 2001;25(4):402–408.
- Mahmood T, Yang PC. Western blot: technique, theory, and trouble shooting. N Am J Med Sci. 2012;4(9):429–434.
- Stoddart MJ. Cell viability assays: introduction. Methods Mol Biol. 2011;740:1–6.
- Tan S, Zhang M, Shi X, et al. CPSF6 links alternative polyadenylation to metabolism adaption in hepatocellular carcinoma progression. J Exp Clin Cancer Res. 2021;40(1):85.
- Iuso A, Repp B, Biagosch C, et al. Assessing mitochondrial bioenergetics in isolated mitochondria from various mouse tissues using seahorse XF96 analyzer. Methods Mol Biol. 2017;1567:217–230.
- Olympus Life Science Europa Gmb H. Flexible applications for olympus digital microscope camera. Biotechnol J. 2008;3(1):31.
- Sherf B, Navarro S, Hannah R, et al. Dual-Luciferase TM reporter assay: an advanced co-reporter technology integrating firefly and renilla luciferase assays. Promega Notes. 1996;57.
- Gade P, Kalvakolanu DV. Chromatin immunoprecipitation assay as a tool for analyzing transcription factor activity. Methods Mol Biol. 2012;809:85–104.
- Kim TK. T test as a parametric statistic. Korean J Anesthesiol. 2015;68(6):540–546.
- Porporato PE, Dhup S, Dadhich RK, et al. Anticancer targets in the glycolytic metabolism of tumors: a comprehensive review. Front Pharmacol. 2011;2:49.
- Drucker E, Holzer K, Pusch S, et al. Karyopherin alpha2-dependent import of E2F1 and TFDP1 maintains protumorigenic stathmin expression in liver cancer. Cell Commun Signal. 2019;17(1):159.
- Yasui K, Okamoto H, Arii S, et al. Association of over-expressed TFDP1 with progression of hepatocellular carcinomas. J Hum Genet. 2003;48(12):609–613.
- Zhan W, Wang W, Han T, et al. COMMD9 promotes TFDP1/E2F1 transcriptional activity via interaction with TFDP1 in non-small cell lung cancer. Cell Signal. 2017;30:59–66.
- Wilkinson ME, Charenton C, Nagai K. RNA Splicing by the spliceosome. Annu Rev Biochem. 2020;89:359–388.
- Bonnal SC, Lopez-Oreja I, Valcarcel J. Roles and mechanisms of alternative splicing in cancer - implications for care. Nat Rev Clin Oncol. 2020;17(8):457–474.
- Yang H, Beutler B, Zhang D. Emerging roles of spliceosome in cancer and immunity. Protein Cell. 2021. DOI:10.1007/s13238-021-00856-5
- Di C, Syafrizayanti, Zhang Q, et al. Function, clinical application, and strategies of Pre-mRNA splicing in cancer. Cell Death Differ. 2019;26(7):1181–1194.
- Maji D, Glasser E, Henderson S, et al. Representative cancer-associated U2AF2 mutations alter RNA interactions and splicing. J Biol Chem. 2020;295(50):17148–17157.
- Laliotis GI, Chavdoula E, Paraskevopoulou MD, et al. AKT3-mediated IWS1 phosphorylation promotes the proliferation of EGFR-mutant lung adenocarcinomas through cell cycle-regulated U2AF2 RNA splicing. Nat Commun. 2021;12(1):4624.
- Liberti MV, Locasale JW. The warburg effect: how does it benefit cancer cells? Trends Biochem Sci. 2016;41(3):211–218.
- Duncan L, Shay C, Teng Y. PGK1: an essential player in modulating tumor metabolism. Methods Mol Biol. 2022;2343:57–70.
- Zhang S, Qin YP, Kuang JM, et al. Proteomic investigation of resistance to chemotherapy drugs in osteosarcoma. Technol Health Care. 2018;26(1):145–153.
- Duan Z, Lamendola DE, Yusuf RZ, et al. Overexpression of human phosphoglycerate kinase 1 (PGK1) induces a multidrug resistance phenotype. Anticancer Res. 2002;22(4):1933–1941.
- Glasser E, Agrawal AA, Jenkins JL, et al. Cancer-Associated mutations mapped on high-resolution structures of the U2AF2 RNA recognition motifs. Biochemistry. 2017;56(36):4757–4761.
- Pellicelli M, Picard C, Wang D, et al. E2F1 and TFDP1 regulate PITX1 expression in normal and osteoarthritic articular chondrocytes. PLoS One. 2016;11(11):e0165951.
- Chen YL, Uen YH, Li CF, et al. The E2F transcription factor 1 transactives stathmin 1 in hepatocellular carcinoma. Ann Surg Oncol. 2013;20(12):4041–4054.
- Wang CI, Chen YY, Wang CL, et al. Yu CJ. mTOR regulates proteasomal degradation and Dp1/E2F1- mediated transcription of KPNA2 in lung cancer cells. Oncotarget. 2016;7(18):25432–25442.
