
ABSTRACT
Retinal pigment epithelium (RPE) is an important component of the outer blood-retinal barrier and plays a critical role in maintaining retinal homeostasis. Alterations in RPE can be detected during the early stages of diabetic retinopathy (DR). However, the molecular mechanisms underlying these early changes remain unclear. We investigated the molecular changes induced in the RPE by high glucose concentrations by constructing a high glucose-induced ARPE-19 cell injury model simulating the DR environment in vitro. Proteomic analysis was conducted to measure differences in protein expression between cells treated with normal (5 mM) and high (25 mM) glucose concentrations, and bioinformatics techniques were used to analyze the mechanism of action. The results of the proteomic analyses were validated using western blotting. High glucose levels inhibited the proliferation of ARPE-19 cells. We identified 88 upregulated proteins and 114 downregulated proteins. Six of these proteins were selected for further validation. Changes in the proteome mainly affected the lysosome and cell cycle pathways. Proteomic differences between ARPE-19 cells treated with normal and high glucose concentrations indicate that damage to the RPE in DR may be caused by specific mechanisms. Our study verified protein changes in ARPE-19 cells in a high-glucose environment and may provide new strategies for understanding the molecular mechanisms underlying DR.
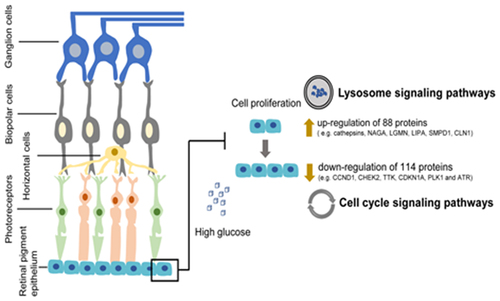
Graphical abstract
1. Introduction
Diabetic retinopathy (DR) is a leading cause of irreversible blindness in working-age adults. The estimated global prevalence of vision-threatening DR is 10.2% and increases as the duration of diabetes mellitus (DM) increases [Citation1]. DR is caused by long-term exposure to hyperglycemia, which occurs in almost all patients with type 1 diabetes and in most patients with type 2 diabetes. DR severely reduces the quality of life, results in considerable economic expenses, and causes serious medical and health burdens [Citation2–4]. Due to the limited curative effect and potential adverse reactions of current DR treatments, new therapies based on novel DR biomarkers need to be developed.
DR progression is associated with the destruction of the inner blood-retinal barrier (iBRB) and the outer blood-retinal barrier (oBRB) [Citation5]. Multiple studies have been conducted on iBRB, but research on the regulation of oBRB is limited. The oBRB is composed of the retinal pigment epithelium (RPE) that controls the flow of solutes and fluids from the choroidal vasculature to the retina [Citation6,Citation7] and maintains the stability of the retinal environment [Citation5]. RPE provides nutrients and removes waste from the retina. RPE also maintains the selective permeability of the oBRB and regulates the ionic environment [Citation8] and is essential for maintaining the survival and function of retinal photoreceptor cells [Citation5].
Changes in RPE are observable in the early stage of DR. Electron microscopy showed the loss and degeneration of RPE and disruption of the RPE layer in diabetic rats. Many RPE organelles are morphologically altered in high-glucose environments [Citation9–12]. The electroretinogram (ERG) c-wave can be used to assess RPE function and a reduction in the amplitude of the c-wave was observed in diabetic rodents [Citation13,Citation14]. The apoptosis of RPE cells was induced by hyperglycemia and related factors [Citation15,Citation16]. Owing to the critical role of RPE in the retina, RPE impairment and death caused significant DR dysfunction, leading to severe visual consequences [Citation5].
In this study, we constructed a high-glucose-induced RPE injury model simulating DR in vitro and Streptozotocin (STZ) – induced Sprague Dawley (SD) rat model in vivo. We aimed to analyze the effect of high glucose levels on protein expression in ARPE-19 cells and explored possible molecular mechanisms with new therapeutic potential.
2. Materials and methods
2.1 Cell culture and treatment
The human RPE cell line ARPE-19 was obtained from the American Type Culture Collection (ATCC, USA) and cultured in Dulbecco’s modified Eagle’s medium/nutrient mixture F-12 containing 10% fetal bovine serum and 1% antibiotics (100 U/mL penicillin and 100 mg/ml streptomycin) at 37°C and under 5% CO2. Logarithmic phase cells were treated with various reagents [Citation17].
2.2 Cell proliferation
ARPE-19 cells were incubated for 48 h with normal (5 mM) and high (25 mM) glucose concentration solutions [Citation17]. The cells were then collected, stained with trypan blue, and counted under an optical microscope. Cell counting kit-8 (CCK-8) detection kit (Dojindo Laboratories, Japan) was used to treat cells and the plate incubated at 37°C for 1 h following treatment with normal or and high glucose concentration solutions. Protein absorbance was measured at 450 nm using a monochromator microplate reader [Citation18]. The OD values reflected the proliferation ability of the ARPE-19 cells.
2.3 Western blot assays
Equal protein quantities were resolved on 8–12% SDS–PAGE gels and then transferred to a nitrocellulose filter membrane. The membrane was blocked with 5% nonfat milk for 1 h, incubated with primary antibodies overnight at 4°C and then bound to horseradish peroxidase-conjugated secondary antibodies. The membrane was examined using scotography on an X-ray film [Citation18].
2.4 Animal studies
The protocols of animal experiments have been reviewed and approved by the Animal Study Committee of The First Affiliated Hospital of USTC and conformed to the principles of the Declaration of Helsinki. Male 8-week-old Sprague-Dawley rats were intraperitoneally injected with 60 mg/kg of Streptozotocin (STZ, Sigma, St. Louis, MO, United States) after fasting for 8 h, and citrate buffer was injected into rats of the control group. 3 days after injection, blood glucose level was measured to evaluate the induction of diabetes (hyperglycemia >16.7 mM). The rats were euthanized three months after intraperitoneal injection of STZ for subsequent analysis [Citation17].
2.5 Immunohistochemistry staining (IHC)
Briefly, according to previous research [Citation18], tissue sections were deparaffinized with xylene and rehydrated with ethanol, followed by antigen retrieval. Then, tissue sections were blocked by optimal serum. Primary antibodies were used to incubate tissue sections overnight at 4°C. After that, tissue sections were incubated with secondary antibody at room temperature for 1 h, followed by the Vectastain Elite ABC reagent for 30 min. The tissue sections were counterstained with hematoxylin after the peroxidase reaction with diaminobenzidine.
2.6 Statistical analysis
Data are shown as mean ± standard error of the mean (S.E.M.). Pairwise comparisons were conducted using student’s t-test. Statistical analysis was conducted using GraphPad Prism 5 software and statistical significance was set at p < 0.05.
Proteomics experiments and bioinformatics methods are provided in the supplementary materials.
3. Results
In this study, we used mass spectrometry to analyze changes of the proteins related to the cell cycle and lysosomal of ARPE-19 cells damaged by high glucose. The down-regulation of CCND1, CHEK2, TTK, CDKN1A, PLK1, and ATR were verified by experiments in vivo and in vitro.
3.1 Effects of high glucose concentration on the proliferation of ARPE-19 cells
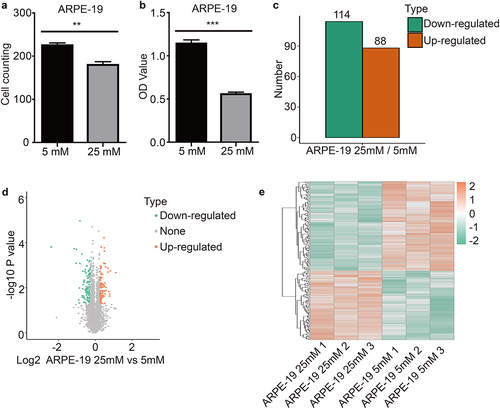
ARPE-19 cells were treated with 5 mM (normal) or 25 mM (high) glucose concentration solutions for 48 h. Cell counting and CCK-8 assays showed that treatment with high glucose concentrations significantly inhibited ARPE-19 cell proliferation ().
Figure 1. High glucose inhibited ARPE-19 cells proliferation and quantitative intracellular proteome analysis of ARPE-19 cells As shown in the figure, ARPE-19 cells were treated with normal glucose (5 mM) and high glucose (25 mM) for 48 h. (a) and (b) Cell proliferation was detected with cell counting and CCK-8 assay kits. Each experiment had at least 3 repetitions. Values are presented as mean ± SEM. **P < 0.01, ***P < 0.001. (c) The double sample T test method was used to calculate the p value. When the p value was less than 0.05, the change of differential expression was more than 1.2 times as the threshold of significant change. The histogram showed the number of differential proteins. Orange indicated up-regulation proteins and green indicated down-regulation proteins. (d) The horizontal axis of the volcano plot was the logarithmically converted value of the relative quantitative value of the protein, and the vertical axis was the value of the logarithmically converted p-value after the log-log conversion. The Orange dot indicated the significant differential expression of the up-regulated protein, and the green dot indicated the significant differential expression of the down-regulated protein. (e) The heatmap showed the results of three independent repeated experiments, and the trend was basically the same, indicating that the repeatability was good. Orange indicated up-regulation proteins and green indicated down-regulation proteins.
3.2 Quantitative intracellular proteome analysis of ARPE-19 cells following treatment with high glucose concentrations
Proteomic analysis was performed to determine the biological changes and mechanisms of ARPE-19 cells treated with normal and high concentrations of glucose. A total of 6152 proteins were identified across three sets of biological replicates of the normal and high glucose concentration groups by LC-MS/MS. A total of 202 proteins showed at least 1.2X differential expression (p < 0.05) between the normal and high glucose concentration groups. Of these, 88 proteins were upregulated while 114 proteins were downregulated (). Analysis of heatmaps showed similar trends across the three biological replicates ().
3.3 Gene Ontology (GO) analysis and Clusters of Orthologous Groups/Eukaryotic Orthologous Group of proteins (COG/KOG) analysis of ARPE-19 cells following treatment with high glucose concentration
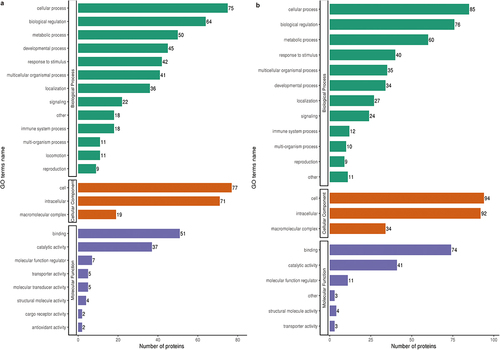
The differentially expressed proteins were classified according to biological process, cellular component, and molecular function using GO analysis. The upregulated proteins associated with biological processes were mainly concentrated in cellular processes, biological regulation, and metabolic processes. In the cellular component, differentially expressed proteins were mainly enriched in cellular and intracellular components. Molecular function was mainly associated with binding and catalytic activity () while for subcellular location classification, differentially expressed proteins were mainly concentrated in the extracellular space (Supplementary Fig. S1a). The downregulated proteins showed a pattern similar to that of upregulated proteins in biological processes, cellular components, and molecular functions (), while in subcellular location classification, nearly half of the differentially expressed proteins were in the nucleus (Supplementary Fig. S2a). COG/KOG category analysis showed significant differences between upregulated and downregulated proteins. Upregulated proteins were mainly enriched in cellular processes and signaling, signal transduction mechanisms, posttranslational modification, protein turnover, and chaperones (Supplementary Fig. S1b). Cellular processes, signaling, and information storage and processing were mainly concentrated in downregulated proteins (Supplementary Fig. S2b).
Figure 2. GO analysis of ARPE-19 cells after treatment with high glucose (a) The biological processes, cellular component, and molecular function of the GO-annotation distribution of the up-regulated proteins in ARPE-19 cells treated with high glucose and normal glucose. The bars represent the numbers of proteins involved in the processes. (b) GO-annotation distribution of the down-regulated proteins.
3.4 Bioinformatics analysis of differentially expressed proteins
GO functional enrichment GO analysis of the three categories: cellular component, molecular function, and biological process showed that upregulated proteins were concentrated in growth factor binding and extracellular matrix organization and were mainly located in the extracellular region (). Downregulated proteins play a role in the response to gamma radiation and cellular response to ionizing radiation in biological processes, are concentrated in DNA primase activity of molecular function, and are located mainly in the alpha DNA polymerase primase complex ().
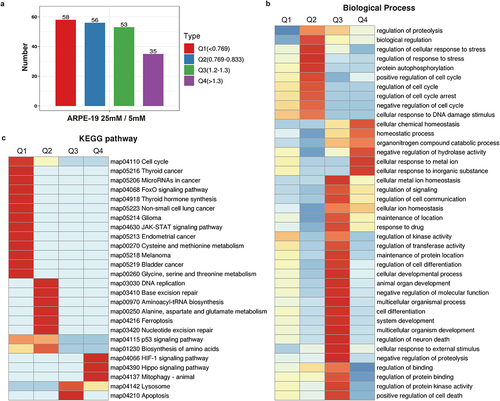
Figure 3. Bioinformatics information of differentially expressed proteins (a) GO-based enrichment analysis of up-regulated proteins. (b) GO-based enrichment analysis of down-regulated proteins. (c) KEGG pathway-based enrichment analysis of up-regulated proteins. (d) KEGG pathway-based enrichment analysis of down-regulated proteins. Red indicates up-regulated differential protein while blue indicates down-regulated differential protein.
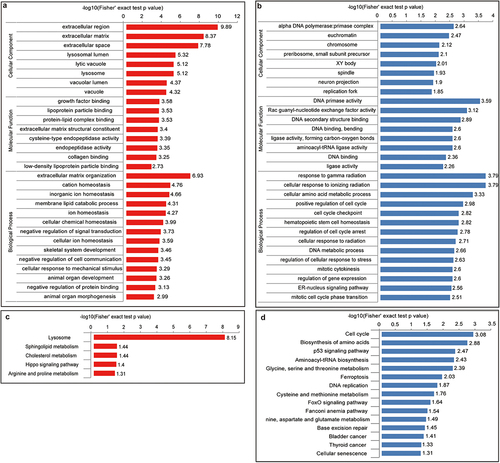
Kyoto Encyclopedia of Genes and Genomes (KEGG) pathway analysis showed that upregulated proteins were enriched in the lysosome signaling pathway () while downregulated proteins were concentrated in the cell cycle, amino acid biosynthesis, and p53 signaling pathways ().
Protein domain enrichment analysis identified several upregulated proteins that are closely associated with cell homeostasis, including human growth factor-like EGF, calcium-binding EGF domain, and cadherin domain (Supplementary Fig. S3a). On the other hand, downregulated proteins were enriched in the high mobility group that is mainly associated with cell cycle regulation (Supplementary Fig. S3b).
3.5 Cluster analysis
We divided the differentially expressed proteins into four groups: Q1 to Q4, and then conducted GO classification, KEGG analysis, and protein domain enrichment in each group. We then conducted cluster analysis to measure functional correlation among differentially expressed proteins. A histogram of the distribution of differentially expressed proteins divided into Q1 to Q4 based on multiple differences (). Hierarchical clustering was used to group proteins with related functions and a heatmap was generated to visualize the relationship. The horizontal heatmap shows the enrichment test results of the different groups, and the vertical map represents differentially expressed enrichment-related functions (GO, KEGG pathway, protein domain). The differentially expressed proteins in the different groups and the color blocks corresponding to the functional descriptions indicate the degree of enrichment. Red represents a strong degree of enrichment, and blue represents a weak degree of enrichment. The Q enrichment analyses of biological processes, cellular components, and molecular functions are shown in , Supplementary Figure S4a, and Supplementary Figure S4b, respectively. and Supplementary Figure S4c show the Q-enrichment analysis of the KEGG pathway and protein domain, respectively.
Figure 4. Cluster analysis (a) The histogram showed the number of differentially proteins classified by Q-category analysis. (b) Q-category analysis based on GO enrichment in biological process. (c) Q-category analysis based on KEGG pathway enrichment.
3.6 Representative analysis of KEGG pathway enrichment
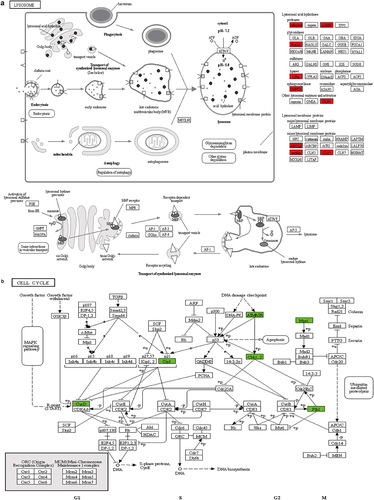
KEGG pathway analysis of enriched differentially expressed proteins showed that lysosomal signaling () and cell cycle () pathways ranked higher, suggesting that high glucose concentrations may affect ARPE-19 cell proliferation through lysosomal and cell cycle pathways. We found six key proteins (CCND1, CHEK2, TTK, CDKN1A, PLK1, and ATR) that were downregulated in ARPE-19 cells following treatment with high glucose concentrations.
Figure 5. Representative analysis of KEGG pathway enrichment (a) Lysosome schematic representation of the KEGG pathway with significantly enriched differentially expressed proteins. (b) Cell cycle schematic representation of the KEGG pathway with significantly enriched differentially expressed proteins. Red indicates differentially up-regulated proteins while green indicates differentially down-regulated proteins.
3.7 Analysis of protein-protein interaction (PPI)
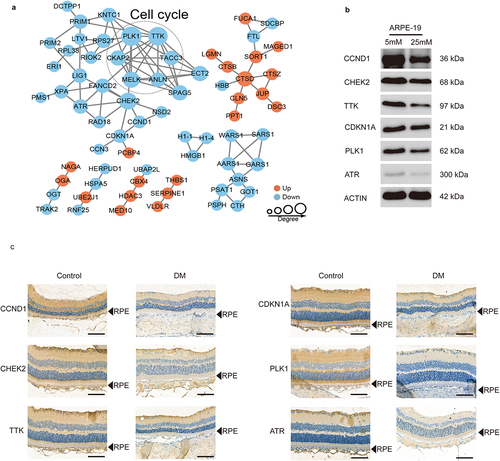
The PPI database was used to verify and visualize interactions between differentially expressed proteins. In the PPI network, blue represents downregulated proteins, while red represents upregulated proteins. The size of the circle represents the number of proteins interacting with each other. The larger the circle, the higher the number of proteins that interact, indicating increased importance of the proteins in the network. Six cell cycle-correlated proteins (PLK1, TTK, TACC3, ANLN, MELK, and CKAP2) () were identified at the center of the PPI network. PPI analysis confirmed that high glucose levels affect the cell cycle in ARPE-19 cells.
Figure 6. PPI analysis and western blotting verification (a) The circles in the picture represent differentially expressed proteins. Blue colors represented differentially down-regulated proteins while red colors represented differentially up-regulated proteins. The number of lines represents the number of different proteins and the proteins they interact with. The more proteins that interact, the more important the protein is in the network. (b) Expression of proteins about cell cycle (CCND1, CHEK2, TTK, CDKN1A, PLK1 and ATR) analyzed by KEGG enrichment analysis in the high glucose and normal glucose treatment of ARPE-19 cells was examined by Western blot analysis. (c) Representative images of CCND1, CHEK2, TTK, CDKN1A, PLK1 and ATR IHC staining in control group and DM group. Scale bars, 100 μm.
3.8 In vitro and in vivo verification
To verify the LC-MS/MS results, we extracted whole cell lysates for western blot analysis and explored the expression of six differentially expressed cell cycle proteins (CCND1, CHEK2, TTK, CDKN1A, PLK1, and ATR) identified from the KEGG enrichment analysis. CCND1, CHEK2, TTK, CDKN1A, PLK1, and ATR levels decreased in the high glucose concentration treatment group compared with those in the normal glucose concentration treatment group (). The same result was observed in RPE layer of diabetic rats (). These results were consistent with the results of the mass spectrometry analysis, suggesting that high glucose levels may affect cell growth and homeostasis.
4. Discussion
DM is a common metabolic disease with increasing prevalence. The disease and its complications are associated with high health care costs and disability burden [Citation1]. DR is a common complication of DM. Hyperglycemia is a major risk factor for developing DR [Citation1]. iBRB dysfunction has been associated with DR [Citation19,Citation20], although little attention has been given to the effects of hyperglycemia on oBRB. RPE cells constitute the oBRB, regulate retinal paracellular diffusion, and facilitate diffusion, active transport, transcytosis, and metabolic modification [Citation5]. RPE cells are also essential for the survival and function of retinal photoreceptors [Citation5]. Alteration and leakage of oBRB in the eye of individuals with DM have been demonstrated in early studies, indicating compromised RPE function [Citation21]. RPE cells are crucial for maintaining retinal health. We used proteomic analysis to explore the intracellular molecular changes following the treatment of ARPE-19 cells with high concentrations of glucose to help identify potential therapeutic targets for DR.
We initially observed that high glucose levels impeded ARPE-19 cell proliferation. We then used LC-MS/MS to explore the possible pathways and mechanisms of the effect of high glucose concentrations on ARPE-19 cells at the protein level across three sets of biological replicates. Additionally, high glucose concentrations resulted in differentially expressed proteins associated with cellular biological processes and accounted for the highest proportion of proteins in the nucleus, suggesting that these differentially expressed proteins play a major cellular regulatory role in the nucleus. Lysosomal signaling and cell cycle pathways ranked highest in the KEGG pathway analysis, suggesting that these two pathways play an important role in the ARPE-19 cell damage induced by high glucose concentrations.
Lysosomes are an important center of cellular metabolism and play a variety of roles in nutrient degradation, gene regulation, secretion, plasma membrane repair, metal ion homeostasis, cholesterol transport, and immune response [Citation22]. Abnormal regulation of the lysosomal pathway is closely associated with numerous diseases, including diabetes, cancer, and epilepsy.
High-glucose levels can lead to mitochondrial damage, resulting in their fragmentation and delivery to lysosomes. The overload of damaged mitochondria in lysosomes can enlarge lysosomes, resulting to the fusion of lysosomes and autophagosomes [Citation23,Citation24]. This leads to the instability of lysosomes and inactivation of acid hydrolases [Citation25]. The enhancement of mitochondrial membrane lipids and iron-sulfur complexes can lead to the formation of lipofuscin and lysosomal oxidative stress through the Fenton reaction, producing highly active hydroxyl ions [Citation26,Citation27]. Destructive reactive hydroxyl ions interfere with the lysosomal membrane and increase its permeability. Lysosomal cathepsins enter the cytoplasm and degrade proteins on the outer mitochondrial membrane [Citation28]. This results in a deleterious cycle of mitochondrial damage-mitotic flux-lysosomal damage, leading to cell death through apoptosis or inflammatory pyroptosis. Autophagosome-lysosome fusion caused by lysosomal membrane destabilization increases damaged mitochondria and autophagosomes, leading to cytoplasmic crowding, reactive oxygen species (ROS) production, and autophagic death [Citation25].
Large quantities of ROS are produced by photoreceptors in the early stages of DR [Citation29], likely due to microvascular dysfunction [Citation30]. Thus, we hypothesize photoreceptor damage, Muller cell activation, and microvascular injury may be the mechanisms underlying RPE dysfunction in early DR [Citation31]. These pathological changes may be induced by oxidative stress, mitochondrial injury, unrestrained fission, mitotic flux, and lysosomal destabilization [Citation32,Citation33]. These events can decrease photoreceptor outer segment phagocytosis and the retinol cycle in RPE cells [Citation25]. Interestingly, in most neurodegenerative diseases, such as Parkinson’s disease and Alzheimer’s disease, lysosome imbalance leads to mitochondrial breakage and bioenergy deficiency, and similar events may occur in diabetic retinal neurodegeneration [Citation34,Citation35].
The cell cycle is a complex process that is mainly influenced and regulated by the CDK kinase family [Citation36]. Cyclin D1 (CCND1) is a key regulator of the CDK kinase family. CCND1 forms a complex with and acts as a regulatory subunit of CDK4 or CDK6, and its activity is necessary for the G1/S cell cycle transition [Citation37]. We observed that CCND1 expression decreased in the presence of high glucose concentration, which is likely to cause G1/S phase cell cycle arrest and affect ARPE-19 cell viability and proliferation.
5. Conclusion
Our study used proteomic techniques to analyze protein changes in ARPE-19 cells treated with high glucose concentration solutions in vitro. The results indicated that in a high-glucose environment, significant biochemical changes were induced in ARPE-19 cells, particularly in proteins associated with lysosomes and the cell cycle. These data provide new insights into the mechanisms underlying high glucose-induced RPE damage and provide a theoretical basis for further in-depth research and targeted clinical therapy.
Supplemental Material
Download MS Word (1.3 MB)Disclosure statement
No potential conflict of interest was reported by the author(s).
Supplementary material
Supplemental data for this article can be accessed here
Additional information
Funding
References
- Flaxel CJ, Adelman RA, Bailey ST, et al. Diabetic retinopathy preferred practice pattern(R). Ophthalmology. 2020;127:66–145.
- American Diabetes A. Standards of medical care in diabetes–2012. Diabetes Care. 2012;35(Suppl 1):S11–63.
- Fong DS, Aiello L, Gardner TW, et al. Diabetic retinopathy. Diabetes Care. 2003;26(Suppl 1):S99–S102.
- Ma Y, Yang C, Tao Y, et al. Recent technological developments in proteomics shed new light on translational research on diabetic microangiopathy. FEBS J. 2013;280(22):5668–5681.
- Xia T, Rizzolo LJ. Effects of diabetic retinopathy on the barrier functions of the retinal pigment epithelium. Vision Res. 2017;139:72–81.
- Erickson KK, Sundstrom JM, Antonetti DA. Vascular permeability in ocular disease and the role of tight junctions. Angiogenesis. 2007;10(2):103–117.
- Strauss O. The retinal pigment epithelium in visual function. Physiol Rev. 2005;85(3):845–881.
- Reichhart N, Strauss O. Ion channels and transporters of the retinal pigment epithelium. Exp Eye Res. 2014;126:27–37.
- Tso MO, Cunha-Vaz JG, Shih CY, et al. Clinicopathologic study of blood-retinal barrier in experimental diabetes mellitus. Arch Ophthalmol. 1980;98(11):2032–2040.
- Tarchick MJ, Bassiri P, Rohwer RM, et al. Early functional and morphologic abnormalities in the diabetic Nyx nob mouse retina. Invest Ophthalmol Vis Sci. 2016;57(7):3496–3508.
- Blair NP, Tso MO, Dodge JT. Pathologic studies of the blood–retinal barrier in the spontaneously diabetic BB rat. Invest Ophthalmol Vis Sci. 1984;25(3):302–311.
- Wallow IH. Posterior and anterior permeability defects? Morphologic observations on streptozotocin-treated rats. Invest Ophthalmol Vis Sci. 1983;24(9):1259–1268.
- Pautler EL, Ennis SR. The effect of induced diabetes on the electroretinogram components of the pigmented rat. Invest Ophthalmol Vis Sci. 1980;19(6):702–705.
- Samuels IS, Bell BA, Pereira A, et al. Early retinal pigment epithelium dysfunction is concomitant with hyperglycemia in mouse models of type 1 and type 2 diabetes. J Neurophysiol. 2015;113(4):1085–1099.
- Hao LN, Zhang YQ, Shen YH, et al. Effect of puerarin on retinal pigment epithelial cells apoptosis induced partly by peroxynitrite via Fas/FasL pathway. Int J Ophthalmol. 2010;3(4):283–287.
- Kim DI, Park MJ, Choi JH, et al. Hyperglycemia-induced GLP-1R downregulation causes RPE cell apoptosis. Int J Biochem Cell Biol. 2015;59:41–51.
- Feng L, Liang L, Zhang S, et al. HMGB1 downregulation in retinal pigment epithelial cells protects against diabetic retinopathy through the autophagy-lysosome pathway. Autophagy. 2021;18(2):320–339.
- Zhou HR, Ma XF, Lin WJ, et al. Neuroprotective Role of GLP-1 Analog for Retinal Ganglion Cells via PINK1/Parkin-Mediated Mitophagy in Diabetic Retinopathy. Front Pharmacol. 2020;11:589114.
- Xie H, Zhang C, Liu D, et al. Erythropoietin protects the inner blood-retinal barrier by inhibiting microglia phagocytosis via Src/Akt/cofilin signalling in experimental diabetic retinopathy. Diabetologia. 2021;64(1):211–225.
- Klaassen I, Van Noorden CJ, Schlingemann RO. Molecular basis of the inner blood-retinal barrier and its breakdown in diabetic macular edema and other pathological conditions. Prog Retin Eye Res. 2013;34:19–48.
- Ahern-Rindell AJ, Murnane RD, Prieur DJ. Beta-galactosidase activity in fibroblasts and tissues from sheep with a lysosomal storage disease. Biochem Genet. 1988;26(11–12):733–746.
- Bajaj L, Lotfi P, Pal R, et al. Lysosome biogenesis in health and disease. J Neurochem. 2019;148(5):573–589.
- Henry AG, Aghamohammadzadeh S, Samaroo H, et al. Pathogenic LRRK2 mutations, through increased kinase activity, produce enlarged lysosomes with reduced degradative capacity and increase ATP13A2 expression. Hum Mol Genet. 2015;24(21):6013–6028.
- Carroll B, Dunlop EA. The lysosome: a crucial hub for AMPK and mTORC1 signalling. Biochem J. 2017;474(9):1453–1466.
- Devi TS, Yumnamcha T, Yao F, et al. TXNIP mediates high glucose-induced mitophagic flux and lysosome enlargement in human retinal pigment epithelial cells. Biol Open. 2019;8(4).
- Konig J, Ott C, Hugo M, et al. Mitochondrial contribution to lipofuscin formation. Redox Biol. 2017;11:673–681.
- Terman A, Kurz T. Lysosomal iron, iron chelation, and cell death. Antioxid Redox Signal. 2013;18(8):888–898.
- Zhou XY, Luo Y, Zhu YM, et al. Inhibition of autophagy blocks cathepsins-tBid-mitochondrial apoptotic signaling pathway via stabilization of lysosomal membrane in ischemic astrocytes. Cell Death Dis. 2017;8(2):e2618.
- Du Y, Veenstra A, Palczewski K, et al. Photoreceptor cells are major contributors to diabetes-induced oxidative stress and local inflammation in the retina. Proc Natl Acad Sci U S A. 2013;110(41):16586–16591.
- Fu Z, Lofqvist CA, Liegl R, et al. Photoreceptor glucose metabolism determines normal retinal vascular growth. EMBO Mol Med. 2018;10(1):76–90.
- Tonade D, Liu H, Palczewski K, et al. Photoreceptor cells produce inflammatory products that contribute to retinal vascular permeability in a mouse model of diabetes. Diabetologia. 2017;60(10):2111–2120.
- Devi TS, Somayajulu M, Kowluru RA, et al. TXNIP regulates mitophagy in retinal Muller cells under high-glucose conditions: implications for diabetic retinopathy. Cell Death Dis. 2017;8(5):e2777.
- Singh LP, Devi TS, Yumnamcha T. The Role of Txnip in Mitophagy Dysregulation and Inflammasome Activation in Diabetic Retinopathy: a New Perspective. JOJ Ophthalmol. 2017;4(4).
- Trist BG, Davies KM, Cottam V, et al. Amyotrophic lateral sclerosis-like superoxide dismutase 1 proteinopathy is associated with neuronal loss in Parkinson’s disease brain. Acta Neuropathol. 2017;134(1):113–127.
- Van Damme P, Robberecht W, Van Den Bosch L. Modelling amyotrophic lateral sclerosis: progress and possibilities. Dis Model Mech. 2017;10(5):537–549.
- LaBaer J, Garrett MD, Stevenson LF, et al. New functional activities for the p21 family of CDK inhibitors. Genes Dev. 1997;11(7):847–862.
- Matsuura I, Denissova NG, Wang G, et al. Cyclin-dependent kinases regulate the antiproliferative function of Smads. Nature. 2004;430(6996):226–231.