
ABSTRACT
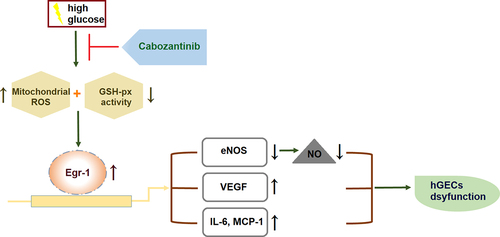
Cabozantinib is a tyrosine kinase inhibitor with anti-tumor activity in kidney cancer. However, the efficacy of cabozantinib in other renal diseases has never been reported. Here, we focused on exploring the effect of cabozantinib on diabetic nephropathy (DN). The biofunctions of cabozantinib in human renal glomerular endothelial cells (hGECs) under high glucose conditions have been investigated. We found that cabozantinib ameliorated high glucose-induced oxidative stress in hGECs with decreased production of mitochondrial reactive oxygen species (ROS) and increased glutathione peroxidase (GSH-PX) activity. Cabozantinib ameliorated high glucose-induced reduction in the expression of endothelial nitric oxide synthase (eNOS) and the production of nitric oxide (NO) in hGECs. It also suppressed the expression of pro-inflammatory mediators, interleukin-6 (IL-6) and monocyte chemokine protein 1 (MCP-1), against high glucose exposure in hGECs. Cabozantinib reduced the expression of early growth response-1 (Egr-1) in high glucose-treated hGECs, while Egr-1 overexpression abolished the protective effects of cabozantinib against high glucose in hGECs. In conclusion, cabozantinib protected hGECs from high glucose-induced oxidative stress, NO deficiency, and inflammation via regulating Egr-1. These findings suggest that cabozantinib might be used as an adjuvant to control DN.
Graphical abstract
1. Introduction
Diabetic nephropathy (DN) is a diabetic complication causing injury to the kidney microcirculation [Citation1]. Underlying pathogenic mechanisms have shown that hyperglycemia-caused metabolic consequences, such as accumulated Advanced Glycation End-products (AGEs) and reactive oxygen species (ROS), contribute to the pathological changes in various cell types including vascular endothelial cells (VECs), tubular epithelial cells, mesangial cells, glomerular endothelial cells (GECs), glomerular podocytes, as well as interstitial fibroblasts [Citation2–4]. Due to the structure and function of the kidney, endothelial cells (ECs) widely exist in the kidney and its associated structures, including renal veins, venules, arteries, arterioles, and glomerular capillaries with distinctive phenotypic features [Citation5]. The ECs have been found to play critical roles in abundant physiological functions, thus their dysfunction is implicated in the development of DN [Citation6].
GECs covering the luminal surface of glomerular capillaries serve as a glomerular filtration barrier that is responsible for efficient filtering, secretion, and absorption [Citation7]. GECs are particularly vulnerable to hyperglycemia-mediated injury since they are chronically exposed to high blood glucose levels [Citation8]. GECs dysfunction is characterized by the following features: excessive generation of ROS and inflammatory mediators, metabolic changes, activation of deleterious pathways, and enhanced permeability [Citation9]. Therefore, it is not surprising that GECs dysfunction remains a major mechanism in the pathogenesis of DN.
Cabozantinib (Molecular structure is listed in )) is a tyrosine kinase inhibitor that is currently approved for the treatment of various cancers, such as medullary thyroid carcinoma, and hepatocellular carcinoma [Citation10]. It has recently been assessed for the treatment of advanced renal cell carcinoma (RCC) [Citation11]. It improves survival outcomes in RCC patients after vascular endothelial growth factor (VEGF)‐targeted therapy [Citation12]. However, the efficacy of cabozantinib in other renal diseases has never been reported. Here, we focused on exploring its beneficial effects on GECs dysfunction under high glucose conditions.
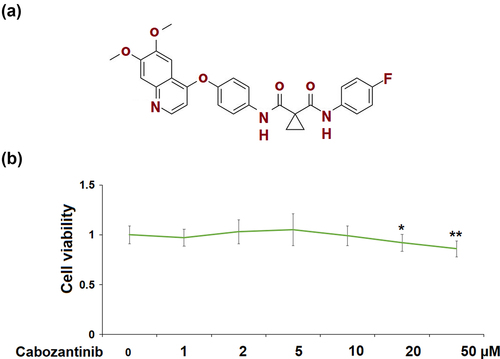
Figure 1. Cytotoxicity of Cabozantinib in human renal glomerular endothelial cells (hGECs). Cells were treated with Cabozantinib at various concentrations for 24 hours. (a) Molecular structure of Cabozantinib; (b) The Cell viability of Cabozantinib was determined by MTT assay, the OD value was analyzed (*, **, P < 0.05, 0.01 vs. Vehicle group).
2. Materials and methods
2.1 Cell culture, treatment, and transduction
The protocol of this study was approved by the independent Ethical Committee of Wuhan Hospital of Traditional Chinese Medicine. Human renal glomerular endothelial cells (hGECs) (ScienCell Research Laboratories, USA) were maintained in DMEM/F12 (Gibco, USA) containing 10% fetal bovine serum (FBS) (Gibco). The hGECs were grown in humidified air with 5% CO2 at 37°C. Cells were exposed to high glucose (30 mM) condition, treated with or without additional cabozantinib (5 or 10 μM) for 24 h. The hGECs were transduced with Ad-viral Egr-1, followed by stimulation with high glucose (30 mM) and cabozantinib (10 μM) for 24 h.
2.2 3-(4,5)-dimethylthiahiazo (-z-y1)-3,5-di-phenytetrazoliumromide (MTT) assay
An MTT assay kit (Beyotime) was used to assess hGECs viability. Briefly, the hGECs (5 × 10³ cells/well) were seeded in a 96-well plate and incubated with MTT (5 mg/ml) for 4 h. Then 150 μl dimethyl sulfoxide (DMSO) was used to solubilize the crystals. Optical density (OD) at 490 nm was examined to calculate cell viability.
2.3 MitoSOX red staining
Changes in mitochondrial ROS level were determined using MitoSOX red staining reagent (MolecularProbes, USA). The hGECs were loaded with MitoSOX Red in the dark for 10 min and washed twice with PBS. Mitochondrial ROS were then assessed and captured using a fluorescence microscope, followed by the determination of fluorescence intensity using Image J software [Citation13].
2.4 Glutathione Peroxidase (GSH-PX) activity detection
GSH-PX activity in hGECs was assessed by colorimetric method using a GSH-PX assay kit (Jiancheng Bioengineering Institute, Nanjing, China). Optical density (OD) at 412 nm was recorded using a SpectraMax microplate spectrophotometer (Molecular Devices, Sunnyvale, CA, USA) to assess GSH content.
2.5 RT-qPCR
Total RNAs obtained from hGECs using TRIzol reagent (Invitrogen) were subsequently reversely transcribed into cDNAs using a cDNA synthesis kit (Bio-Rad, USA). Afterward, the cDNAs were amplified using PCR with SYBR Green Real-time PCR Master Mix (TOYOBO, Japan). The relative expressions of Egr-1, VEGF, IL-6, MCP-1, eNOS were calculated with the 2−ΔΔCt method relative to the internal control GAPDH [Citation14]. The following primers were used: IL-6: 5’-ATGAACTCCTTCTCCACAAGCGC-3’ (Forward) and 5’-GAAGAGCCCTCAGGCTGGACTG-3’ (Reverse); VEGF: 5’-GAGGAGCAGTTACGGTCTGTG-3’ (Forward) and 5’-TCCTTTCCTTAGCTGACACTTGT-3’ (Reverse); MCP-1: 5’-CTCATAGCAGCC CCTTATTCC-3’ (Forward) and 5’-GATCACAGCTTCTTTGGGACACT-3’ (Reverse); Erg-1: 5’-GGTCAGTGCCTAGTGAGC-3’ (Forward) and 5’-GTGCCGCTGAGTAAATGGGA-3’ (Reverse); eNOS: 5’-TGATGG GAAGCGAGTGAAG-3’ (Forward) and 5’-ACTCATCCATAACAGACCC-3’ (Reverse); GAPDH: 5’-CATCATCCCTGCCTCTACTGG-3’ (Forward) and 5’-GTGG TTCGCTGTTGAAGTC-3’ (Reverse).
2.6 Western blot
Western blot was performed to assess the expression levels of eNOS, Egr-1, and VEGF in hGECs [Citation15]. Briefly, cellular lysates extracted from hGECs was separated by 10% sodium dodecyl sulfate-polyacrylamide gel electrophoresis (SDS-PAGE) gels, transferred onto polyvinylidene fluoride (PVDF) membranes, and incubated with primary antibodies and HRP-labeled secondary antibodies (eNOS: #32,027; Egr-1: #4154; GAPDH: # 5174; secondary antibodies #7074 and #7076, Cell Signaling Technology, USA). The protein bands were visualized by Quantity One software (Bio-Rad, USA).
2.7 Diaminofluorescein-2 diacetate (DAF-2 DA) staining
The NO level in hGECs was assessed using DAF-2 DA (Sigma-Aldrich, USA) staining for 45 min at 37°C. The fluorescence of product triazolofluorescein (DAF-2 T) was detected and the fluorescence intensity was analyzed using ImageJ software.
2.8 Enzyme-linked immunosorbent assay (ELISA)
The levels of IL-6, MCP-1, and VEGF in the cell culture fluid of hGECs were measured using the commercial ELISA kits (R&D Systems) according to the manufacturer’s instructions.
2.9 Statistical analysis
The SPSS 19.0 statistical software (SPSS Inc., USA) was used for data analysis. All the results were expressed as means ± SD. One-way ANOVA was used for comparisons among multi-group data, followed by the Tukey’s post-hoc test. A p-value < 0.05 was considered significant.
3. Results
In this study, we established an in vitro DN model using HG- stimulated hGECs to explore the potential benefits of cabozantinib on DN. Our results reveal that cabozantinib treatment ameliorated HG-induced oxidative stress and expression of VEGF and pro-inflammatory mediators. Furthermore, we found that cabozantinib rescued the HG-induced reduction in the expression of eNOS and production of NO. Importantly, we demonstrate that the protective effects of cabozantinib on HG- stimulated hGECs were mediated by Erg-1.
3.1 Cytotoxicity of cabozantinib in hGECs
In ), cell viability of hGECs did not differ between the control group and cabozantinib group at various concentrations (1, 2, 5, 10 μM), except for the 20 and 50 μM cabozantinib groups. In the following studies, 5 and 10 μM were used.
3.2 Cabozantinib ameliorated high glucose-induced oxidative stress in hGECs
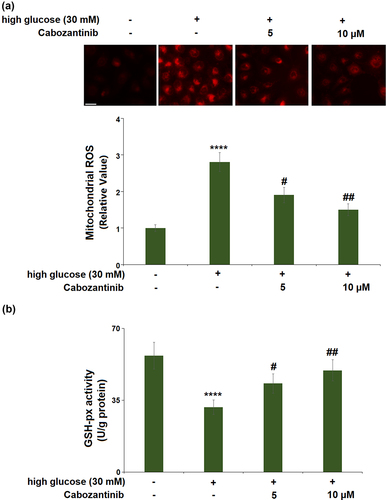
For mitochondrial ROS production ()), high glucose induced a 2.8-fold increase, whereas 5 or 10 μM cabozantinib showed significant reductions (0.68-fold and 0.54-fold). For the GSH-px activity ()), a 0.56-fold reduction was observed in the high glucose group, whilst cabozantinib (5 or 10 μM) caused 1.37- and 1.57-fold increases as compared to the high glucose group.
Figure 2. Cabozantinib ameliorated high glucose-induced oxidative stress in hGECs.
3.3 Cabozantinib ameliorated high glucose-induced reduction in the expression of eNOS and production of NO in hGECs
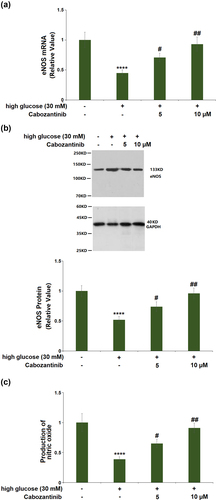
As shown in ), the mRNA of eNOS was decreased by 0.45-fold by treatment with high glucose medium, and the decrease was elevated by cabozantinib (5 or 10 μM) with a 1.58- or 2.07-fold change. Consistent with the PCR results, western blot showed that the decreased protein level of eNOS (0.52-fold) in the high glucose group was increased by 1.42- or 1.85-fold after treatment with 5 or 10 μM cabozantinib ()). Also, DAF-2 DA staining showed that the production of NO had a 0.39-fold reduction, which could be attenuated by 5 or 10 μM cabozantinib with a 1.67- or 2.33-fold change ()).
Figure 3. Cabozantinib ameliorated high glucose-induced reduction in the expression of eNOS and the production of NO in hGECs. (a). mRNA of eNOS; (b). Protein levels of eNOS; (c). Production of nitric oxide (****, P < 0.0001 vs. Vehicle group; #, ##, P < 0.05, 0.01 vs. high glucose group).
3.4 Cabozantinib inhibited the expression of VEGF against high glucose in hGECs
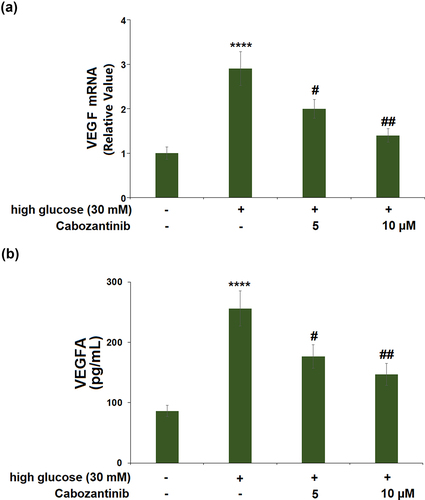
High glucose stimulation caused a significant 2.9-fold increase in the mRNA level of VEGF. Treatment with 5 or 10 μM cabozantinib caused 0.69-fold and 0.48-fold decreases in the VEGF mRNA level, compared with cells exposed to high glucose alone ()). Meanwhile, ELISA results demonstrate that exposure to high glucose led to the protein levels of VEGF being increased from 86.3 to 256.1 pg/mL, which was then reduced to 176.7 and 146.5 pg/mL by 5 or 10 μM cabozantinib with a 0.73- or 0.54-fold change ()).
Figure 4. Cabozantinib inhibited the expression of VEGF against high glucose in hGECs. (a) mRNA level of VEGF; (b) protein level of VEGF measured by ELISA (****, P < 0.0001 vs. Vehicle group; #, ##, P < 0.05, 0.01 vs. high glucose group).
3.5 Cabozantinib suppressed the expression of pro-inflammatory mediators against high glucose in hGECs
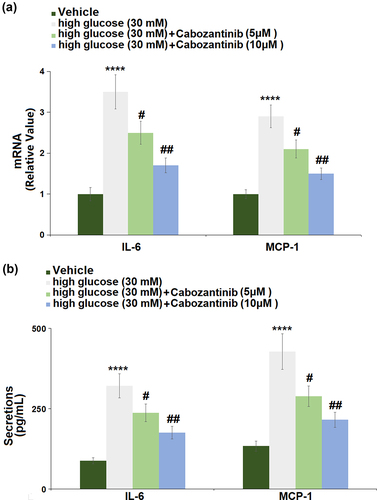
) shows the changes in mRNA levels of IL-6 and MCP-1 in hGECs. The hGECs grown in high glucose medium showed a significant increase in the mRNA levels of IL-6 (3.5-fold) and MCP-1 (2.9-fold), which could be remarkably abrogated by 5 or 10 μM cabozantinib. ) shows the changes in secretion levels of IL-6 and MCP-1, suggesting that high glucose-induced increases in the secretion levels of IL-6 (3.65-fold) and MCP-1 (3.20-fold) were attenuated by 5 or 10 μM cabozantinib.
Figure 5. Cabozantinib suppressed the expression of pro-inflammatory mediators against high glucose in hGECs. (a). mRNA of IL-6 and MCP-1; (b). Secretions of IL-6 and MCP-1 (****, P < 0.0001 vs. Vehicle group; #, ##, P < 0.05, 0.01 vs. high glucose group).
3.6 Cabozantinib reduced the expression of Egr-1 against high glucose in hGECs
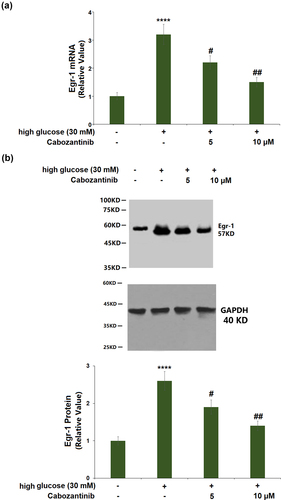
) shows a 3.2-fold increase in the mRNA of Egr-1 in high glucose-induced hGECs. Cabozantinib (5 or 10 μM)-treated hGECs showed a 0.69- or 0.47-fold reduction in the mRNA of Egr-1 when compared to hGECs exposed to high glucose alone. Similarly, the significantly increased protein level of Egr-1 (2.6-fold) in high glucose-induced hGECs was reduced by cabozantinib (5 or 10 μM) with a 0.73- or 0.54-fold change ()).
Figure 6. Cabozantinib reduced the expression of Egr-1 against high glucose in hGECs. (a). mRNA of Egr-1; (b). Protein of Egr-1 (****, P < 0.0001 vs. Vehicle group; #, ##, P < 0.05, 0.01 vs. high glucose group).
3.7 Overexpression of Egr-1 abolished the protective effects of cabozantinib against high glucose in hGECs
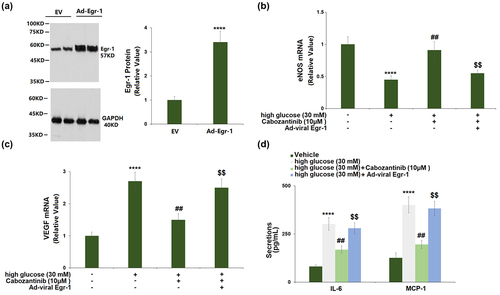
The transduction efficiency assay showed that Egr-1 expression was markedly increased by 3.4-fold in cells transduced with Ad-viral Egr-1, confirmed by Western blot ()). Transduction with Ad-viral Egr-1 resulted in a significant decrease in eNOS mRNA (0.60-fold) and a significant increase in VEGF mRNA (1.67-fold) when compared to the cells transduced with control Ad-viral in the presence of 10 μM cabozantinib (). In addition, the cabozantinib-caused reduction in the secretion of IL-6 and MCP-1 was attenuated by Ad-viral Egr-1 transduction ()).
Figure 7. Overexpression of Egr-1 abolished the protective effects of Cabozantinib against high glucose in hGECs. Cells were transduced with Ad-viral Egr-1, followed by stimulation with high glucose (30 mM) with Cabozantinib (10 μM) for 24 hours. (a). Western blot analysis revealed successful overexpression of Egr-1; (b). mRNA of eNOS; (c). mRNA level of VEGF; (d). Secretions of IL-6 and MCP-1 (****, P < 0.0001 vs. Vehicle group; ##, P < 0.01 vs. high glucose group; $$, P < 0.01 vs. High glucose+Ad-Egr-1 group).
4. Discussion
ECs dysfunction is characterized by several metabolic abnormalities: increased mitochondrial ROS overproduction, decreased NO bioavailability, accumulation of inflammatory factors, and extracellular matrix (ECM) proteins [Citation9]. Previous literatures have confirmed the vital role of mitochondria dysfunction in the progression of DN [Citation16]. Amongst the changes in mitochondria, the accumulation of mitochondrial ROS is the pivotal issue during persistent hyperglycemia [Citation17]. Overproduction of ROS in a hyperglycemic environment causes persistent oxidative damage, giving way to mitochondrial dysfunction, which further increases the production of ROS, thereby forming a vicious cycle in mitochondria [Citation18,Citation19]. We found that cabozantinib ameliorated high glucose-induced oxidative stress in hGECs with decreased production of mitochondrial ROS and increased GSH-PX activity.
NO, a free radical produced in almost all tissues, is a paracrine mediator exerting a variety of biological actions in ECs [Citation20]. Particularly, NO acts as an important regulator of renal function and controls medullary blood flow, glomerular ultrafiltration coefficient, and vascular tone [Citation21,Citation22]. NO production is transcriptionally or post-translationally regulated by three isoforms of NOS: eNOS, inducible NOS (iNOS), and neuronal (nNOS) [Citation23]. The eNOS gene has been considered to be involved in the progression of DN. In a diabetic state, ECs dysfunction results in reduced activation of eNOS, which in turn reduces the generation and bioavailability of NO [Citation5]. In addition, the eNOS uncoupling in ECs dysfunction also leads to overproduction of ROS, which further causes oxidative and inflammatory damage by upregulating adhesion molecules and proinflammatory mediators [Citation24]. Our results show that cabozantinib ameliorated high glucose-induced reduction in the expression of eNOS and the production of NO in hGECs.
ECs dysfunction also leads to an uncoupling of the VEGF-NO axis, resulting in the enhanced simulative effects of VEGF on cell proliferation and inflammatory response in ECs [Citation25,Citation26]. Therefore, in response to hyperglycemia, VEGF is increased in ECs and has a deleterious role in DN [Citation27]. Here, we found that VEGF expression was induced by high glucose in hGECs, which could be reversed by cabozantinib. Cabozantinib also suppressed the expressions of pro-inflammatory mediators, IL-6 and MCP-1, against high glucose in hGECs.
Egr-1 is a member of the EGR family of transcription-regulatory factors [Citation28]. Egr-1 is widely expressed in various renal cell types including renal ECs, tubular fibroblasts, and glomerular mesangial cells [Citation29]. Recent studies indicate Egr-1 contributes to the development of various kidney diseases by promoting renal inflammation and fibrosis [Citation30]. Notably, Egr-1 has been demonstrated to be involved in the progression of DN. For instance, it mediates the protective effect of the long noncoding RNA NONHSAG053901 on diabetic nephropathy through regulating renal inflammation [Citation31]. Klotho prevents cell proliferation and suppresses the excessive extracellular matrix (ECM) production in high glucose-treated human mesangial cells, which is partially attributed to Egr-1 downregulation [Citation32]. Lipoxins reverse the progression of diabetic kidney disease with improved collagen deposition, mesangial expansion, and albuminuria through regulating the Egr-1 network [Citation33]. Here, we found that cabozantinib reduced the expression of Egr-1, while its overexpression abolished the protective effects of cabozantinib against high glucose in hGECs, implying that the effects of cabozantinib were mediated by Egr-1.
However, the limitation of the current study should be mentioned. We only examined the beneficial effects of cabozantinib against high glucose-induced hGECs injury in an in vitro hGECs cell model. It should be noted that the pathological mechanism of DN is complicated. A diversity of risk factors including genetics and aging are reportedly involved. Further in vivo investigations using animal models are necessary to verify the pharmacological function of cabozantinib in DN. Secondly, multiple signaling pathways have been reported to participate in the initiation and development of DN. In this study, we report that the beneficial effects of cabozantinib are mediated by Egr-1. However, it is still unknown whether the function of Egr-1 is direct or indirect. A previous study showed that Egr-1 deficiency attenuates renal inflammation in Egr1−/− mice. Egr-1 deficiency inhibited the expressions of TNF-α, MCP-1, and NLRP3 inflammasome. Furthermore, decreased NF-κB activity is also observed in Egr1−/− mice [Citation34]. Egr-1 usually acts with the transcription factor NF-κB in synergy for the transcription of pro-inflammatory mediators [Citation35]. Therefore, the interaction between Egr-1 and NF-κB in DN needs to be further investigated.
Conclusion
In conclusion, cabozantinib protected hGECs against oxidative stress, NO deficiency, and inflammation in response to high glucose exposure via regulating Egr-1. These findings suggest that the administration of cabozantinib might act as adjuvant therapy to the management of DN in patients with diabetes.
Consent to publication
All the authors agreed to publish this article.
Author contribution
Hanlu Ye, Jingjing Yan, and Lei Zhou made a substantial contribution to experimental design and data analysis; Hanlu Ye, Jingjing Yan, Qiong Wang, and Hui Tian made a substantial contribution to investigation and data collection; Lei Zhou drafted the manuscript. All authors have read and approved the manuscript.
Acknowledgements
This study was supported by the “Wuhan hospital of traditional Chinese Medicine”.
Disclosure statement
No potential conflict of interest was reported by the author(s).
Data availability statement /availability of data materials
Data of this study are available upon reasonable request to the corresponding authors.
Additional information
Funding
References
- Raptis AE, Viberti G. Pathogenesis of diabetic nephropathy. Exp Clin Endocrinol Diabetes. 2001;109(2):S424–437.
- Kanwar YS, Wada J, Sun L, et al. Diabetic nephropathy: mechanisms of renal disease progression. Exp Biol Med (Maywood). 2008;233(1):4–11.
- Fukami K, Yamagishi S, Ueda S, et al. Role of AGEs in diabetic nephropathy. Curr Pharm Des. 2008;14(10):946–952.
- Volpe CMO, Villar-Delfino PH, Dos Anjos PMF, et al. Cellular death, reactive oxygen species (ROS) and diabetic complications. Cell Death Dis. 2018;9(2):119.
- Cheng H, Harris RC. Renal endothelial dysfunction in diabetic nephropathy. Cardiovasc Hematol Disord Drug Targets. 2014;14(1):22–33.
- Calles-Escandon J, Cipolla M. Diabetes and endothelial dysfunction: a clinical perspective. Endocr Rev. 2001;22(1):36–52.
- Satchell SC, Braet F. Glomerular endothelial cell fenestrations: an integral component of the glomerular filtration barrier. Am J Physiol Renal Physiol. 2009;296(5):F947–956.
- Fu J, Lee K, Chuang PY, et al. Glomerular endothelial cell injury and cross talk in diabetic kidney disease. Am J Physiol Renal Physiol. 2015;308(4):F287–297.
- Lassen E, Daehn IS. Molecular Mechanisms in Early Diabetic Kidney Disease: glomerular Endothelial Cell Dysfunction. Int J Mol Sci. 2020;21(24):9456.
- Lacy SA, Miles DR, Nguyen LT. Clinical Pharmacokinetics and Pharmacodynamics of Cabozantinib. Clin Pharmacokinet. 2017;56(5):477–491.
- Abdelaziz A, Vaishampayan U. Cabozantinib for the treatment of kidney cancer. Expert Rev Anticancer Ther. 2017;17(7):577–584.
- Schmidinger M, Danesi R. Management of Adverse Events Associated with Cabozantinib Therapy in Renal Cell Carcinoma. Oncologist. 2018;23(3):306–315.
- Zhang Y-J, Wu Q. Sulforaphane protects intestinal epithelial cells against lipopolysaccharide-induced injury by activating the AMPK/SIRT1/PGC-1 pathway. Bioengineered. 2021;12(1):4349–4360.
- Chen HM, Jin GJ, Okonkwo CC. Downregulation of Salusin-β protects renal tubular epithelial cells against high glucose-induced inflammation, oxidative stress, apoptosis and lipid accumulation via suppressing miR-155-5p. Bioengineered. 2021;12(1):1.
- Liu R, Guan S, Gao Z, et al. Pathological Hyperinsulinemia and Hyperglycemia in the Impaired Glucose Tolerance Stage Mediate Endothelial Dysfunction Through miR-21, PTEN/AKT/eNOS, and MARK/ET-1 Pathways. Front Endocrinol (Lausanne). 2021;12:644159.
- Yang S, Han Y, Liu J, et al. Mitochondria: a Novel Therapeutic Target in Diabetic Nephropathy. Curr Med Chem. 2017;24(29):3185–3202.
- Lindblom R, Higgins G, Coughlan M, et al. Targeting Mitochondria and Reactive Oxygen Species-Driven Pathogenesis in Diabetic Nephropathy. Rev Diabet Stud. 2015;12(1–2):134–156.
- Sifuentes-Franco S, Padilla-Tejeda DE, Carrillo-Ibarra S, et al. Oxidative Stress, Apoptosis, and Mitochondrial Function in Diabetic Nephropathy. Int J Endocrinol. 2018;2018:1875870.
- Bondeva T, Wolf G. Reactive oxygen species in diabetic nephropathy: friend or foe? Nephrol Dial Transplant. 2014;29(11):1998–2003.
- Cyr AR, Huckaby LV, Shiva SS, et al. Nitric Oxide and Endothelial Dysfunction. Crit Care Clin. 2020;36(2):307–321.
- Zatz R, de Nucci G. Effects of acute nitric oxide inhibition on rat glomerular microcirculation. Am J Physiol. 1991;261(2 Pt 2):F360–363.
- Natarajan M, Habib SL, Reddick RL, et al. Endothelial cell-specific overexpression of endothelial nitric oxide synthase in Ins2Akita mice exacerbates diabetic nephropathy. J Diabetes Complications. 2019;33(1):23–32.
- Bogdan C. Nitric oxide synthase in innate and adaptive immunity: an update. Trends Immunol. 2015;36(3):161–178.
- Balakumar P, Chakkarwar VA, Krishan P, et al. Vascular endothelial dysfunction: a tug of war in diabetic nephropathy? Biomed Pharmacother. 2009;63(3):171–179.
- Hood JD, Meininger CJ, Ziche M, et al. VEGF upregulates ecNOS message, protein, and NO production in human endothelial cells. Am J Physiol. 1998;274(3):H1054–1058.
- Nakagawa T, Sato W, Kosugi T, et al. Uncoupling of VEGF with endothelial NO as a potential mechanism for abnormal angiogenesis in the diabetic nephropathy. J Diabetes Res. 2013;2013:184539.
- Majumder S, Advani A. VEGF and the diabetic kidney: more than too much of a good thing. J Diabetes Complications. 2017;31(1):273–279.
- O’Donovan KJ, Tourtellotte WG, Millbrandt J, et al. The EGR family of transcription-regulatory factors: progress at the interface of molecular and systems neuroscience. Trends Neurosci. 1999;22(4):167–173.
- Sukhatme VP. The Egr transcription factor family: from signal transduction to kidney differentiation. Kidney Int. 1992;41(3):550–553.
- Ho LC, Sung JM, Shen YT, et al. Egr-1 deficiency protects from renal inflammation and fibrosis. J Mol Med (Berl). 2016;94(8):933–942.
- Peng W, Huang S, Shen L, et al. Long noncoding RNA NONHSAG053901 promotes diabetic nephropathy via stimulating Egr-1/TGF-beta-mediated renal inflammation. J Cell Physiol. 2019;234(10):18492–18503.
- Li Y, Hu F, Xue M, et al. Klotho down-regulates Egr-1 by inhibiting TGF-beta1/Smad3 signaling in high glucose treated human mesangial cells. Biochem Biophys Res Commun. 2017;487(2):216–222.
- Brennan EP, Mohan M, McClelland A, et al. Lipoxins regulate the early growth response-1 network and reverse diabetic kidney disease. J Am Soc Nephrol. 2018;29(5):1437–1448.
- Ho LC, Sung JM, Shen YT, et al. Egr-1 deficiency protects from renal inflammation and fibrosis. J Mol Med (Berl). 2016;94(8):933–942.
- Bavendiek U, Libby P, Kilbride M, et al. Schonbeck U Induction of tissue factor expression in human endothelial cells byCD40 ligand is mediated via activator protein 1, nuclear factor kappa B, and Egr-1. J Biol Chem. 2002;277(28):25032–25039.