
ABSTRACT
Nonalcoholic fatty liver disease (NAFLD) is highly possible to progress to cirrhosis, malignancy, and liver failure through fibrogenesis. The enormous potential of pathogenetic and therapeutic targets in NAFLD has been revealed. This study aimed to explore novel factors potentially indicating or mediating NAFLD progression. Multiple bulk and single-cell RNA sequencing datasets were used, in which landscapes of cell populations were clarified to characterize immune cell infiltration. Significantly high infiltration of macrophages (MPs) was discovered during NAFLD progression. Samples in bulk NASH datasets were regrouped by MP level. Highly differentially expressed genes (DEGs) were identified in the Ctrl vs. NASH comparison, low MP vs. high MP comparison, and the weighted gene co-expression network analysis (WGCNA) clusters. Eight hub genes were identified as promising targets by protein–protein interaction analysis and validated in fibrosis progression, microRNA (miR)–protein interactions were predicted, and the hub genes were verified in a free fatty acid (FFA)-induced macrophage injury model. The results showed that Gasdermin D (GSDMD) was upregulated with fibrosis progression in NAFLD and was associated with macrophage infiltration. In addition, a potential regulator (miR-4715-3p) was correlated with GSDMD. The miR-4715-3p/GSDMD axis potentially modulates macrophage-associated immunity and indicates fibrosis progression in NAFLD.
Graphical Abstract
Highlight
1. Macrophage infiltration is potentially correlated with NAFLD progression.
2. Macrophage-associated key gene GSDMD is upregulated in NAFLD progression.
3. has-miR-4715-3p and GSDMD are parallelly activated in fatty acid-induced macrophage injury.
4.has-miR-4715-3p/GSDMD axis potentially modulates macrophage-associated immunity and indicates fibrosis progression in NAFLD.
1. Introduction
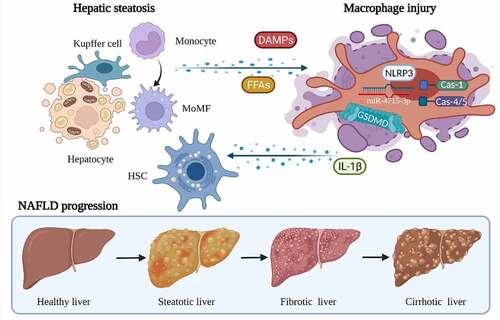
onalcoholic fatty liver disease (NAFLD) is one of the most common chronic liver diseases worldwide. Lipid deposition and steatosis are independent causes of NAFLD, independent of drug-related, alcohol-related, or genetic risks. The pathogenesis and progression of NAFLD are fundamentally mediated by the complex interactions among steatosis, fibrosis, and inflammation [Citation1]. Although early symptoms rarely appear in nonalcoholic steatohepatitis (NASH) patients, chronic liver cirrhosis eventually leads to liver failure or hepatocellular carcinoma (HCC). Notably, multiple types of immune modulation occur during NAFLD progression. As executors and directors in the immune microenvironment, immune cells, especially macrophages and T cells, are requisite factors in the pathogenesis, cirrhogenesis, metabolic compensation, and progression of NAFLD [Citation2,Citation3].
In almost all chronic liver diseases, fibrosis occurs and progresses with inflammatory reactions, which are involved in liver macrophage modulation. Systematically, the liver macrophage population generally consists of Kupffer cells (KCs) and monocyte-derived macrophages (MoMFs). Liver macrophages play an essential role in fibrogenesis through interactions with hepatic stellate cells (HSCs) [Citation4]. As a feedback regulatory mechanism, chemokines and cytokines secreted by HSCs enhance macrophage infiltration and expansion, which promote the fibrotic phenotypes and survival of HSCs. Passively activated M2 macrophages are associated with liver injury in NAFLD and mediate fibrotic responses conducive to liver remodeling and regeneration by secreting transforming growth factor-β (TGF-β) and platelet-derived growth factor (PDGF) [Citation5]. Although crucial roles of macrophages in NAFLD and other inflammatory liver diseases have gradually been revealed, the exact mechanisms of macrophage involvement in the pathogenesis and progression of these diseases remain unclear. In recent decades, transcriptome analysis was rapidly increased and has provided logical and scientific guidance to traditional biological studies. Fundamentally, computational analysis based on high-throughput datasets can indicate both target genes and biological processes regarding specific research goals [Citation6,Citation7]. Therefore, in NAFLD with a chronic fibrosis progression, bioinformatics analysis would bring out unique advantages to understand disease characteristics and therapeutic targets.
The hypothesis of this study is that miR-4715-3p/GSDMD axis associating macrophage infiltration potentially indicates NAFLD progression. Based on the analysis of high-throughput bulk/single-cell RNA sequencing datasets, this study aims to reveal immune cell landscapes in NAFLD livers during fibrosis progression. Thereby, through further MP-associated analyses, the miR-4715-3p/GSDMD axis could be determined as a potential mediator in liver macrophages and cirrhosis progression.
2. Materials and methods
2.1. Data resources and DEG analysis
In this study, expression profile datasets from bulk RNA-sequencing and single-cell RNA (scRNA)-sequencing analyses were downloaded from the Gene Expression Omnibus (GEO) database (http://www.ncbi.nlm.nih.gov/geo). Basic information is listed in . Probes from the raw data were matched with the official gene symbols with the DAVID online tool (https://david.ncifcrf.gov/)[Citation8] and noncoding RNAs were excluded. Differentially expressed gene (DEG)-related analyses were performed using R Studio (limma package) [Citation9]. Fold change (FC) >2 and p < 0.01 were used as the statistical criteria to identify significant DEGs. In addition, overlapping gene clusters were identified by the generation of Venn diagrams (http://bioinformatics.psb.ugent.be/webtools/Venn/) [Citation10].
Table 1. Human dataset resources
2.2. Immune cell infiltration analysis and dataset regrouping
To investigate immune cell infiltration, raw data from bulk RNA-seq datasets were included and evaluated by multiple computational methods. The xCell package (https://xcell.ucsf.edu/) [Citation11] in R Studio was applied, and the results were compared and validated with the CIBERSORT (https://cibersort.stanford.edu) [Citation12] and EPIC (https://github.com/GfellerLab/EPIC) [Citation13] methods. Then, raw data from 74 NASH liver samples in the GSE164760 dataset were classified into the high MP and low MP groups based on the cell-type enrichment scores from Xcell. Thereby, DEG-related analyses were performed using R Studio (limma package).
2.3. Weighted gene co-expression network analysis (WGCNA)
To outline the gene expression patterns in multiple samples, the WGCNA package (http://www.genetics.ucla.edu/labs/horvath/CoexpressionNetwork/Rpackages/WGCNA), which is a comprehensive method used to cluster co-expressed genes and compare the associations between modules and specific traits, was used with R Studio [Citation14]. The expression matrix of NASH samples in the GSE164760 dataset regrouped by MP level was analyzed by WGCNA. The correlation analysis implemented in the WGCNA package is based on the Pearson method, and specific parameters (min Module Size = 30, reassign Threshold = 0, and merge Cut Height = 0.25) were used to run the program. The clusters of co-expressed genes were then displayed as modules labeled in multiple colors, with correlation coefficient values and significance (p values).
2.4. Functional enrichment and protein–protein interaction (PPI) analysis
Functional enrichment was analyzed and classified primarily according to Kyoto Encyclopedia Genes and Genomes (KEGG) pathways [Citation15] and Gene Ontology (GO) terms [Citation16]. With the KEGG Orthology-Based Annotation System (KOBAS) 3.0 web server (http://kobas.cbi.pku.edu.cn/kobas3) [Citation17] and Gene Set Enrichment Analysis (GSEA) software (https://www.gsea-msigdb.org/gsea) [Citation18], highly relevant functional clusters were identified, and data were plotted. PPI analysis was conducted with the STRING web tool (https://string-db.org/) [Citation19], and the topological network was then constructed with Cytoscape software (version 3.8.2) [Citation20]. Then, hub clusters and genes were identified using the MCODE plugin (degree cutoff = 2, node score cutoff = 0.2, and K-cor = 2).
2.5. Identification of miRNA–protein interactions
Databases (MirWalk: www.mirwalk.umm.uni-heidelberg.deCitation21; TargetScan: www.targetscan.orgCitation22; mirDB: www.mirdb.org [Citation23]; and miRTarBase: www.mirtarbase.cuhk.edu.cn) [Citation24] were used for prediction of miRNA–mRNA interactions. Associated miRNA alternatives were screened out by inputting mRNA targets. Results were filtered with p < 0.05 and downloaded from websites.
2.6. Cell culture and treatment
The human monocyte line THP-1 was purchased from the National Collection of Authenticated Cell Cultures (Shanghai, China) and cultured in RPMI 1640 medium supplied with 10% FBS (Gibco, Australia) in an incubator with 5% CO2 at 37°C. Macrophage differentiation of THP-1 monocytes was induced with 100 nmol/L phorbol 12-myristate-13-acetate (PMA) (Sigma–Aldrich, USA) for 48 h. Palmitic acid (PA) and oleic acid (OA) (both from Sigma–Aldrich, USA) were dissolved at a 2:1 ratio (final concentration of 30 µM) in RPMI 1640 medium supplemented with 0.1 M NaOH and 0.1% BSA (both from Sigma–Aldrich, USA) [Citation25].
2.7. RNA quantification
Total RNA was extracted from cultured cells using TRIzol® reagent (Invitrogen; Thermo Fisher Scientific, USA). Reverse transcription was conducted with a PrimeScript™ RT Reagent Kit (Takara Biotechnology Co., Ltd.), and real-time quantification was subsequently performed using a SYBR® Premix Ex Taq Kit (Takara Biotechnology Co., Ltd.). The relative RNA expression levels were calculated using the 2‑ΔΔCt method [Citation26]. The primer pairs used in this study are listed in Supplementary Table 1.
2.8. Statistical analysis
SPSS 26.0 (SPSS Statistics, USA) was used for general statistical analysis. GraphPad Prism 9.0 software (GraphPad Software, USA) and R Studio were used to generate plots. Significant differences were identified using one‑way ANOVA with the Bonferroni post hoc test. Pearson correlation analysis was performed to calculate correlation coefficients. Data are presented as the mean ± SEM values. p < 0.05 indicated a statistically significant difference (labeled ‘*’).
3. Results
We hypothesized that miR-4715-3p/GSDMD axis may play as a mediator for macrophage infiltration and NAFLD progression. Multiple RNA-seq datasets were included in this study, and therefore, immune infiltration and hub genes were determined. GSDMD was identified as the key factor both associated with high macrophage infiltration and NAFLD progression. Predicted as a regulator to GSDMD, miR-4715-3p was validated in FFA-induced macrophage injury, which was significantly correlated with GSDMD.
3.1. Identification of DEGs and immune cell landscape in NASH livers
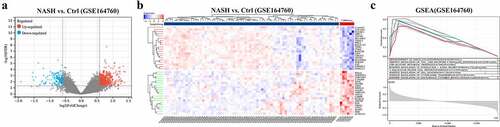
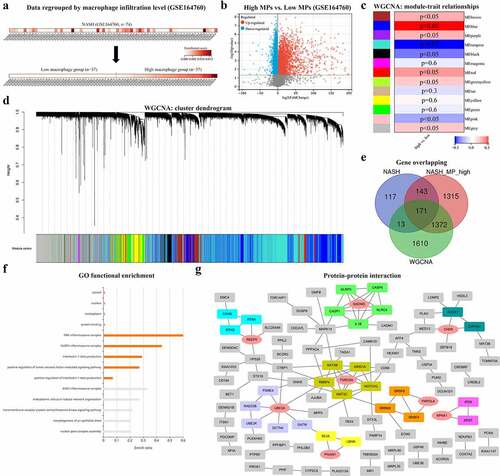
The overall flow chart of the technical paths followed in this study is shown in . In 74 NASH and 6 healthy control liver samples, DEGs were identified as genes with |log2 (fold change)| > 1.5 and p < 0.05 (); the DEGs comprised 444 upregulated genes and 83 downregulated genes. The top-ranked DEGs were displayed in a clustering heatmap. The top 10 upregulated genes were C1orf162, COL10A1, NUCKS1, SPPL3, ZNF362, KIAA0831 (ATG14), VDAC3, PPIL2, KIAA1147 (DENND11), and TIPLR. The top 10 downregulated genes were PDIA4, SERPING1, CDK2AP2, C19orf60, NT5C, BLVRB, ASPA, MRPL41, GALR3, and ADRA1B. GSEA was then used to perform functional enrichment analysis on the upregulated gene cluster and visualize the results. Among the leading enrichment patterns, biological processes associated with immune cells (Th cells and macrophages) were revealed to be statistically significant ().
Figure 1. PRISMA flow.
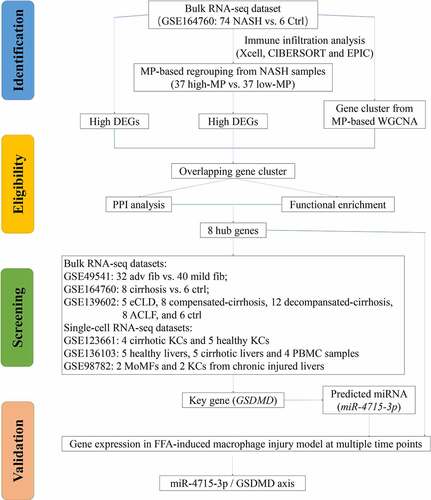
Figure 2. (a) Both significantly up- and downregulated DEGs were screened out from GSE164760 and displayed in the volcano plot. (b) Top significantly up- and downregulated genes were displayed in a heatmap. (c) Functional enrichment was analyzed with GSEA. p < 0.05 is regarded as statistical significance.
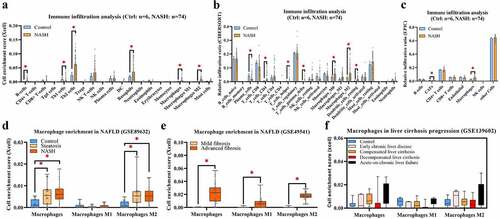
Accordingly, Xcell, CIBERSORT, and EPIC were applied to investigate and compare immune cell infiltration in NASH. Excluding nonimmune cells, the main myeloid cells and lymphocytes were evaluated and displayed. As shown in , the infiltration levels of B cells, Th2 cells, basophils, MPs, and M2-MPs were significantly increased in the NASH group compared with the control group. In contrast, the infiltration level of Th1 cells was decreased. As shown in , the infiltration levels of CD4+ T cells, T helper cells, gamma delta T cells, M0-MPs, and M2-MPs were significantly increased in the NASH group compared with the control group. In contrast, the infiltration level of plasma cells was decreased. As shown in , the infiltration levels of fibroblasts and MPs were increased. These findings conclusively show that MP infiltration is commonly elevated in NASH livers compared with healthy livers. To further explore the correlations between MP infiltration and cirrhosis progression in NAFLD, MP clusters (total MPs, M1-MPs, and M2-MPs) were evaluated with xCell in multiple RNA-seq datasets (GSE89632, GSE49541, and GSE139602). Increasing trends in infiltration were found for both steatosis () and cirrhosis progression ( and f).
Figure 3. Immune infiltration of GSE164760 is assessed with Xcell (a), CIBERSORT (b), and EPIC (c). Enrichment of MP clusters (total MP, M1-MP, and M2-MP) from GSE89632 (d), GSE49541 (e), and GSE139602 (f) are shown in plots. p < 0.05 (‘*’) is regarded as statistical significance.
3.2. The identification of macrophage - associated hub genes in NAFLD progression
Based on the xCell scores of MPs, 74 NASH liver samples from GSE164760 were divided into the high-MP (n = 37) and low-MP (n = 37) groups (). The DEGs were then sorted and are shown in . In addition, WGCNA was conducted to generate gene coexpression modules, from which the module–trait relationships () and cluster dendrograms () were generated. Considering both the correlation coefficients and p values, the MEblue module, with 3166 genes, was identified. After overlapping three gene clusters, 171 genes were identified as the most significantly upregulated macrophage-associated genes in NASH livers (). Then, GO enrichment analysis was carried out with these 171 genes, and the results are shown in ; the terms NLRP3 inflammasome, interleukin-1 beta (IL-1β), and tumor necrosis factor (TNF) were found to be significantly enriched. A PPI network was constructed to visualize functional interactions. Hub clusters and seed genes were also identified ().
Figure 4. (a) NASH samples of GSE164760 are grouped with MP ES from Xcell (low MP: ES = 0 and high MP >0). (b) Both significantly up- and downregulated DEGs were screened out from regrouped NASH samples of GSE164760 and displayed in the volcano plot. MP-associated gene cluster is selected with WGCNA. Module–trait relationships (c) and cluster dendrogram (d) are shown in charts. (e) 171 overlapping genes are generated from high DEGs of GSE164760 and regrouped NASH samples, as well as WGCNA gene cluster. GO enrichment analysis (f) and PPI analysis (g) are carried out from 171 overlapping genes. Hub genes are labeled in red and round shape. p < 0.05 is regarded as statistical significance.
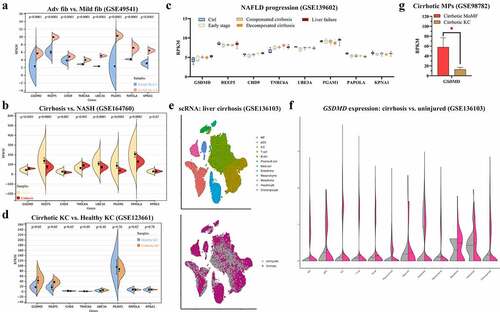
To assess clinical correlations, the expression levels of eight hub/seed genes (GSDMD, REEP5, CHD9, TNRC6A, UBE3A, PGAM1, PAPOLA, and KPNA1) were verified on bulk RNA-seq datasets (GSE49541, GSE164760, and GSE139602) and single-cell RNA-seq datasets (GSE123661, GSE136103, and GSE98782). All eight genes were upregulated in NASH livers at advanced fibrosis stages compared with mild fibrosis stages (). In contrast to NASH livers, GSDMD and TNRC6A were upregulated in cirrhotic livers (). Among all stages of progression, a continuously increasing trend in GSDMD and TNRC6A expression was identified (Figure). At the single-liver MP level, GSDMD was significantly upregulated in cirrhotic KCs (). The distribution of cell populations in NAFLD-related cirrhosis is shown in . After single-cell analysis, GSDMD was found to be upregulated in the liver MP population (). Moreover, among macrophages in cirrhotic livers, monocyte-derived macrophages (MoMFs) expressed more GSDMD than KCs (). These results indicate that GSDMD may not only play crucial roles as a biomarker for NAFLD progression but also function through liver macrophages.
Figure 5. Expressions of eight hub genes are compared, respectively, from GSE49541 (a), GSE1647560 (b), GSE139602 (c), and GSE123661 (d). (e) Distribution of cell populations and disease conditions are generated from GSE136103 with tSNE. (f) Expression of GSDMD is shown in multiple cell populations from GSE136103. p < 0.05 is regarded as statistical significance.
3.3. Correlative upregulation of miR-4715-3p and GSDMD in FFA-induced macrophage injury
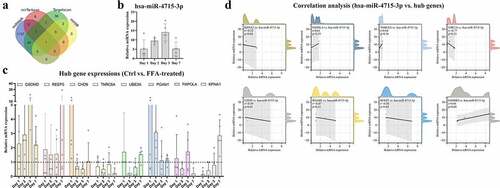
By searching an online database, multiple miRNA clusters highly correlated with GSDMD were identified. Then, hsa-miR-4715-3p was found in all miRNA clusters (). To mimic immune modulation in NAFLD, an in vitro model of FFA-induced macrophage injury was applied. Then, THP-1 cells were treated sequentially with PMA to induce differentiation into macrophages and with FFA solution for 1 week (the cytotoxicity of FFA in THP-1-derived macrophages is shown in Supplementary Figure 1). MoMFs were harvested at sequential time points (on the first, second, third, and seventh days) for RNA quantification. The expression levels of hsa-miR-4715-3p () and the eight hub genes () are shown at different time points. hsa-miR-4715-3p and GSDMD were generally upregulated after FAA treatment, and their expression peaked on the third day. In contrast, only REEP5 was upregulated at all time points. Therefore, Pearson correlation analysis was conducted on hsa-miR-4715-3p and the hub genes (), and GSDMD expression was found to be significantly positively correlated with hsa-miR-4715-3p expression (R = 0.96, p = 0.04). The results indicate that co-expression of miR-4715-3p and GSDMD is significantly induced in response to FFA stimulation in macrophages.
Figure 6. (a) hsa-miR-4715-3p is screened out from GSDMD-associated miRNAs. Expressions of hsa-miR-4715-3p (b) and eight hub genes (c) in FFA-treated THP1-derived macrophages are displayed. (d) Pearsoncorrelation analysis is conducted,respectively, between hsa-miR-4715-3p and eight hub genes. p < 0.05 is regarded as statistical significance.
4. Discussion
NASH is considered an inflammatory subtype of NAFLD with steatosis and evidence of hepatocyte injury and multiple immune cell interactions [Citation27]. Furthermore, fibrosis consistently occurs with hepatic cell injury and gradually progresses to cirrhosis, which results in hepatocarcinoma and liver failure [Citation28]. Generally, steatosis and liver function can be measured by serological and imaging approaches. However, liver fibrosis could historically be assessed only by biopsy, which is sensitive and accurate but results in unavoidable injury and pain in patients [Citation29]. Currently, the most effective noninvasive methods are ultrasonic transient elastography (for example, fiber scanning) and magnetic resonance elastography. Moreover, noninvasive estimation systems can evaluate the fibrosis stage in patients without biopsy, with the NAFLD fibrosis score and fibrosis-4 index (FIB-4) commonly used. The complex pathophysiological mechanism of NASH progression remains unrevealed [Citation30,Citation31]. Currently, multiple therapies aimed at several targets, such as changes in the microbiome and intestinal permeability, oxidative stress, insulin resistance, apoptosis, lipotoxicity, inflammation, bile acid metabolism, and fibrogenesis. Given that the therapeutic effects of traditional drugs on NASH progression are poor, the discovery of disease targets and research on targeted therapies are of great importance [Citation32]. Generally, liver macrophages (including KCs and MoMFs) play pivotal roles in the progression and resolution of fibrosis. With the development of fibrosis, injury-induced inflammation further enhances macrophage recruitment and HSC activation [Citation33]. In addition, a variety of matrix metalloproteinases (MMP-9, MMP-12, and MMP-13) secreted by liver macrophages participate in matrix degradation, thus contributing to the alleviation of liver injury and fibrosis [Citation34,Citation35].
The initial goal of this study was to characterize immune cell infiltration and identify progression-related mediators in NAFLD. Bulk and single-cell RNA sequencing datasets of NASH and fibrosis progression were introduced as basic data sources. Then, multiple bioinformatic methods and databases were used to reveal the immune cell landscape and important factors. Of note, a novel method of dataset regrouping was developed in this study based on xCell and WGCNA to identify macrophage-associated DEGs. Subsequently, hub genes were identified from the PPI network. Further screening and validation were carried out with single-cell RNA-seq datasets and a model of FFA-induced macrophage injury. As a result, GSDMD and hsa-miR-4715-3p were found to be co-upregulated, indicating NAFLD progression.
GSDMD is a key pyroptotic substrate of inflammation-triggered caspase modules. GSDMD initiates pyroptosis directly via caspase-1-induced cleavage. Moreover, GSDMD-related pyroptosis mainly occurs in macrophages and is directly mediated by inflammasomes [Citation36,Citation37]. In addition to pyroptotic factors (caspase-1/-4 and IL-1β), NLRP3 and NLRC4, which act as classical regulators of inflammasomes [Citation38], were also included in the final gene cluster. Accordingly, inflammasome-induced pyroptosis is considered a crucial macrophage-fate-accompanying NAFLD progression. In addition, miRNA–protein interaction analysis revealed that hsa-miR-4715-3p might act as a potential upstream regulator of GSDMD. Previous studies have revealed multiple roles and function of several microRNAs in NAFLD and liver fibrosis [Citation39–42]. According to a literature review, hsa-miR-4715-3p has been reported in only a few cancer studies [Citation43,Citation44]. In conclusion, the miR-4715-3p/GSDMD axis may be a novel signaling pathway that mediates not only macrophage functions but also NAFLD progression. Although this study provided robust evidence at the transcriptome level, further investigations are required to validate the functions of the GSDMD protein as an executor of inflammasome-mediated pyroptosis.
However, this study is mostly based on RNA-seq datasets and computational analysis, leading to inevitable limitations. Baseline levels and batch effects of different clinical cohorts could not be entirely adjusted, referring to statistical biases. Moreover, molecular validations were included but not emphasized in this study. Hence, to determine the exact relationship between GSDMD and hsa-miR-4715-3p, more molecular studies are required.
5. Conclusions
During fibrosis progression in NAFLD, the macrophage infiltration and highly associated gene – GSDMD – are elevated. The hsa-miR-4715-3p is upregulated in FFA-induced macrophage injury and parallelly altered by GSDMD expression. Thus, the macrophage-associated miR-4715-3p/GSDMD axis potentially indicates fibrosis progression in NAFLD.
Availability of data and materials
The datasets used and analyzed in the current study are available from the corresponding author on reasonable request.
Author contributions
Xiurong Cai and Yu Shen performed bioinformatic analysis. Shuai Chen and Yu Liu carried out biological experiments. Adrien Guillot and Frank Tacke worked as academic counselors in this study. Liming Tang revised the manuscript. Hanyang Liu designed the whole study and wrote the original paper.
Supplemental Material
Download Zip (603.6 KB)Acknowledgments
This research was supported by Nanjing Medical University and Charité Universitätsmedizin Berlin. Bioinformatic data materials were obtained from multiple public databases. All biological experiments were conducted in laboratory platform of the Affiliated Changzhou No. 2 People’s Hospital. The graphical abstract was created with Biorender.com.
Disclosure statement
No potential conflict of interest was reported by the authors.
Supplementary material
Supplemental data for this article can be accessed here
Additional information
Funding
Related Research Data
References
- Byrne CD, Targher G. NAFLD: a multisystem disease. J Hepatol. 2015;62:S47–64.
- Cobbina E, Akhlaghi F. Non-alcoholic fatty liver disease (NAFLD) – pathogenesis, classification, and effect on drug metabolizing enzymes and transporters. Drug Metab Rev. 2017;49:197–211.
- Eslam M, Valenti L, Romeo S. Genetics and epigenetics of NAFLD and NASH: clinical impact. J Hepatol. 2018;68:268–279.
- Tacke F, Zimmermann HW. Macrophage heterogeneity in liver injury and fibrosis. J Hepatol. 2014;60:1090–1096.
- Wynn TA, Vannella KM. Macrophages in tissue repair, regeneration, and fibrosis. Immunity. 2016;44:450–462.
- Udhaya Kumar S, Thirumal Kumar D, Bithia R, et al. Analysis of differentially expressed genes and molecular pathways in familial hypercholesterolemia involved in atherosclerosis: a systematic and bioinformatics approach. Front Genet. 2020;11:734.
- Udhaya Kumar S, Saleem A, Thirumal Kumar D, et al. A systemic approach to explore the mechanisms of drug resistance and altered signaling cascades in extensively drug-resistant tuberculosis. Adv Protein Chem Struct Biol. 2021;127:343–364.
- Huang da W, Sherman BT, Lempicki RA. Systematic and integrative analysis of large gene lists using DAVID bioinformatics resources. Nat Protoc. 2009;4:44–57.
- Ritchie ME, Phipson B, Wu D, et al. limma powers differential expression analyses for RNA-sequencing and microarray studies. Nucleic Acids Res. 2015;43:e47.
- Jia A, Xu L, Wang Y. Venn diagrams in bioinformatics. Brief Bioinform. 2021;22(5):bbab108. ISBN: .
- Aran D, Hu Z, Butte AJ. xCell: digitally portraying the tissue cellular heterogeneity landscape. Genome Biol. 2017;18:220.
- Chen B, Khodadoust MS, Liu CL, et al. Profiling tumor infiltrating immune cells with CIBERSORT. Methods Mol Biol. 2018;1711:243–259.
- Racle J, Gfeller D. EPIC: a tool to estimate the proportions of different cell types from bulk gene expression data. Methods Mol Biol. 2020;2120:233–248.
- Langfelder P, Horvath S. WGCNA: an R package for weighted correlation network analysis. BMC Bioinformatics. 2008;9:559.
- Kanehisa M, Furumichi M, Tanabe M, et al. KEGG: new perspectives on genomes, pathways, diseases and drugs. Nucleic Acids Res. 2017;45:D353–d61.
- Carbon, S , Thomas, P.D , Albou, L.P et al. The gene ontology resource: 20 years and still GOing strong. Nucleic Acids Res. 2019;47:D330–d8.
- Wu J, Mao X, Cai T, et al. KOBAS server: a web-based platform for automated annotation and pathway identification. Nucleic Acids Res. 2006;34:W720–4.
- Subramanian A, Tamayo P, Mootha VK, et al. Gene set enrichment analysis: a knowledge-based approach for interpreting genome-wide expression profiles. Proc Natl Acad Sci U S A. 2005;102:15545–15550.
- Szklarczyk D, Gable AL, Nastou KC, et al. The STRING database in 2021: customizable protein-protein networks, and functional characterization of user-uploaded gene/measurement sets. Nucleic Acids Res. 2021;49:D605–d12.
- Shannon P, Markiel A, Ozier O, et al. Cytoscape: a software environment for integrated models of biomolecular interaction networks. Genome Res. 2003;13:2498–2504.
- Dweep H, Gretz N, Sticht C. miRWalk database for miRNA-target interactions. Methods Mol Biol. 2014;1182:289–305.
- Riffo-Campos ÁL, Riquelme I, Brebi-Mieville P. Tools for sequence-based miRNA target prediction: what to choose? Int J Mol Sci. 2016;17:1987.
- Chen Y, Wang X. Wang X. miRDB: an online database for prediction of functional microRNA targets. Nucleic Acids Res. 2020;48:D127–d31.
- Huang HY, Lin YC, Li J, et al. miRTarBase 2020: updates to the experimentally validated microRNA-target interaction database. Nucleic Acids Res. 2020;48:D148–d54.
- Liu H, Kai L, Du H, et al. LPS inhibits fatty acid absorption in enterocytes through TNF-α secreted by macrophages. Cells. 2019;8(12):1626.
- Hawkins SFC, Guest PC. Multiplex analyses using real-time quantitative PCR. Methods Mol Biol. 2017;1546:125–133.
- Younossi Z, Anstee QM, Marietti M, et al. Global burden of NAFLD and NASH: trends, predictions, risk factors and prevention. Nat Rev Gastroenterol Hepatol. 2018;15:11–20.
- Chalasani N, Younossi Z, Lavine JE, et al. The diagnosis and management of nonalcoholic fatty liver disease practice guidance from the American Association for the Study of Liver Diseases. Hepatology. 2018;67:328–357.
- Pai RK, Kleiner DE, Hart J, et al. Standardising the interpretation of liver biopsies in non-alcoholic fatty liver disease clinical trials. Aliment Pharmacol Ther. 2019;50:1100–1111.
- Sheka AC, Adeyi O, Thompson J, et al. Nonalcoholic steatohepatitis: a review. Jama. 2020;323:1175–1183.
- Di Mauro S, Scamporrino A, Filippello A, et al. Clinical and molecular biomarkers for diagnosis and staging of NAFLD. Int J Mol Sci. 2021;23:22.
- Parola M, Pinzani M. Liver fibrosis: pathophysiology, pathogenetic targets and clinical issues. Mol Aspects Med. 2019;65:37–55.
- Iredale JP. Models of liver fibrosis: exploring the dynamic nature of inflammation and repair in a solid organ. J Clin Invest. 2007;117:539–548.
- Dou L, Shi X, He X, et al. Macrophage phenotype and function in liver disorder. Front Immunol. 2019;10:3112.
- Kazankov K, Jørgensen SMD, Thomsen KL, et al. The role of macrophages in nonalcoholic fatty liver disease and nonalcoholic steatohepatitis. Nat Rev Gastroenterol Hepatol. 2019;16:145–159.
- Kayagaki N, Stowe IB, Lee BL, et al. Caspase-11 cleaves gasdermin D for non-canonical inflammasome signalling. Nature. 2015;526:666–671.
- Shi J, Zhao Y, Wang K, et al. Cleavage of GSDMD by inflammatory caspases determines pyroptotic cell death. Nature. 2015;526:660–665.
- Rathinam VA, Fitzgerald KA. Inflammasome complexes: emerging mechanisms and effector functions. Cell. 2016;165:792–800.
- Xu A, Zhong G, Wang J, et al. MicroRNA 200a inhibits liver fibrosis of schistosoma. Bioengineered. 2021;12:4736–4746.
- Calvente CJ, Tameda M, Johnson CD, et al. Neutrophils contribute to spontaneous resolution of liver inflammation and fibrosis via microRNA-223. J Clin Invest. 2019;129:4091–4109.
- Zhang T, Hu J, Wang X, et al. MicroRNA-378 promotes hepatic inflammation and fibrosis via modulation of the NF-κB-TNFα pathway. J Hepatol. 2019;70:87–96.
- Yu Y, Tian T, Tan S, et al. MicroRNA-665-3p exacerbates nonalcoholic fatty liver disease in mice. Bioengineered. 2022;13:2927–2942.
- Gomaa A, Peng D, Chen Z, et al. Epigenetic regulation of AURKA by miR-4715-3p in upper gastrointestinal cancers. Sci Rep. 2019;9:16970.
- Yu W, Yao J, Lyu P, et al. XPG is modulated by miR-4715-3p and rs873601 genotypes in lung cancer. Cancer Manag Res. 2021;13:3417–3427.