
ABSTRACT
Sucrose, an essential carbohydrate, is transported from source to sink organs in the phloem and is involved in a variety of physiological and metabolic processes in plants. Sucrose transporter proteins (SUTs) may play significant parts in the phloem loading and unloading of sucrose. In our study, the SUT gene family was identified in four Solanaceae species (Capsicum annuum, Solanum lycopersicum, S. melongena, and S. tuberosum) and other 14 plant species ranged from lower and high plants. The comprehensive analysis was performed by integration of chromosomal distribution, gene structure, conserved motifs, evolutionary relationship and expression profiles during pepper growth under stresses. Chromosome mapping revealed that SUT genes in Solanaceae were distributed on chromosomes 4, 10 and 11. Gene structure analysis showed that the subgroup 1 members have the same number of introns and exons. All the SUTs had 12 transmembrane structural domains exception from CaSUT2 and SmSUT2, indicating that a structure variation might occurred among the Solanaceae SUT proteins. We also found a total of 20 conserved motifs, with over half of them shared by all SUT proteins, and the SUT proteins from the same subgroup shared common motifs. Phylogenetic analysis divided a total of 72 SUT genes in the plant species tested into three groups, and subgroup 1 might have diverged from a single common ancestor prior to the mono-dicot split. Finally, expression levels of CaSUTs were induced significantly under heat, cold, and salt treatments, indicating diverse functions of the CaSUTs to adapt to adverse environments.
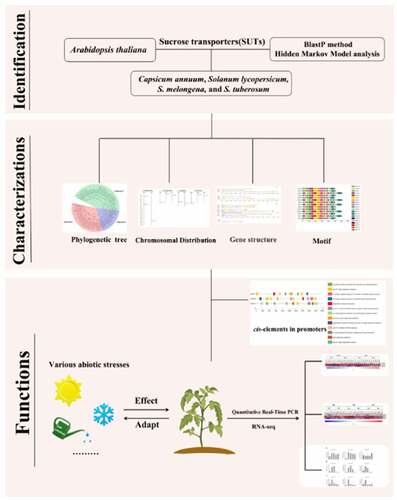
Graphical Abstract
1. Introduction
Sucrose, as the principal carbohydrate, is the final product of photosynthesis in most plants, and it is closely related to various physiological and metabolic actions [Citation1,Citation2]. Moreover, the long-distance transportation of sucrose from ‘source’ to ‘sink’ tissues is completed in the phloem, and there are two pathways for sucrose transport into the functioning phloem sieve elements (SEs): symplasmic pathway and apoplasmic pathway. Among them, the symplasmic transportation process does not rely on transmembrane transporters. Nevertheless, for the apoplasmic pathway process, the loading and unloading processes of sucrose are accomplished depending on the sucrose transporters (SUTs) [Citation3–7].
The SUT genes are members of the ancient major facilitator superfamily (MFS) which can be traced back to prokaryotes over 3.5 billion years ago [Citation8,Citation9,Citation10]. In addition, the SUT proteins contain a total of 12 hydrophobic transmembrane structural domains in the form of α-helices, which is one of the common structural characteristics for MFS members. Moreover, previous studies also reported that a hydrophilic loop structure exists between transmembrane region 6 and 7 [Citation4,Citation11–17].
As early as 1992, Riesmeier [Citation18] had isolated and characterized the first SUT gene from spinach (Spinacea oleracea L.). Subsequently, more SUT genes were identified in various plants. In 2010, a phylogenetic tree of SUT genes from multiple plant species was reported [Citation15], and the result showed that SUTs can be divided into five groups (SUT1-SUT5). Among them, the SUT1 is unique to dicotyledons, and the two groups (SUT3 and SUT5) are monocot-specific, whereas SUT2 and SUT4 contain members from dicotyledons and monocotyledons [Citation15]. Furthermore, members of different SUT groups perform diversified physiological functions [Citation19]. The SUT1 members have a high affinity for sucrose and play an essential role in the loading and unloading of sucrose in the phloem [Citation15,Citation20,Citation21]. On the contrary, members of the SUT2 and SUT4 show low affinity, but surprisingly, contribute to the rapid transport of sucrose at high sucrose concentrations [Citation12,Citation22,Citation23]. Moreover, monocots employ members from the SUT3 and SUT5 groups to accomplish the sucrose loading process in phloem [Citation24].
The SUTs, as sucrose transporters, play vital roles during the growth and development of plants [Citation25–28]. In cacao (Theobroma cacao L.) and peas (Pisum sativum L.), TcSUT and PsSUT1 genes are highly expressed in seeds and leaves, respectively, leading to higher seed yields [Citation29,Citation30]. Furthermore, in rice (Oryza sativa L.), down-regulated expression of OsSUT1 in source and sink tissues decreased the yield and quality [Citation31]. Additionally, researchers also found that overexpression of PbSUT2 in transgenic tomato plants resulted in early flowering [Citation32], and AtSUC9 mutant exhibit delayed flowering [Citation33]. The SUTs also play key roles in anthocyanin biosynthesis and senescence in grape [Citation34,Citation35]. In addition, DcSUT2 is expressed in the storage parenchyma tissues of carrot (Daucus carota L.) taproots, which can transport sucrose into the taproot for storage [Citation36].
On the other hand, researchers reported that SUT genes were indispensable for maintaining plant normal growth and development under various stresses. In rice, the increased expression level of OsSUT1 contributed to maintaining the seed quality under high-temperature stress [Citation37]. Both abscisic acid (ABA) and gibberellin acid (GA) induced expression of MdSUT1, which improves the abiotic tolerance of apple [Citation9,Citation21]. Furthermore, expression levels of AgSUT1 were reduced in all organs of celery (Apium graveolens L.) under salt stress, which allowed for maintaining common physiological function [Citation38].
Solanaceae is one of the most important botany families, containing many model plants such as tomato (Solanum lycopersicum) and tobacco (Nicotiana tabacum L). As a vital economic crop, pepper (Capsicum annum L.), a member of the Solanaceae family, is native to the tropical regions of Latin America, and cultivated widely in the world. Although the SUT gene family had been identified in the whole genome in a variety of plants [Citation23–30], little was reported in pepper.
Sucrose transporters (SUTs) may play essential roles in assimilating sucrose allocation within cells and at the whole-plant level, and the expression levels of SUTs are affected by various abiotic stresses. Therefore, this study performed genome-wide identification and characterization of the members of the SUT gene families in Solanaceae species. In addition, we conducted Quantitative Real-Time PCR to analyze the expression patterns of the SUTs in pepper under different abiotic stresses. The outcome of this study provides valuable insights into the evolution of SUT genes in Solanaceae, and further understanding of the biological function of the SUTs throughout growth and development.
2. Materials and Methods
2.1. Database Retrieval and Genome-wide Identification of SUT Genes in Pepper and Sixteen Other Plant Species
The whole-genome reference sequences of Capsicum annuum L. were downloaded from the pepper genome database (http://passport.pepper.snu.ac.kr/?t=PGENOME and https://solgenomics.net) . The genome information about Arabidopsis thaliana, Solanum lycopersicum, Oryza sativa, Vitis vinifera, Solanum melongena, Sorghum bicolor, Citrullus lanatus, Cucurbita moschata, Beta vulgaris, Cucumis sativus, Phaseolus vulgaris, Theobroma cacao, Zea mays, Solanum tuberosum, Daucus carota and Lagenaria siceraria was obtained from Phytozome v13 (https://phytozome-next.jgi.doe.gov/blast-search), Sol Genomics Network (https://solgenomics.net), Eggplant Genome Database (http://eggplant-hq.cn/Eggplant/home/index) and Potato Genomics Resource (http://spuddb.uga.edu/index.shtml). Then, the local database had set up. The SUTs belong to the MFS-2 family, and the Hidden Markov Model (HMM) [Citation39]file corresponding to the MFS-2 domain (PF13347.6) was retrieved from Pfam 34.0 (http://pfam.xfam.org), which was employed to identify putative SUT proteins. Next, we carried out a Blastp [Citation40] search using online databases with a set E-value threshold of 1e−5. All predicted candidates with the SUT domain were selected for the subsequent analysis.
2.2. Characterization of SUT Proteins in Solanaceae and Phylogenetic Analysis
The ExPasy (https://web.expasy.org/compute_pi/) was utilized for analyzing the characteristics of the SUT protein, including molecular weight (Mw) and protein isoelectric point(pI) [Citation41]. Prediction of transmembrane (TM) helix domains of SUT proteins was performed using TMHMM Server v2.0 (http://www.cbs.dtu.dk/services/TMHMM/). To determine the conserved motifs of SUT proteins in Solanaceae, we had chosen the online program MEME (https://meme-suite.org/meme/tools/meme) with the default parameter with the exception that the maximum number was set to 20. We used TBtools [Citation42] to visualize the conserved motifs in SUT proteins by converting the motif location. To examine the phylogenetic relationships of SUT genes, representative SUT genes from Arabidopsis thaliana, Solanum lycopersicum, Oryza sativa, Vitis vinifera, Solanum melongena, Sorghum bicolor, Citrullus lanatus, Cucurbita moschata, Beta vulgaris, Cucumis sativus, Phaseolus vulgaris, Theobroma cacao, Zea mays, Solanum tuberosum, Daucus carota and Lagenaria siceraria, as well as SUT genes from Capsicum annuum, were used to build a phylogenetic tree. Multiple sequence alignment was executed using ClustalW [Citation43] with default settings. The un-rooted phylogenetic tree was produced by MEGAX with a bootstrap of 1000 replicates, and the neighbor-joining (NJ) method was used [Citation44].
2.3. Gene Structure and Chromosomal Localization of SUT Genes in Solanaceae
The Gene Structure Display Server (GSDS 2.0, http://gsds.gao-lab.org) [Citation45] was applied to analyze the gene structure of all SUTs identified in C. annuum, S. lycopersicum, S. melongena and S. tuberosum. The software MapChart was used to visualize the physical location information [Citation46].
2.4. Analysis of Promoter Regions of CaSUT Gene Family Members
The 2000 bp DNA sequence (promoter sequences) of the upstream region of each CaSUT gene was gathered from the Sol Genomics Network database (https://solgenomics.net). The online tool PlantCARE (http://bioinformatics.psb.ugent.be/webtools/plantcare/html/) [Citation47] was used to predict cis-acting elements in promoter regions of CaSUT family genes. The cis-acting structure of each member of CaSUT family was visualized using the software TBtools [Citation42].
2.5. Expression Analysis of CaSUT Genes
To analyze the expression patterns of CaSUT genes in different organs, the Pepper Functional Genomics Database (PFGD; https://www.pfgd.org) was applied. The plants were cultivated in a natural glasshouse with daily temperatures ranging from 25°C to 29°C and night temperatures ranging from 16°C to 20°C. Seven tissues were selected, including leaf, flower, petal, ovary, stamens, fruit and seed. Flowers at the fourth bifurcation were tagged on the day of opening to obtain fruit samples at various developmental stages. Fruits were gathered 3, 7, 10, 15, 20, 25, 30, 35, 40, 45 and 50 days after flowering (DAF) from the tagged flowers. Floral buds were collected at 9 different stages based on their size. The fully blossomed flowers were divided into petals, ovary with stigma, and stamen. Leaf samples were collected at 2, 5, 10, 15, 20, 25, 30, 40, and 50 days after emergence (DAE).
2.6. Expression Profiles of CaSUT Genes using RNA-seq
To investigate the expression profiles of predicted CaSUT genes in response to different stresses such as heat, cold, methyl jasmonic acid (MeJA), abscisic acid (ABA) and salt, the complete RNA-seq data for various environmental stresses were downloaded from the database PFGD (https://www.pfgd.org). Seedlings of line 6421 were treated with 10 μM MeJA and 30 μM ABA. These two hormones (MeJA and ABA) were chosen and added to the nutrient solution. The seedlings were moved into a growth chamber at 42°C (heat treatment) or 10°C (cold stress treatment), and salt stress was given by adding NaCl to a final concentration of 200 mM in the nutrient solution. Plants in the control group were just given nutrient solutions. All stress treatments had been performed to seedlings of pepper which was 40 days old, and the stresses treatment time set to 0, 0.5, 1, 3, 6, 12 and 24 hours with each five biological replicas. Further, the treated plants and control plants were collected respectively. Then, the raw Reads Per Kilo bases per Million mapped Reads (RPKM) values for candidate genes were normalized. Finally, heat maps of CaSUT gene expression pattern in each tissue and under stress treatments were generated using Multi Experiment Viewer (MeV) [Citation48].
2.7. Plant growth and stress treatment
C. annuum cultivar D50 provided by the Zhejiang Academy of Agricultural Sciences was used to perform the expression of candidate genes. Plants were grown at room temperature of 25 ± 1°C, 16 h light/20 ± 1°C, 8 h night. Plants that were 6 weeks old and had similar growth conditions were chosen for cold, heat, and salt treatments. For cold stress, seedlings were transferred to a growth chamber at 4°C, and leaves were collected at 1 h, 3 h, 6 h, and 12 h. For heat stress, seedlings were maintained at 42°C for 0.5 h, 1 h, 4.5 h, and 6 h, then leaves were collected respectively. A final concentration of 400 mM NaCl was used for salt stress and leaves were collected at 1 h, 6 h, 12 h, and 24 h. No less than 3 plants were selected for each abiotic stress treatment. All samples were quick-frozen in liquid nitrogen and stored at −80°C for RNA isolation.
2.8. RNA Extraction and Quantitative Real-Time PCR Analysis
Total RNA was isolated from pepper leaves using the E.Z.N.A.R® Plant RNA Kit (OMEGA, United States). To avoid degradation, all steps were accomplished at low temperature. The first strand cDNA was synthesized from 1 µg of total RNA using FastKing RT Kit (with gDNase) (TIANGEN, China) according to the manufacturer’s instructions.
Gene-specific primers for Quantitative Real-Time PCR (qRT-PCR) were designed using the Genscript online tool (https://www.genscript.com/tools/real-time-pcr-taqman-primer-design-tool). The pepper GAPDH gene was utilized as an endogenous reference gene for normalizing the expression levels. The reaction system of qRT-PCR analysis followed the instructions of SYBR Green Master Mix reagent of Vazyme with 20 µl reaction mixture of volume on CFX96 Real-Time System (Bio-Rad, United States) . All qRT-PCRs were performed in triplicate and the expression data were calculated by the 2−ΔΔCt method.
3. Results
3.1. Identification of SUT Gene Family
The SUTs have been identified in different plant species, such as Arabidopsis [Citation49]. Nevertheless, systematic analysis of the SUT gene family in peppers with other Solanaceae had not been reported. Here, we identified a total of 14 SUT genes in C. annuum cv zunla, C. annuum cv CM334, S. lycopersicum, S. melongena and S. tuberosum, using the Hidden Markov Model (HMM) profile (PF13347.6) and Blastp analysis. The SUT genes in C. annuum zunla, C. annuum CM334, S. lycopersicum, S. melongena, and S. tuberosum were assigned as ‘CaSUT’, ‘CASUT’, ‘SlSUT’, ‘SmSUT’ and ‘StSUT’, respectively (). In addition, the members of the SUT gene family from 13 other plant species were selected for illustrating their evolutionary relationships, including Arabidopsis, rice, grape, sorghum, watermelon, pumpkin, beet, cucumber, bean, cocoa, corn, carrot, and bottle gourd (Table S1). Compared to the number of SUT genes in Solanaceae, the number of pepper SUT genes is similar to tomato and potato, which is higher than in eggplant. Moreover, the number of SUT genes range from 2 to 3 in the Solanaceae species tested, which were less than the numbers in Poaceae (4–5), Arabidopsis (9), and Cucurbitaceae (3–4). Further analysis showed that SUT genes in Solanaceae species encode 497 to 611 amino acids (aa). The predicted molecular weight (Mw) of the SUTs varied from 54.27 KDa (StSUT1) to 65.56 KDa (CaSUT3 and CASUT3). The theoretical isoelectric point (pI) value ranges from 6 to 9.32. Among them, CaSUT3 (6), CASUT3 (6), SlSUT2 (5.95), SmSUT2 (6.46), and StSUT2 (6.02) proteins were weakly acidic with pI values less than 7, the remaining pI values were above 7, which were typical alkaline proteins. In contrast to SUT genes in Solanaceae, the pI values of SUT genes of beet and grape were both greater than 7, indicating that their SUT proteins were both basic. It has been inferred that function of the SUT genes could be diversified in different species.
Table 1. Characteristics of SUT genes in Solanaceae species.
3.2. Phylogenetic Analysis of SUT Genes in Major Plant Species
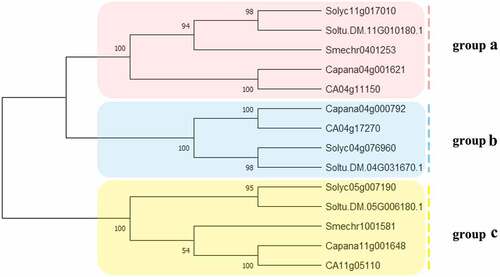
To study the evolutionary relationships among the Solanaceae SUT proteins, SUT proteins in 4 Solanaceae species (C. annuum; S. lycopersicum; S. melongena; S. tuberosum) were identified and used in phylogenetic analysis (). Solanaceae SUT proteins were divided into 3 groups, and group B did not contain eggplant.
Figure 1. The phylogenetic analysis of SUT proteins from C. annuum, S. lycopersicum, S.melongena, S. tuberosum. Fourteen SUT proteins were used to construct the NJ tree with 1000 bootstraps based on the protein sequences. The SUT proteins were grouped into 3 groups.
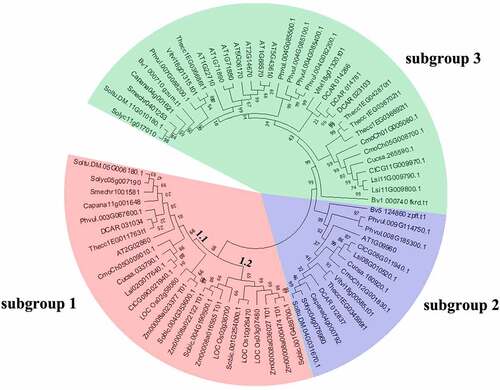
To assess the phylogenetic relationship among pepper SUT proteins with other 16 plant species, we constructed an unrooted phylogenetic tree () with a total of 72 SUT genes from C. annuum, A. thaliana, S. lycopersicum, O. sativa, V. vinifera, S. melongena, S. bicolor, C. lanatus, C. moschata, B. vulgaris, C. sativus, P. vulgaris, T. cacao, Z. mays, S. tuberosum, D. carota and L.siceraria. The result exhibited that the 72 SUT genes were also divided into 3 clades (designated as subgroups 1 to 3), including 25, 14, and 33 members, respectively. Among them, subgroup 1 was divided into 2 parts; subgroup 1.1 composed of 15 SUT genes from both monocot and dicot species. Subgroup 1.2 was a monocot-specific subgroup containing 3 OsSUTs, 4 ZmSUTs, and 3 SbSUTs, which supported earlier research [Citation15]. The members of subgroup 1 were from the other 16 plant species tested except for B. vulgaris. Subgroup 2 contained at least one member from A. thaliana, S. tuberosum, S. lycopersicum, C. annuum, D. carota, T. cacao, V. vinifera, C. moschata, C. sativus, L.siceraria, C. lanatus, P. vulgaris and B. vulgaris. Subgroup 3 was the largest group and contained SUTs exclusively from dicot species. Moreover, more AtSUTs were placed in subgroup 3 than in other two subgroups. Interestingly, all the members in subgroup 2 and subgroup 3 were from dicotyledons, corresponding well to the SUT1 clade [Citation50], and demonstrating the close evolutionary link between homologous SUTs. Notably, same as the most Solanaceae SUTs, pepper SUTs were found in 3 subgroups.
Figure 2. Phylogenetic relationships among SUT genes in 17 plant species. The species’ abbreviations were as follows: C. annuum (Ca), A. thaliana. (At), S. lycopersicum (Sl), O. sativa (Os), V. vinifera (Vv), S. melongena (Sm), S. bicolor (Sb), C. lanatus (Cl), C. moschata (Cm), B. vulgaris (Bv), C. sativus (Cs), P. vulgaris (Pv), T. cacao (Tc), Z. mays (Zm), S. tuberosum (St), D. carota (Dc) and L.siceraria (Ls). The phylogenetic tree was constructed using the neighbor-joining (NJ) method and with 1000 bootstrap replications. The numbers at the nodes represented bootstrap percentage values. 72 SUT proteins were divided into 3 subgroups. Three subgroups were marked with different background colors.
3.3. Chromosomal Distribution of SUT Genes
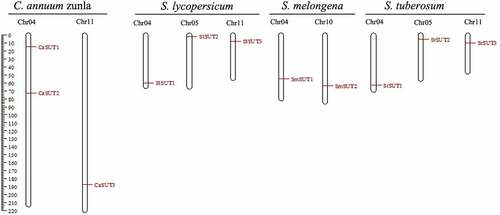
To understand the distribution of CaSUT genes and Solanaceae SUTs gene on the chromosomes, we constructed a chromosomal localization map of members of the SUT genes family (). The result showed that the 3 CaSUT genes were mapped on 2 of 12 pepper chromosomes (chromosomes 4 and 11) with an uneven distribution pattern. Chromosome 4 contained 2 CaSUT genes, while chromosome 11 carried a single CaSUT gene. Meanwhile, we also found that most SUTs in Solanaceae except eggplant were located on chromosomes 4 and 11. Moreover, each of SlSUT2 and StSUT2 was located on chromosome 5.
Figure 3. Distribution of CaSUT genes and Solanaceae SUTs gene on the chromosomes. The SUTs positions were shown as red lines. Chromosome numbers are shown at the top of each bar.
3.4. Intron-exon Structures and Conserved Motifs of SUT Genes
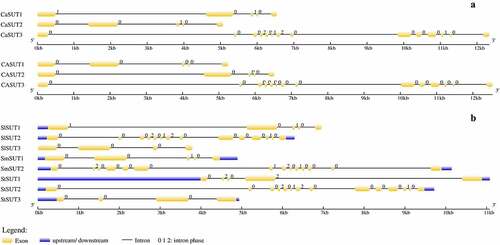
The structural diversity of multigene families means a direct signal of gene family expansion, and the conserved protein motifs play significant roles in the evolution of multiple gene families [Citation51–53]. As described above (), SUT genes in Solanaceae had 10–12 TM helix domains, while each of the CaSUTs had 12 TM helix domains. The results supported the previous studies that sucrose transporters typically have 12 TM helix domains [Citation11–16]. To visualize the structure of SUT genes, the introns and exons were characterized by comparing the cDNA sequences with the corresponding whole-genome DNA sequences (). Structural analysis showed that CaSUT3 contained the largest number of exons and introns (14 exons and 13 introns), and the remaining CaSUT1 and CaSUT2 contained 5 exons and 4 introns. Although from different pepper materials, the SUT genes in CM334 were identical in the number of introns and exons to CaSUTs ( -a). The CaSUT genes which belonged to the same clade had similar intron-exon configurations. Although the lengths of CaSUT1 and CaSUT2 which both belong to the SUT1 clade [Citation50] varied, similar intron-exon configurations and the same number of exons and introns were observed. The result indicated that closely related genes shared similar gene structures. Meanwhile, in each Solanaceae species ( -b), there were unique SUT genes (CaSUT3, SlSUT2, SmSUT2 and StSUT2) that differ significantly in length, introns and exons number (14 exons and 13 introns), when compared to other Solanaceae SUTs gene. Further analysis showed that all the above SUT genes from subgroup 1.
Figure 4. Genes structural organization of 14 SUTs. a) C. annuum Zunla and C. annuum cv CM334; b) S. lycopersicum, S. melongena, and S. tuberosum. Exons and introns were represented by yellow boxes and black lines, respectively. The. upstream/downstream were represented by blue boxes. The sizes of exons and introns are proportional to their sequence lengths. 0 = intron phase 0; 1 = intron phase 1; 2 = intron phase 2.
Next, we predicted conserved motifs of SUT proteins in pepper and other Solanaceae plants using the MEME program, and found 20 conserved motifs (Motif 1 to Motif 20) (). The length of these conserved motifs ranged from 6 to 50 amino acids. Each of the 14 SUT contained multiple motifs.
Figure 5. Distributions of conserved motifs in SUT proteins in Solanaceae species. Motifs of the SUT proteins identified by the online tool MEME. Different motifs are indicated by different colors and numbered 1–20. The same number in different proteins referred to the same motif.
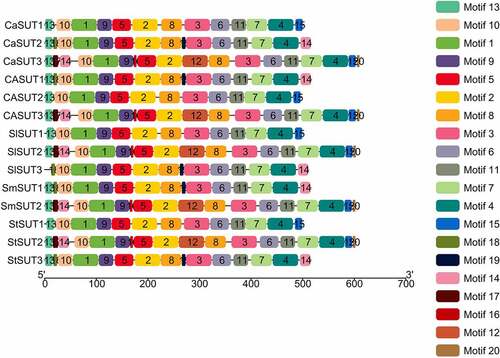
Among the 20 conserved motifs identified, 11 motifs (motif 1 − 11) were shared by all SUTs (). In addition, motif 13 was identified in all of the SUT proteins except SlSUT2. CaSUT3, SlSUT2, SmSUT2, and StSUT2 which all belonged to subgroup1 shared 4 common motifs (motif 12, 16, 17, and 20). While motif 14 and motif 15 were present in the most of SUT genes in Solanaceae, the 4 SUTs (CaSUT3, SlSUT2, SmSUT2, and StSUT2) which from subgroup 1 simultaneously shared the 2 motifs. The motif types and distribution of members of the same subgroups were highly conserved, suggesting a potential similar function. The motif 18 and motif 19 were only observed in members of subgroup 3(CaSUT2, SlSUT3, SmSUT1, and StSUT3). Overall, the conserved motifs in different subfamilies varied, implying that the SUT proteins could have functional variation and evolutionary diversification.
3.5. Promoter Analysis of Pepper SUT Genes
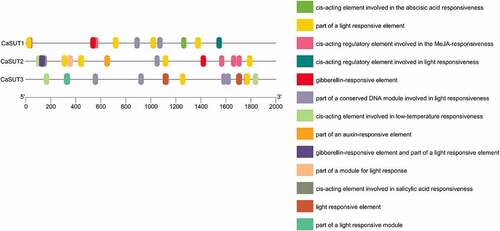
Several responsive cis-elements were found in promoter regions (2000bp) of pepper SUT genes using the online tool ‘PlantCare’ (). These responsive cis-elements were mainly light, low-temperature, gibberellin, methyl jasmonic acid (MeJA), abscisic acid (ABA), salicylic acid (SA), and auxin responsive elements (). As the result showed, light-responsive elements were present in promoter regions of all CaSUT family members. Except for CaSUT3, the remaining two CaSUT genes all had MeJA and gibberellin responsive elements (). Auxin response elements were found in one of all the CaSUTs (CaSUT2) identified, whereas ABA and SA response elements were predicted in the promoter regions of CaSUT1 and CaSUT3, respectively (). The result suggested that CaSUT genes might be involved in multiple biological processes and had different regulatory pathways among different members during the growth and development processes of pepper.
Figure 6. Promoters of SUT genes of pepper and their cis-elements analysis. The colored boxes represented different responsive cis-elements.
3.6. Expression Patterns of CaSUT Genes in Different Tissues
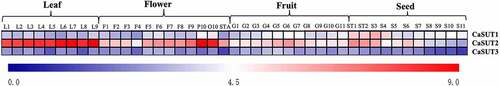
The transcript levels of CaSUT genes in 7 tissues/organs of pepper were investigated, including leaf, flower, petal, ovary, stamens, fruit and seed. All the CaSUT genes exhibited diverse expression patterns in different tissues/organs (). Although similar gene structure and physicochemical characteristics of CaSUT genes were observed in the same subgroups, expression patterns of these genes in tissues/organs were different. As shown in , CaSUT3 was detected barely in all tested organs. On the contrary, CaSUT1 and CaSUT2 showed ubiquitous expression patterns in all investigated organs (). Especially, these two genes showed the highest expression in the early stage of seeds development and leaves, respectively, suggesting their crucial function in the development of seeds and source organs (). It was worth noting that CaSUT2 was relatively highly expressed in all tested tissues in our study. In the present study, the result indicated that each CaSUT genes drive various function during the growth and development process of pepper.
Figure 7. Heat map of the expression pattern of SUT genes in different tissues of pepper. L1-L9 indicated the expression of CaSUTs in leaves at 2, 5, 10, 15, 20, 25,30, 40 and 50 days after emergence; F1-F9 represented flower buds of different stages; P10: petals; O10: ovary; STA10: stamens; G1-G11 indicated the expression of CaSUTs in fruits at 3, 7, 10, 15, 20, 25, 30, 35, 40, 45 and 50 days after flowering, respectively; ST1 and ST2 represented seeds and placenta in fruits 10 and 15 days after flowering, respectively; S3-S11 indicated the expression of CaSUTs in leaves at 20, 25, 30, 35, 40, 45, 50, 55 and 60 days after flowering. Expression levels of the CaSUT genes were shown as the Log2 transformed FPKM values obtained from the RNA-Seq data. Heat maps were presented in blue/white/red colors that represent high/medium/low expression, respectively.
3.7. Expression of CaSUT Genes in Response to Salt, Cold, and High Temperature
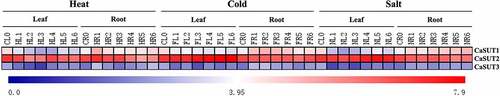
To further explore the responsive mechanism of the CaSUT gene family of members under abiotic stresses, we used RNA-seq to investigate the expression profiles of CaSUT genes under cold, heat, and salt treatment in roots and leaves of pepper. It should be noted that the expression of CaSUT1 and CaSUT3 were down-regulated in leaves, but in roots, their expressions were up-regulated (). Under cold stress, the expression levels of CaSUT1 and CaSUT3 significantly increased in roots, but were down-regulated in leaves (). Inversely, CaSUT2 expression was up-regulated in leaves. Under salt stress, CaSUT2 exhibited up-regulation in leaves, while the expression levels of the other two genes (CaSUT1 and CaSUT3) decreased (). In roots, CaSUT1 and CaSUT3 were up-regulated, and CaSUT2 was suppressed ().
Figure 8. Heatmap showing the expression patterns of the CaSUT genes under different salt, cold and high temperature stress. CL0 indicated the expression of CaSUT in pepper leaves in the control group without any treatment; CR0 denotes the expression of CaSUT in pepper roots in the control group without any treatment; numbers 1–3 represented the expression of CaSUTs in leaves/roots of seeding at 0.5, 1, 3, 6, 12 and 24 hours after salt, cold and high temperature stress, respectively. HL/HR referred to the expression of CaSUT genes in leaves/roots under high temperature treatment; FL/FR indicated the expression of CaSUT genes in leaves/roots under cold temperature treatment; NL/NR indicated the expression of CaSUT genes in leaves/roots under salt stress. Heat maps were presented in blue/white/red colors that represent high/medium/low expression, respectively.
3.8. Expression of CaSUT Genes under Different Hormone Treatments
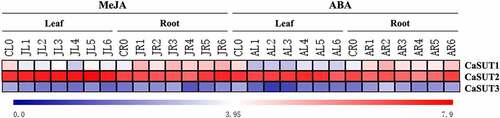
The expression levels of SUTs were associated with various factors, such as the different kinds of phytohormones [Citation54]. To better understand the function of CaSUT genes in response to exogenous phytohormones, we analyzed the expression pattern of pepper genes in response to MeJA and ABA in leaves and roots. Under MeJA treatment, we discovered that CaSUT1, CaSUT2 and CaSUT3 were up-regulated in roots (). The transcript level of only one gene (CaSUT2) was slightly increased in leaves (). Following ABA treatment, expression levels of CaSUT1 and CaSUT3 were down-regulated in leaves, while CaSUT2 constantly showed a relatively high expression profile (). Enhanced expression levels of two genes (CaSUT1and CaSUT3) in roots were observed after ABA treatment, and CaSUT2 exhibited slight change in expression level ().
Figure 9. Heatmap showing the expression patterns of the CaSUT genes under methyl jasmonic acid (MeJA) and abscisic acid (ABA) treatment. CL0 indicated the expression of CaSUT in pepper leaves in the control group without any treatment; CR0 denoted the expression of CaSUT in pepper roots in the control group without any treatment; numbers 1–3 represented the expression of CaSUTs in leaves/roots of seeding at 0.5, 1, 3, 6, 12 and 24 hours after salt, cold and high temperature stress, respectively. JL/JR ped the expression of CaSUT genes in leaves/roots under MeJA treatment; AL/AR denoted the expression of CaSUT genes in leaves/roots under ABA treatment. Heat maps were presented in blue/white/red colors that represent high/medium/low expression, respectively.
3.9 Response of CaSUT Genes to Various Abiotic Stress
To further investigate the protein roles of SUT genes in pepper responding to various stresses, pepper seedlings of D50 were subjected to cold, heat, and salt stresses. Then the qRT-PCR analysis of CaSUT was performed to measure the gene expression profiles in response to abiotic in leaves using 4 pairs of specific primers (). Under cold (4°C) stress, CaSUT1 and CaSUT2 genes were both induced in the whole stage of treatment, especially CaSUT2, whose expression was elevated more than ten-fold compared to that of the 0 h control ( -a). In addition, the expression levels of CaSUT1 reached its peak at 3 h, while CaSUT2 peaked at 1 h. The transcription levels of CaSUT3 were slightly inhibited in the early stage, while upregulated at 12 h after cold treatment ( -a). Under heat (42°C) stress, CaSUT2 showed significant up-regulation by 10- to 40-fold in leaves at 0.5 h, 1 h, and 4.5 h, and was inhibited at 6 h ( -b). Meanwhile, the expression levels of CaSUT1 and CaSUT3 were initially upregulated, then repressed at 4.5 h and 6 h after heat treatment, respectively. Notably, the expression levels of CaSUTs exhibited differences across the four time points. CaSUT1 and CaSUT2 reached the maximum value at 1 h and CaSUT3 reached a peak at 0.5 h ( -b).
Table 2. The primers used in quantitative real-time PCR (qRT-PCR) analysis in this study.
Figure 10. Expression patterns of CaSUT genes under abiotic stresses at different time points. CK referred to the untreated pepper seedlings that were only mock-treated with nutrient solution. The relative expression levels referred to the expression levels of the set time points after stresses were compared with those of untreated pepper seedlings. (a) cold stress, (b) heat stress, (c) salt stress.
Moreover, we explored the expression patterns of the CaSUT gene family in response to salt stress in leaves using the qRT-PCR analysis. Under high concentration NaCl (400 mM) treatment, the up-regulated expression of all CaSUT genes was very significant (CaSUT1 and CaSUT3: >3-fold, CaSUT2: >16-fold) at 1 h at which the expression levels of all CaSUTs reached the highest ( -c). However, only the expression levels of CaSUT2 were upregulated at all the four time points. Transcript levels of CaSUT1 showed a trend of upregulation and then downregulation. Down-regulation of CaSUT3 was observed at 6 h and 12 h after salt treatment, but it exhibited only slight changes in expression level at 24 h compared with the control. According to our qRT-PCR data, CaSUTs have a certain function in response to abiotic stresses in pepper and their specific molecular mechanism might differ among genes.
4. Discussion
Sucrose transport from ‘source’ to ‘sink’ is one of the most important factors in plant growth and development. SUT (sucrose transporter) proteins, which are members of the MFS family, play a vital role in the partitioning of whole-plant carbohydrates [Citation55,Citation56]. In this study, putative SUT genes family of members in the published whole-genome sequences of the pepper (Capsicum annuum. L) and other 3 Solanaceae species (S. lycopersicum, S. melongena and S. bicolor) were analyzed. A total of 3 SUT genes in pepper were identified, which were similar to the grape (Vitis vinifera, VvSUT1-3), but different from those in rice (Oryza sativa L. OsSUT1-5) [Citation7] and Arabidopsis (Arabidopsis thaliana, AtSUC1-9) [Citation49]. Interestingly, in tomato and potato, which also belong to Solanaceae as pepper, the same number of SUT family members was observed. This demonstrated that the number of SUT family members in Solanaceae was conserved, and the SUT gene family was small. It was well known that gene duplication (segmental and tandem) was common during the evolutionary process and was considered one of the fundamental driving forces of plant gene family expansion [Citation57–60]. In our paper, most SUTs in Solanaceae were located on chromosomes 4 and 11, and we did not find specific-species genes duplication events in 4 Solanaceae species. Thus, we speculated that the SUT genes in each Solanaceae species might share similar duplication events during their long-term evolution process.
SUT proteins, known as sucrose/H+ cotransport proteins, are plant-specific and highly hydrophobic proteins with 12 transmembrane structural domains [Citation61]. In this study, we found that most SUTs had 12 transmembrane structural domains, which was similar to the previous report [Citation62]. In the present study, we also observed that the CASUT2 and SmSUT2 had 10 and 11 transmembrane structural domains, respectively, which were different from other SUT proteins. Further analysis found that the SUT proteins from other plant species (Arabidopsis, rice, grape and sorghum) that is close related with CASUT2 and SmSUT2 also had fewer transmembrane structural domains. We hypothesized that the absence of transmembrane helix domains of SUT proteins could be related to the structure variation of SUT proteins. At present, the specific mechanism needs to be explored in the future. In addition, we found that, compared with subgroup 1, subgroup 2 was closely related to subgroup 3. Subgroup 1 was composed of the SUTs from monocots and dicots, suggesting that the subgroup might have diverged from a single common ancestor prior to the mono-dicot split. We also found that the gene structure and conserved motifs among the three subgroups were different, implying that functions of SUT genes in Solanaceae species might have diverged during the evolution processes.
The promoter regions, which have many cis-elements, initiate the gene expression/transcription profiles in plant species. The promoter characteristic, such as the response to various stimuli, is determined by different combinations of regulatory cis-elements. Thus, investigation of regulatory cis-elements of target genes’ promoters can help us predict their expression patterns in response to diverse stimuli [Citation58]. As one of the important economic crops, pepper faced variable environments during the whole growth and development process, while different environmental stimuli would affect their yield [Citation63,Citation64]. In this study, light and low-temperature responsive elements had been found in the promoters of the CaSUT gene family. Most members of the CaSUT genes contained one or two of the responsive elements above-mentioned, suggesting that the SUT genes family might be involved in the adaptation of environmental change in pepper. We also observed that CaSUT promoters contained many stress-related cis-elements, including MeJA, SA and ABA responsive elements, and the distribution of these stress-related cis-elements in pepper was similar to the previous report in oilseed rape [Citation65]. MeJA, SA and ABA are primary phytohormones that are widely engaged in stress response in plants [Citation66–68]. In this paper, MeJA responsive elements had been found in two of all the CaSUT genes (CaSUT1 and CaSUT2), and SA and ABA responsive elements were present in the promoter regions of CaSUT1 and CaSUT3, indicating that the CaSUT genes could be associated with abiotic and biotic stress tolerance in pepper. In addition, we discovered that CaSUT promoters had gibberellin and auxin responsive elements, demonstrating that the CaSUT genes were involved in plant growth and development [Citation69]. In short, in the present study, plenty of responsive cis-elements existed in CaSUT promoters, suggesting their key roles as crucial regulators in the response to abiotic and biotic stimuli, as well as their important function during pepper growth and development.
Spatial and temporal expression patterns of potential members of the gene family in plants contributed to understanding their function throughout their growth and development. Previous studies had reported that the SUT genes are expressed both in ‘source’ and ‘sink’ organs and can regulate the sucrose distribution and metabolism to satisfy the demands of plants during the growth and development process [Citation70–72]. In this study, CaSUT1 and CaSUT2 showed high expression in all tested tissues, suggesting that they might be involved in pepper growth and development. Especially, the highest expression levels of CaSUT2 were observed in leaves, we inferred that it might play a critical role in sucrose loading and unloading from ‘source’ to ‘sink’ organs [Citation73,Citation74]. In conclusion, the different expression patterns suggested that the CaSUT gene family could play roles in both ‘source’ and ‘sink’ organs. Moreover, our findings provided more information on the potential functionalities of the SUT genes in pepper.
Adverse environments affected seriously pepper growth and development, including cold, heat, and hormone stresses [Citation73–78]. In the present study, CaSUT1 and CaSUT3 were up-regulated in roots under temperature treatments (cold and heat), suggesting that these genes were involved in roots in response to temperature stresses. Moreover, we observed that CaSUT1 and CaSUT3 had displayed similar expression patterns in roots under salt and hormone (SA and ABA) stresses (), which indicated that both environmental stimulations could induce the expression of these genes. We also found that CaSUT2 was relatively highly expressed in both leaves and roots under salt treatments, implying that its expression might be influenced by salt. Similar to salt treatment, CaSUT2 was relatively highly expressed in all investigated organs, when pepper was exposed to cold, heat, and hormone stresses. CaSUT2 was relatively highly expressed in all tested tissues in pepper, and responded to stress treatments very sensitively, which indicated that it might not only be involved in the loading and unloading of sucrose in phloem but also the response to environmental change. In short, the expression patterns of the CaSUT genes family under various stresses were different, indicating that members of the CaSUT gene family could have diverse functions to adapt to the altered environment.
Various abiotic stresses can affect the expression of the SUT gene, thereby influencing sucrose distribution in plants, and regulating osmotic balance and plant morphology [Citation79,Citation80]. Subsequently, the qRT-PCR was carried out to explore the expression patterns of the SUT gene family in pepper in response to cold, heat, and salt stresses. Interestingly, our qRT-PCR data demonstrated that CaSUT genes exhibited concurrent sensitivity to all abiotic stress treatments with uneven expression levels (). Similar expression trends have been noticed in previous reports of the SUT gene family in rice [Citation81,Citation82], apple [Citation83], and wheat [Citation84]. In this paper, when exposed to heat stress, expression levels of CaSUT1 were up-regulated at all stages, while CaSUT3 increased at 12 h after treatment. Under salt stress, CaSUT1 and CaSUT3 were both obviously induced at 1 h. Under the above stresses, significantly up-regulated expression levels of CaSUT2 were found in all stages analyzed, except for heat stress treatment. These findings suggested that CaSUT genes had different functions in growth and development, as well as in response to environmental stresses. However, more research into the specific regulatory mechanism is required.
5. Conclusion
In summary, the SUTs from 17 plant species were divided into 3 subgroups. The subgroup 1 had diverged from a single common ancestor prior to the mono-dicot split. Genome-wide characterization of the SUT genes in four Solanaceae species revealed that the SUT gene family in Solanaceae was highly conserved. Our results suggested that CaSUT could have diverse functions to adapt to adverse environments and advance our knowledge of the potential functions of SUT genes in Solanaceae species.
Author Contributions
H.W., Y.C., and W.D. conceived and designed the research. W.C. and Q.S. performed the experiments. H.L., Q.W., and G.G., analyzed the data and wrote the paper. H.W. and Y.C. revised the manuscript. All authors read and approved the final manuscript. All authors read and approved the final manuscript.
Disclosure statement
No potential conflict of interest was reported by the author(s).
Additional information
Funding
References
- Liesche J. Sucrose transporters and plasmodesmal regulation in passive phloem loading. J Integr Plant Biol. 2017;59(5):311–321.
- Rolland F, Baena-Gonzalez E, Sheen J. SUGAR sensing and signaling in plants: conserved and novel mechanisms. Annu Rev Plant Biol. 2006;57(1):675–709.
- Poudel K, Luo X, Chen L, et al. Identification of the SUT gene family in Pomegranate (Punica granatum L.) and functional analysis of PgL0145810.1. Int J Mol Sci. 2020;21(18):6608.
- Lalonde S, Wipf D, Frommer WB. Transport mechanisms for organic forms of carbon and nitrogen between source and sink. Annu Rev Plant Biol. 2004;55(1):341–372.
- Yadav UP, Ayre BG, Bush DR. Transgenic approaches to altering carbon and nitrogen partitioning in whole plants: assessing the potential to improve crop yields and nutritional quality. Front Plant Sci. 2015;6:275.
- Gautam A, Kumar N, Dubey AK, et al. Sucrose plays key role in amelioration of arsenic induced phytotoxicity through modulating phosphate and silicon transporters, physiological and biochemical responses in C3 (Oryza sativa L.) and C4 (Zea mays L). Environ Exp Bot. 2020;171:103930.
- Aoki N, Hirose T, Scofield GN, et al. The sucrose transporter gene family in rice. Plant Cell Physiol. 2003;44(3):223–232.
- Rae AL, Grof CPL, Casu RE, et al. Sucrose accumulation in the sugarcane stem: pathways and control points for transport and compartmentation. Field Crops Res. 2005;92(2):159–168.
- Ma QJ, Sun MH, Liu YJ, et al., Molecular cloning and functional characterization of the apple sucrose transporter gene MdSUT2. 2016;Plant Physiology & Biochemistry. 109:442–451.
- Reinders A, Sivitz AB, Ward JM. Evolution of plant sucrose uptake transporters. Front Plant Sci. 2012;3:22.
- Ayre BG. Membrane-Transport Systems for Sucrose in Relation to Whole-Plant Carbon Partitioning. Mol Plant. 2011;4(3):377–394.
- Weise A, Barker L, Kühn C, et al. A new subfamily of sucrose transporters, SUT4, with low affinity/high capacity localized in enucleate sieve elements of plants. Plant Cell. 2000;12(8):1345–1355.
- Liu Y, Ying X, Yang Y, et al. Molecular cloning and expression analysis of turnip (Brassica rapa var. rapa) sucrose transporter gene family. Plant Divers. 2017;39(3):123–129.
- Lemoine R. Sucrose transporters in plants: update on function and structure. Biochimica et Biophysica Acta (BBA) – Biomembranes. 2000;1465:246–262.
- Kühn C, Grof CP. Sucrose transporters of higher plants. Curr Opin Plant Biol. 2010;13(3):287–297.
- Slewinski TL. Diverse functional roles of monosaccharide transporters and their homologs in vascular plants: a physiological perspective. Mol Plant. 2011;4(4):641–662.
- Stolz J, Ludwig A, Stadler R, et al. Structural analysis of a plant sucrose carrier using monoclonal antibodies and bacteriophage lambda surface display. FEBS Letter. 1999;453(3):375–379.
- Riesmeier JW, Willmitzer L, Frommer WB. Isolation and characterization of a sucrose carrier cDNA from spinach by functional expression in yeast. EMBO J. 1992;11(13):4705–4713.
- Berthier A, Meuriot F, Dédaldéchamp F, et al. Identification of a new sucrose transporter in ryegrass (LpSUT2): effect of defoliation and putative fructose sensing. Plant Physiol Biochem. 2014;84:32–44.
- Slewinski TL, Meeley R, Braun DM. Sucrose transporter1 functions in phloem loading in maize leaves. J Exp Bot. 2010;60(3):881–892.
- Peng CC, Xu YH, Xi RC, et al. Expression, subcellular localization and phytohormone stimulation of a functional sucrose transporter (MdSUT1) in apple fruit. Sci Hortic. 2011;128(3):206–212.
- Carpaneto A, Geiger D, Bamberg E, et al. Phloem-localized, proton-coupled sucrose carrier ZmSUT1 mediates sucrose efflux under the control of the sucrose gradient and the proton motive force. J Biol Chem. 2005;280(22):21437.
- Schulz A, Beyhl D, Marten I, et al. Proton-driven sucrose symport and antiport are provided by the vacuolar transporters SUC4 and TMT1/2. Plant J. 2011;68:129–136.
- Williams LE, Lemoine R, Sauer N. Sugar transporters in higher plants—A diversity of roles and complex regulation. Trends Plant Sci. 2000;5:283–290.
- Guo PA, Zheng YC, He YY, et al. Isolation and functional characterization of SUCROSE SYNTHASE 1 and SUCROSE TRANSPORTER 2 promoters from ramie (Boehmeria nivea L. Gene. 2019;685:114–124.
- Weschke W, Panitz R, Sauer N, et al. Sucrose transport into barley seeds: molecular characterization of two transporters and implications for seed development and starch accumulation. Plant J. 2000;21(5):455–467.
- Doidy J, van Tuinen D, Lamotte O, et al. The Medicago truncatula sucrose transporter family: characterization and implication of key members in carbon partitioning towards Arbuscular Mycorrhizal Fungi. Mol Plant. 2012;5:1346–1358.
- Li CL, Meng D, Piñeros MA, et al. A sugar transporter takes up both hexose and sucrose for sorbitol-modulated in vitro pollen tube growth in apple. Plant Cell. 2020;32(2):449–469.
- Li F, Wu B, Qin X, et al. Molecular cloning and expression analysis of the sucrose transporter gene family from Theobroma cacao L. Gene. 2014;546(2):336–341.
- Lu MZ, Snyder R, Grant J, et al. Manipulation of sucrose phloem and embryo loading affects pea leaf metabolism, carbon and nitrogen partitioning to sinks as well as seed storage pools. Plant J. 2020;101(1):217–236.
- Ishibashi Y, Okamura K, Miyazaki M, et al., Expression of rice sucrose transporter gene OsSUT1 in sink and source organs shaded during grain filling may affect grain yield and quality. Environmental & Experimental Botany. 2014;97:49–54.
- Wang LF, Qi XX, Huang XS, et al., Overexpression of sucrose transporter gene PbSUT2 from Pyrus bretschneideri enhances sucrose content in Solanum lycopersicum fruit. Plant Physiology & Biochemistry. 2016;105:150–161.
- Sivitz AB, Reinders A, Johnson ME, et al. Arabidopsis sucrose transporter AtSUC9. High-affinity transport activity, intragenic control of expression, and early flowering mutant phenotype. Plant Physiol. 2007;143(1):188–198.
- Sun F, Zhu L, Wang X, et al. Sucrose transportation control mediates the fresh-keeping effects of burdock fructooligosaccharide in ‘Crimson Seedless’ grapes. Food Chem. 2020;332:127437.
- Zhu M, Yu J, Tang W, et al. Role of calcium in regulating anthocyanin accumulation in ‘Manicure Finger’ grape berries. Sci Hortic. 2019;256:108585.
- Shakya R, Sturm A. Characterization of source- and sink-specific sucrose/H+ symporters from carrot. Plant Physiol. 1998;118(4):1473–1480.
- Miyazaki M, Araki M, Okamura K, et al. Assimilate translocation and expression of sucrose transporter, OsSUT1, contribute to high-performance ripening under heat stress in the heat-tolerant rice cultivar Genkitsukushi. J Plant Physiol. 2013;170(18):1579–1584.
- Noiraud N, Delrot S, Lemoine R. The sucrose transporter of Celery. identification and expression during salt stress. Plant Physiol. 2000;122(4):1447–1455.
- Eddy SR. Profile hidden Markov models. Bioinformatics. 1998;14:755–763.
- Altschul SF, Madden TL, Schaffer AA, et al. Gapped BLAST and PSI-BLAST: a new generation of protein database search programs. Nucleic Acids Res. 1997;25:3389–3402.
- Bjellqvist B, Basse B, Olsen E, et al. Reference points for comparisons of two-dimensional maps of proteins from different human cell types defined in a pH scale where isoelectric points correlate with polypeptide compositions. Electrophoresis. 1994;15(1):529–539.
- Chen C, Chen H, Zhang Y, et al. TBtools: an Integrative Toolkit Developed for Interactive Analyses of Big Biological Data. Mol Plant. 2020;13(8):1194–1202.
- Thompson JD, Gibson TJ, Higgins DG. Multiple sequence alignment using ClustalW and ClustalX. Curr Protoc Bioinformatics. 2003;1:2–3.
- Kumar S, Stecher G, Li M, et al. MEGA X: molecular evolutionary genetics analysis across computing platforms Molecular biology and evolution. Molecular Biology and Evolution. 2018;35(6):1547.
- Hu B, Jin J, Guo A-Y, et al. GSDS 2.0: an upgraded gene feature visualization server. Bioinformatics. 2015;31(8):1296–1297.
- Voorrips RE. MapChart: software for the graphical presentation of linkage maps and QTLs. J Heredity. 2002;93(1):77–78.
- Lescot M, Déhais P, Thijs G, et al. PlantCARE, a database of plant cis-acting regulatory elements and a portal to tools for in silico analysis of promoter sequences. Nucleic Acids Res. 2002;30(1):325–327.
- Howe EA, Sinha R, Schlauch D, et al. RNA-Seq analysis in MeV. Bioinformatics. 2011;27(22):3209–3210.
- Sauer N, Ludwig A, Knoblauch A, et al. AtSUC8 and AtSUC9 encode functional sucrose transporters, but the closely related AtSUC6 and AtSUC7 genes encode aberrant proteins in different Arabidopsis ecotypes. Plant J. 2004;40(1):120–130.
- Sylvie L, Wolf F. SUT sucrose and MST monosaccharide transporter inventory of the Selaginella genome. Front Plant Sci. 2012;3:24.
- Lubkowitz M. The Oligopeptide Transporters: a small gene family with a diverse group of substrates and functions? Mol Plant. 2011;4(3):407–415.
- Fan K, Mao ZJ, Ye FT, et al. Genome-wide identification and molecular evolution analysis of the heat shock transcription factor (HSF) gene family in four diploid and two allopolyploid Gossypium species. Genomics. 2021;113(5):3112–3127.
- Xu G, Guo C, Shan H, et al. Divergence of duplicate genes in exon-intron structure. Proc Nat Acad Sci. 2012;109(4):1187–1192.
- Ting F, Yuan P, Rao Y, et al. Genome-wide identification and expression analysis of sugar transporter (ST) gene family in Longan (Dimocarpus longan L.). Plants. 2020;9(3):342.
- Durand M, Mainson D, Porcheron B, et al. Carbon source-sink relationship in Arabidopsis thaliana: the role of sucrose transporters. Planta. 2018;247(3):587–611.
- Doidy J, Grace E, Kühn C, et al. Sugar transporters in plants and in their interactions with fungi. Trends Plant Sci. 2012;17(7):413–422.
- Mehan MR, Freimer NB, Ophoff RA. A genome-wide survey of segmental duplications that mediate common human genetic variation of chromosomal architecture. Hum Genomics. 2004;1(5):335–344.
- Wang J, Zhang YX, Xu N, et al. Genome-wide identification of CK gene family suggests functional expression pattern against Cd2+ stress in Gossypium hirsutum L. Int J Biol Macromol. 2021;188:272–282.
- Maere S, De BS, Raes J, et al. Modeling gene and genome duplications in eukaryotes. Proc Nat Acad Sci. 2005;102(15):5454–5459.
- Blanc G, Wolfe KH. Functional Divergence of Duplicated Genes Formed by Polyploidy during Arabidopsis Evolution[W]. Plant Cell. 2004;16(7):1679–1691.
- Yan N. Structural advances for the major facilitator superfamily (MFS) transporters. Trends Biochem Sci. 2013;38(3):151–159.
- Tang J, Zhang BL, Wang ZH, et al. Cloning and expression analysis of PpSUT2 encoding a sucrose transporter in pear. Genet Mol Res. 2014;13(4):8932–8945.
- Zhang J, Lv J, Dawuda MM, et al. Appropriate ammonium-nitrate ratio improves nutrient accumulation and fruit quality in pepper (Capsicum annuum L.). Agronomy. 2019;9(11):683.
- Akladious SA, Mohamed HI. Ameliorative effects of calcium nitrate and humic acid on the growth, yield component and biochemical attribute of pepper (Capsicum annuum) plants grown under salt stress. Sci Hortic. 2018;236(16):244–250.
- H JJ, L K, Y B, et al. Genome-Wide Analysis and Expression Profiling of the SUC and SWEET Gene Families of Sucrose Transporters in Oilseed Rape (Brassica napus L.). Front Plant Sci. 2016;7:1464.
- Martínez IM, Chrispeels MJ. Genomic analysis of the unfolded protein response in Arabidopsis shows its connection to important cellular processes. Plant Cell. 2003;15(12):561–576.
- Li CN, Srivastava MK, Nong Q, et al. Molecular cloning and characterization of SoNCED, a novel gene encoding 9-cis-epoxycarotenoid dioxygenase from sugarcane (Saccharum officinarum L.). Genes Genomics. 2013;35(1):101–109.
- Yalpani N, Enyedi AJ, León J, et al. Ultraviolet light and ozone stimulate accumulation of salicylic acid, pathogenesis-related proteins and virus resistance in tobacco. Planta. 1994;193(3):372–376.
- Vanneste S, Friml J. Auxin: a trigger for change in plant development. Cell. 2009;136(6):1005–1016.
- Bihmidine S, Hunter CT, Johns CE, et al. Regulation of assimilate import into sink organs: update on molecular drivers of sink strength. Front Plant Sci. 2013;4:177.
- Zhang HP, Zhang SJ, Qin GH, et al. Molecular cloning and expression analysis of a gene for sucrose transporter from pear (Pyrus bretschneideri Rehd.) fruit. Plant Physiol Biochem. 2013;73:63–69.
- Lim JD, Cho JI, Park YI, et al. Sucrose transport from source to sink seeds in rice. Physiol Plant. 2006;126(4):572–584.
- Milne R, Byrt J, C S, et al. Are sucrose transporter expression profiles linked with patterns of biomass partitioning in Sorghum phenotypes? Front Plant Sci. 2013;4:223.
- Carpaneto A, Geiger D, Bamberg E, et al. Phloem-localized, proton-coupled sucrose carrier ZmSUT1 mediates sucrose efflux under the control of the sucrose gradient and the proton motive force. J Biol Chem. 2005;280(22):21437–21443.
- Berthier A, Desclos M, Amiard V, et al. Activation of sucrose transport in defoliated Lolium perenne L.: an example of apoplastic phloem loading plasticity. Plant Cell Physiol. 2009;50(7):1329–1344.
- Liesche J, Schulz A, Krügel U, et al. Dimerization and endocytosis of the sucrose transporter StSUT1 in mature sieve elements. Plant Signal Behav. 2008;3:1136–1137.
- Cai Y, Jing Y, Li Q, et al. Sucrose transporters of resistant grapevine are involved in stress resistance. Plant Mol Biol. 2019;100(1):111–132.
- Gong X, Liu ML, Zhang LJ, et al. Arabidopsis AtSUC2 and AtSUC4, encoding sucrose transporters, are required for abiotic stress tolerance in an ABA-dependent pathway. Physiol Plant. 2015;153(1):119–136.
- Siahpoosh MR, Sanchez DH, Schlereth A, et al. Modification of OsSUT1 gene expression modulates the salt response of rice Oryza sativa cv. Taipei 309. Plant Sci. 2012;182:101–111.
- Wang D, Liu H, Wang H, et al. A novel sucrose transporter gene IbSUT4 involves in plant growth and response to abiotic stress through the ABF-dependent ABA signaling pathway in Sweetpotato. BMC Plant Biol. 2020;20(1):1–15.
- Ping C, Hsiao HH, Chen HJ, et al. Influence of temperature on the expression of the rice sucrose transporter 4 gene, OsSUT4, in germinating embryos and maturing pollen. Acta Physiologiae Plantarum. 2014;36(1):217–229.
- Miyazaki M, Araki M, Okamura K, et al. Assimilate translocation and expression of sucrose transporter, OsSUT1, contribute to high-performance ripening under heat stress in the heat-tolerant rice cultivar Genkitsukushi. J Plant Physiol. 2013;170(18):1579–1584.
- Q.j M, M.h S, Kang H, et al. A CIPK protein kinase targets sucrose transporter MdSUT2. 2 at Ser254 for phosphorylation to enhance salt tolerance. Plant Cell Environ. 2019;42(3):918–930.
- Xue GP, McIntyre CL, Glassop D, et al. Use of expression analysis to dissect alterations in carbohydrate metabolism in wheat leaves during drought stress. Plant Mol Biol. 2008;67(3):197–214.