
Abstract
In situ X-ray synchrotron tomography was used to investigate the stress corrosion cracking behavior of under-aged Al–Zn–Mg–Cu alloy in moisture. The discontinuous surface cracks (crack jumps) mentioned in the literature are actually a single continuous and tortuous crack when observed in three dimension (3D). Contrary to 2D measurements made at the surface which suggest non-uniform crack growth rates, 3D measurements of the crack length led to a much more accurate measurement of crack growth rates.
Al 7075 alloys are used extensively due to their high strength-to-weight ratio.[Citation1] However, they are susceptible to stress corrosion cracking (SCC) and show a significant increase in crack growth rate in the presence of moisture, especially in the peak-aged and under-aged condition.[Citation2,Citation3] Hydrogen embrittlement has been attributed as a possible mechanism for this increase in crack growth rate.[Citation3,Citation4]
Several studies have looked at the crack growth behavior of aluminum alloys. Discontinuous surface cracks (crack jumps) were observed during SCC of aluminum alloys.[Citation5] These discontinuous surface cracks have also been observed in steel during SCC.[Citation6,Citation7] It was suggested that the cracking is discontinuous where surface cracks nucleate in front of the main crack, grow separately and then combine with the main crack.[Citation5,Citation7] Many studies have used surface measurements (using optical techniques, for example) to quantify SCC behavior.[Citation8–10] This approach may be inaccurate since the crack growth behavior in the interior of the specimen and at the surface may be quite different due to differences in stress state.[Citation11]
It is clear that a thorough understanding of the cracking behavior in SCC requires a quantification of the crack growth behavior in three dimensions (3D). Furthermore, the experiments must be carried out in situ to verify whether the ‘crack jumps’ are indeed jumps. X-ray tomography is an excellent technique to study the behavior of materials under mechanical loading in 3D and 4D (the fourth dimension here is time). In particular, in situ mechanical testing is more promising where visualization and quantification of the microstructure changes can be performed with time. In situ experiments under tension,[Citation12] cyclic loading,[Citation13,Citation14] corrosion-fatigue,[Citation15] and SCC [Citation16–18] have been conducted using X-ray tomography.
In this study, we have used X-ray synchrotron tomography to study the crack growth behavior of under-aged AA7075 in moisture. We were able to unequivocally determine whether the SCC cracks were discontinuous or simply a single tortuous crack. The SCC crack growth rates were measured and compared using the surface measurement (2D) and bulk measurement (3D). By using the in situ tomography approach it was possible to quantify the evolution of crack growth under SCC.
X-ray synchrotron tomography was performed at the 2-BM beamline of the Advanced Photon Source (APS) at Argonne National Laboratory. The details of the tomography system at 2-BM have been described elsewhere.[Citation19,Citation20] A monochromatic beam with energy of 24.3 keV was focused on the specimen. A LuAG:Ce scintillator screen was used to convert the transmitted X-rays to visible light. This was coupled with a 5× objective lens and a CCD camera (PCO Tech edge camera, Romulus, Michigan) to achieve pixel sizes of 1.3 μm. 2D projections were collected at an angular increment of 0.12° for a total of 1500 projections. These 2D projections were then reconstructed using the Gridrec fast Fourier transform-based algorithm. The grayscale images obtained after reconstructions were segmented using conventional thresholding using image analysis software (ImageJ, Bethesda, MD). 3D rendering of these segmented SCC cracks was performed in Avizo® Fire (VSG, Burlington, MA) for visualization purposes.
A commercially available AA7075-T651 was solution-heat-treated at 475 °C for 2 h followed by quenching in water and then aging for 80 min at 120 °C to obtain an under-aged condition (Vickers hardness of ∼138 HV). Single-edge-notch specimens (20 mm × 2.8 mm × 0.8 mm) were machined by electro-discharge machining such that the loading direction was along the short-transverse (S-T) orientation. The longest dimension (20 mm) is along the loading direction and the lowest dimension (0.8 mm) is the thickness. A width of 2.8 mm was chosen due to limited field of view (∼3 mm, necessary to achieve a 2 μm resolution at the APS). The thickness of 0.8 mm was chosen on the basis of two factors: The ability to easily nucleate a crack on the microforce testing system (MTS Tytron 250) having a maximum capacity of ∼240 N and the ability to observe the long growth of the crack while maintaining the diagonal dimension of the sample to be less than 3 mm. Fatigue precracking was performed ex situ on a microforce testing system (MTS Tytron 250) in tension–tension fatigue (4 Hz, R=0.1). The precrack length was about 1 mm. The SCC experiments were performed in the in situ loading stage as shown in (a). The upper grip was attached to the stepper motor with a linear actuator, which imposes a displacement on the sample to achieve the desire load. The linear actuator was capable of 8 μm per step and a total stroke of 25 mm. The load cell had a capacity of 500 N. The load was transmitted from the top of the stage to the bottom through a polymer sleeve (Poly methyl methacrylate or PMMA). The PMMA material was chosen due to its transparency to X-rays. The actuator can be controlled automatically using feedback from the load cell.
Figure 1. (a) In situ mechanical loading stage, and (b) schematic of in situ stage for SCC experiments in moisture. The PMMA sleeve is not shown in (b) to show the arrangements clearly.
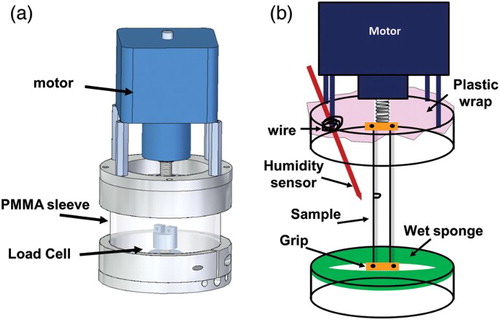
A schematic of the in situ loading stage to perform the SCC experiments in moisture is shown in (b). The PMMA sleeve has not been shown here for clear visualization of the arrangements inside the stage. The sample was loaded on both sides using grips attached to the actuator on one side and the load cell on the other. To introduce moisture into the cell, an annular (ring shape) wet sponge was placed around the load cell at the base of the loading stage. Since SCC experiments require long exposures to moisture, maintaining a constant humidity inside the chamber is a big challenge as fluctuations can lead to variability in results. In order to minimize the loss of moisture and to maintain constant relative humidity, the top part of the loading stage was covered with a plastic wrap as shown in (b). A humidity sensor was placed in front of the notch to measure the relative humidity throughout the test. These arrangements led to the constant humidity of 95–96% inside the system throughout the test. Samples were placed inside the deionized water for about a week before starting the SCC test in moisture at Argonne National Laboratory.
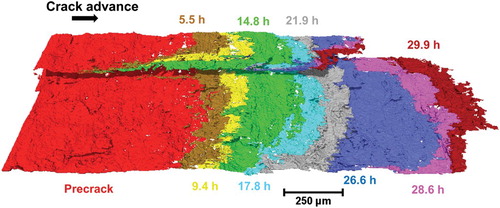
shows the 3D rendering of the SCC crack in moisture, where each color represents time (cumulative) during which the stress corrosion cracks grew at a constant load of 110 N. Two independent cracks (not connected in 3D) were observed, where the bottom crack almost covers the entire thickness. It is interesting to note that there is a significant variation in the crack length through the thickness and therefore variation in crack growth rate.
Figure 2. 3D SCC crack growth profile in moisture as a function of time. Significant variation of crack length through the thickness was observed.
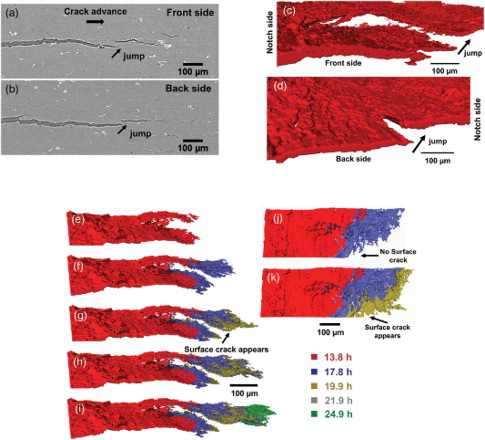
The discontinuous cracks on both sides of the specimen can clearly be seen from the 2D slices obtained from X-ray tomography after about 25 h of SCC, as shown in (a) and 3(b). These 2D images indicate that the second crack might have initiated in front of the first crack and then grew separately. However, 3D rendering of the crack in (c) and 3(d) actually show that these discontinuous surface cracks were connected in three dimensions. (e)–(i) shows the step-wise growth of the crack and the appearance of discontinuous surface cracks, observed in (a). The time interval is shown in the legend. It can be seen that the main crack grew from inside toward the surface ((e) and 3(f)) and finally appeared as a discontinuous crack on the surface ((g)), and then continued to grow. The appearance of discontinuous surface cracks can clearly be seen in (j), which was not in (i). Both, (i) and 3(j) are the top views of (f) and 3(g).
Figure 3. (a) and (b) are 2D slices of the sides of the specimen showing the discontinuous cracks (crack jump), (c) and (d) are the 3D reconstructions of part of the crack showing that the discontinuous crack at the surface are actually connected in 3D, (e)–(i) step wise growth of crack showing the appearance of the discontinuous crack (g) and then further growth, (j)–(k) top view of (f) and (g) showing that the surface crack does not appear in (j) but appears at (k).
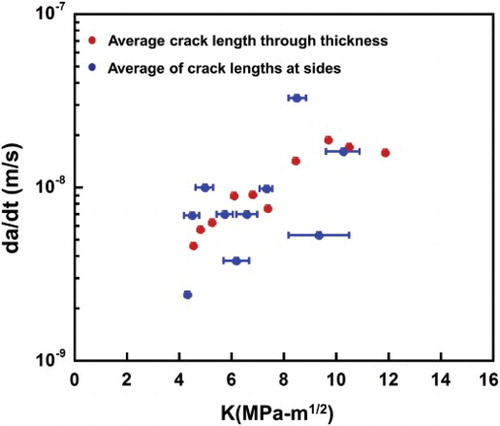
The crack growth rates were measured using the average of the crack lengths at both sides (2D measurement) and also the average crack lengths though thickness (3D measurement), as shown in . Using 2D slices of the 3D crack, the crack length increment (da) was measured. This increment in crack length was then divided by the time increment (dt) to obtain the crack growth rate. The same time interval (dt) was used for both types of measurement. It can be seen that the crack growth rate has a significant amount of variability when surface crack lengths were used for the measurement (2D) compared to the growth rate when the average crack length through thickness was used (3D). Moreover, a large deviation in the surface crack lengths resulted in significant differences in stress intensity factor, as shown as error bars in . These can be attributed to the highly non-uniform growth of the SCC crack at the surface which includes formation of discontinuous cracks and independent growth of the two cracks. The stress intensity factor (K) was calculated using the equations derived by Ahmad et al. [Citation21] for single-edge-notched specimens with fixed grip loading. Since the SCC experiment was performed at constant load, the stress intensity factor increases with an increase in the crack length. For a particular crack growth rate value (da/dt), the stress intensity factor value (in ) was taken as the average of the stress intensity factor values corresponding to the initial and final crack lengths for that particular time interval.
Figure 4. Crack growth rate measurement from average of the crack lengths (2D) and average of the crack length through thickness (3D). The 3D crack growth rate is quite uniform than that of the measurement based on 2D.
In summary, using the X-ray synchrotron tomography, we have shown that the discontinuous surface cracks formed during SCC of AA7075 in moisture were actually a single crack connected in three dimensions. These discontinuous surface cracks were formed when the internal main crack grew from inside the specimen and appeared on the surface. The crack growth rates as determined by measured crack lengths at the surface (2D) led to highly variable crack growth rates than when measured using average crack lengths through thickness (3D). The results obtained here show the importance and necessity of 3D techniques, such as X-ray synchrotron tomography, to study the crack growth behavior during SCC.
Acknowledgements
The authors are grateful for the financial support from the Office of Naval Research (ONR) under Contract No. N00014-10-1-0350 (Dr A. K. Vasudevan, Program Manager).
References
- Strake EA, Staley JT. Application of modern aluminum alloys to aircraft. Progr Aerosp Sci. 1996;32:131–172. doi: 10.1016/0376-0421(95)00004-6
- Speidel MO. Stress corrosion cracking of aluminum alloys. Metall Trans A. 1975;6:631–651. doi: 10.1007/BF02672284
- Holroyd NJH, Scamans GM. Crack propagation during sustained-load cracking of Al–Zn–Mg–Cu aluminum alloys exposed to moist air or distilled water. Metall Mater Trans A. 2011;42:3979–3998. doi: 10.1007/s11661-011-0793-x
- Burleigh TD. The postulated mechanisms for stress corrosion cracking of aluminum alloys: a review of the literature 1980–1989. Corrosion. 1991;47:89–98. doi: 10.5006/1.3585235
- Zhang J, Kalnaus S, Behrooz M, Jiang Y. Effect of loading history on stress corrosion cracking of 7075-T651 aluminum alloy in saline aqueous environment. Metall Mater Trans A. 2011;42:448–460. doi: 10.1007/s11661-010-0419-8
- Masuda H. SKFM observation of SCC on SUS304 stainless steel. Corros Sci. 2007;49:120–129. doi: 10.1016/j.corsci.2006.05.014
- Qiao LJ, Gao KW, Volinsky AA, Li XY. Discontinuous surface cracks during stress corrosion cracking of stainless steel single crystal. Corros Sci. 2011;53:3509–3514. doi: 10.1016/j.corsci.2011.06.019
- Dorward RC, Hasse KR. Incubation effects in precracked stress corrosion specimens from A1–Zn–Mg–Cu alloy 7075. Corros Sci. 1979;19:131–140. doi: 10.1016/0010-938X(79)90046-5
- Connolly BJ, Deffenbaugh KL, Moran AL, Koul MG. Environmentally assisted crack growth rates of high-strength aluminum alloys. J Mater. 2003;55:49–52.
- Arnold EM, Schubbe JJ, Moran PJ, Bayles RA. Comparison of SCC thresholds and environmentally assisted cracking in 7050-T7451 aluminum plate. J Mater Eng Perform. 2012;21:2480–2486. doi: 10.1007/s11665-012-0204-5
- Meyers M, Chawla KK. Mechanical behavior of materials. 2nd ed. Cambridge University Press; 2008.
- Williams JJ, Chapman NC, Jakkali V, Tanna VA, Chawla N, Xiao X, De Carlo F. Characterization of damage evolution in SiC particle reinforced Al alloy matrix composites by in situ X-ray synchrotron tomography. Metall Mater Trans A. 2011;42:2999–3005. doi: 10.1007/s11661-011-0718-8
- Williams JJ, Yazzie KE, Padilla E, Chawla N, Xiao X, De Carlo F. Understanding fatigue crack growth in aluminum alloys by in situ X-ray synchrotron tomography. Int J Fatigue. 2013;57:79–85. doi: 10.1016/j.ijfatigue.2012.06.009
- Williams JJ, Yazzie KE, Phillips NC, Chawla N, Xiao X, De Carlo F, Iyyer N, Kittur M. On the correlation between fatigue striation spacing and crack growth rate: a three-dimensional (3-D) X-ray synchrotron tomography study. Metall Mater Trans A. 2011;42:3845–3847. doi: 10.1007/s11661-011-0963-x
- Singh SS, Williams JJ, Xiao X, De Carlo F, Chawla N. In situ three dimensional (3D) X-ray synchrotron tomography of corrosion fatigue in Al 7075 alloy. In: Srivatsan TS, Imam AM, Srinivasan R, editors. Fatigue of materials II: advances and emergences in understanding. Pittsburgh: Materials Science and Technology; 2012. p. 17–25.
- Babout L, Marrow TJ, Engelberg D, Withers PJ. X-ray microtomographic observation of intergranular stress corrosion cracking in sensitised austenitic stainless steel. Mater Sci Tech. 2006;22:1068–1075. doi: 10.1179/174328406X114090
- Marrow TJ, Babout L, Jivkov AP, Wood P, Engelberg D, Stevens N, Withers PJ, Newman RC. Three dimensional observations and modelling of intergranular stress corrosion cracking in austenitic stainless steel. J Nucl Mater. 2006;352:62–74. doi: 10.1016/j.jnucmat.2006.02.042
- King A, Ludwig W, Engelberg D, Marrow TJ. Diffraction contrast tomography for the study of polycrystalline stainless steel microstructures and stress corrosion cracking. Rev Metall. 2011;108:47–50. doi: 10.1051/metal/2011042
- Williams JJ, Flom Z, Amell AA, Chawla N, Xiao X, De Carlo F. Damage evolution in SiC particle reinforced Al alloy matrix composites by X-ray synchrotron tomography. Acta Mater. 2010;58:6194–6205. doi: 10.1016/j.actamat.2010.07.039
- De Carlo F, Albee P, Chu YS, Mancini DC, Tieman B. High-throughput real-time X-ray microtomography at the advanced photon source. In: Bonse U, editor. Developments in X-Ray tomography III, Proc. SPIE, Vol. 4503. San Diego, California; 2002. p. 1–13.
- Ahmad J, Papaspyropoulos V, Hopper AT. Elastic-plastic analysis of edge-notched panels subjected to fixed grip loading. Eng Fract Mech. 1991;38:283–294. doi: 10.1016/0013-7944(91)90006-M