
Abstract
A low-density, nanocrystalline high-entropy alloy, Al20Li20Mg10Sc20Ti30 was produced by mechanical alloying. It formed a single-phase fcc structure during ball milling and transformed to single-phase hcp upon annealing. The alloy has an estimated strength-to-weight ratio that is significantly higher than other nanocrystalline alloys and is comparable to ceramics. High hardness is retained after annealing.
High-entropy alloys are a new class of multi-component alloy systems in which the design of the alloys is based not on adding solutes to a single ‘base’ element, but rather on choosing elements that will form solid solutions when mixed at near-equiatomic concentrations. This behavior has been attributed to the large configurational entropy when five of more elements at near-equiatomic ratios are mixed together.[Citation1,Citation2] These high-entropy alloys (HEAs) have demonstrated the potential for superior properties in many cases. A fundamental understanding of the mechanisms of phase stability of HEAs is still a topic of active research. Guo and Liu demonstrated that compositions likely to form solid solution HEAs have enthalpies of mixing between −22 and 7 kJ/mol and very small differences in atomic radius. The small enthalpy of mixing allows the configurational entropy to dominate the free energy and it has been proposed that the system behaves, in this case, more like an ideal solution.[Citation3] Otto et al. recently published a systematic investigation on the effect of entropy on phase stability of HEAs.[Citation4] The authors demonstrated that high configurational entropy is not the only sufficient criterion to predict whether an equiatomic multi-component alloy will form as a single-phase solid solution. In their study, they found only NiFeCrCoMn to be a single-phase fcc solid solution and HEA. These findings are consistent with the work of Guo and Liu [Citation3] as all the enthalpies of mixing in the respective binary alloys are relatively small and the atoms are similar in size. The authors then replaced individual elements in an equiatomic NiFeCrCoMn alloy one at a time with elements that have the same room temperature crystal structure, similar atomic size, and similar electronegativity as compared with the elements being replaced. All other substitutions to the NiFeCrCoMn alloy led to a multi-phase alloy. Although the replacement elements were ‘similar’ according to Hume-Rothery rules, the authors found that the substituted elements had a stronger propensity to form secondary phases or intermetallics in their respective binary alloys. This led the system to act less like an ideal solution and resulted in the formation of a multi-phase alloy with a reduced overall entropy.[Citation4] There has also been interest in finding descriptors to predict the likely crystallographic lattice (fcc or bcc) that the solid solution will form upon. One descriptor that has been reasonably successful in predicting the lattice structure is the average valence concentration (or average periodic table group number) (VEC).[Citation5] Fcc phases were determined to be more stable at higher values of VEC (≥ 8) while bcc phases were stable at lower VEC (<6.87). On the boundary between fcc and bcc (VEC = 8), the systems were found to be predominantly fcc but in some situations the bcc phase has been seen in minute amounts.
A quantitative prediction of whether multi-component systems would form into solid solutions (HEAs), intermetallic containing alloys, or metallic glasses has been presented by Yang and Zhang.[Citation6] They proposed parameters Ω and δ, where Ω is defined as a parameter of the entropy of mixing times the average melting temperature of the elements divided by the enthalpy of mixing. The parameter δ is the mean square deviation of the atomic size of the elements. Their model shows that the high-entropy stabilized solid solution alloys occur for values of Ω ≥ 1.1 and δ ≤ 6.6%. These quantitative predictions are mostly consistent with the empirical data in the literature albeit with a few exceptions.[Citation6]
While there is continuing high interest in development of alloys with low densities along with high strength for energy-saving applications such as in transportation and energy, to date there have only been a few reports of studies of low-density HEAs. For purposes of our discussion we define low density as less than 3 g cm−3. Juan et al. [Citation7] reported an Al20Be20Fe10Si15Ti35 alloy which had an as-cast microstructure composed of one major and two minor phases. It had a density of 3.91 g cm−3. Li et al. [Citation8,Citation9] studied Mg-containing HEAs. These authors prepared Mgx(MnAlZnCu)100−x alloys by induction melting and casting.[Citation8] The alloys had multi-phase structures, composed mainly of hcp phases and Al–Mn icosahedral quasicrystalline phases. Depending on the composition, the alloys had densities of 2.20–4.29 g cm−3. They exhibited good compressive strengths (400–500 MPa) at room temperature. However, ductilities were low, 3–5% in compression. Similar structures and mechanical properties were subsequently observed in the equiatomic system cast and cooled in air, water, or brine solutions.[Citation9] Chen et al. used mechanical alloying to prepare BeCoMgTi and BeCoMgTiZn, but the alloys formed only an amorphous phase.[Citation10] To our knowledge, no single-phase low-density high-entropy alloy (LDHEA) has been reported.
In this paper, we report our results on the processing, structure, and mechanical hardness of a low-density HEA.
Phase formation for HEAs can be predicted by calculating the parameters Ω and δ, proposed by Yang et al.[Citation6] Ω represents the competition between enthalpy and entropy, given by
(1)
where
is the melting temperature of the alloy,
is the entropy of mixing, and
is the enthalpy of mixing. δ represents the atomic size difference, given by
(2)
According to ref. [Citation6], Ω ≥ 1.1 and δ ≤ 6.6% should be expected as the criteria for forming high-entropy stabilized solid solution phases. Using data in ,[Citation11] the two parameters of our alloy Al20Li20Mg10Sc20Ti30 are Ω = 42.6 and δ = 5.2%. Therefore, it is expected to be a solid solution.
Table 1. Data from literature to calculate Ω and δ.[Citation2,Citation11]
Gao et al. [Citation12] produced low-density multi-component alloys: Sr20Ca20Yb20Mg20Zn20, Sr20Ca20Yb20Mg20Zn10Cu10, and Sr20Ca20Yb20(Li0.55Mg.45)20Zn20. However, the calculated values for Ω and δ fall out of the range [Citation6] that predicts solid solution phases. Indeed, these alloys were all found to be metallic glasses.
Due to the high vapor pressures of several of the elements (Li, Mg), we used mechanical alloying to prepare the alloys instead of melting and casting. The elemental components of better than 99% purity were obtained from Alfa Aesar. In the case of Sc, the as-received pellets were ball milled at liquid nitrogen temperature in order to obtain the starting powder. The powders for the alloy were loaded into a stainless steel vial with stainless steel balls in a high-purity argon atmosphere glove box (oxygen level < 1 ppm). A 20:1 ball-to-powder weight ratio was used. The milling process was performed in a modified SPEX 8000 mixer mill cooled by liquid nitrogen for 2 h, followed by milling at room temperature for 14 h. Liquid nitrogen milling was carried out in order to avoid welding of the powders at the beginning of the mechanical milling process.
The milled powder samples were characterized by X-ray diffraction (XRD) using a Rigaku diffractometer with Cu Kα radiation. Analysis of the crystal structures of the contaminated alloys was done using the PM2 K Whole Powder Pattern Modeling software.[Citation13] Samples were compacted into 6.25 mm diameter disks 3 mm thick under 2 GPa pressure. Microhardness of the milled powder, compacted to full density at room temperature, was measured using a Buehler Micromet microhardness tester with a Vickers indenter at 50 g load and a loading time of 15 s. Under these conditions, the indentation depth is approximately 5.9 µm.
A transmission electron microscopy (TEM) specimen of the as-milled powder was prepared by compacting the powder into a 3 mm diameter disk. Thinning was accomplished using a twin-jet electropolisher with a solution of perchloric acid and methanol. TEM analysis was conducted using a JEOL 2000FX TEM at an accelerating voltage of 200 kV.
The density functional theory (DFT) calculations were performed by the package of the exact muffin-tin orbital method combined with coherent potential approximation or EMTO-CPA.[Citation14] This computational method has been widely used for solid solution systems, for example, stainless steels [Citation15] and NiFeCrCoMn.[Citation16]
The results of our mechanical alloying of the selected alloy, Al20Li20Mg10Sc20Ti30, must be divided into two materials—one which contained mainly the five components intentionally added, and another, which besides these components had significant impurity content of nitrogen and oxygen.
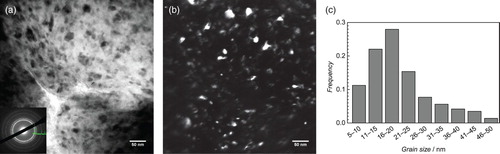
The material prepared by mechanical alloying which did not have the high N, O impurity levels was observed to have a single-phase fcc crystal structure in the as-milled condition, as illustrated in . It had a nanocrystalline grain size estimated by the Scherrer formula to be about 12 nm. The lattice parameter of this sample determined by the method of Cohen was found to be 0.4323 nm. The mechanical hardness of this sample was very high 5.8 GPa. After annealing this sample at 500°C for 1 h, the crystal structure changed as shown in . The new structure was indexed as hcp with c/a ratio of 1.588. The grain size, again estimated by the Scherrer method, was 26 nm and the mechanical hardness dropped to 4.9 GPa. TEM measurements of the as-milled material, shown in , generally agree with the XRD results, giving an average grain size of 20 nm and showing no second phases in the diffraction pattern.
Figure 1. XRD pattern of as-milled alloy.
Figure 2. XRD pattern of uncontaminated alloy after annealing at 500°C.
Figure 3. (a) Bright field TEM image and diffraction pattern, (b) dark field image, and (c) grain size distribution of as-milled uncontaminated material.
The material with the higher N and O concentrations (0.4 at% N, 1.39 at.% O as determined by chemical analysis) apparently obtained this contamination from a batch of Sc powder which was contaminated during the process of converting the as-received pellets into powder by cryomilling. Subsequent batches did not contain these impurities and were used in the sample described above. The contaminated sample exhibited an as-milled structure essentially identical to that of the un-contaminated sample, that is, single-phase fcc with a grain size of about 12 nm. However, it had a slightly higher mechanical hardness of 6.1 GPa. After annealing at 500°C and 800°C, the structure remained similar to fcc, but some splitting of the diffraction peaks was observed in the XRD results, suggesting either a slight distortion from a perfect cubic lattice or separation into two similar phases with a lattice parameter difference <1%. Annealing at 500°C decreased the hardness to only 5.9 GPa, while annealing at 800°C resulted in a hardness of 5.75 GPa, consistent with a nanocrystalline grain size. Because of the diffraction peak splitting, the grain size cannot be accurately measured using the Scherrer method, but the broadness of the peaks indicated that the samples are still nanocrystalline after the annealing treatments. The crystal structures, grain size, lattice parameters, and mechanical hardness for these samples are summarized in .
Table 2. Properties of alloys prepared.
It has been suggested that one needs very low heats of mixing, approaching ideal behavior, to form solid solutions in these multi-component systems. So it is of high interest that this five component system was found to exhibit a single-phase fcc solid solution in spite of the fact that many of the binary systems in this group exhibit immiscibility (high positive heats of mixing) or form many intermediate phases (high negative heats of mixing). Comparisons of the enthalpy of formation of the solid solution fcc and hcp crystal structures as calculated by DFT show that the hcp phase is the energetically preferred phase, with an enthalpy of formation 0.977 kJ mol−1 smaller than the fcc phase.
The sample containing oxygen and nitrogen likely did not transform to hcp upon annealing as the hcp cell contains smaller octahedral interstitial sites. The amount of space for an interstitial atom can be approximated as the distance from the center of the interstitial site to the nearest atomic position minus the average atomic radius of the alloy. Using the lattice parameters measured by XRD, for the fcc octahedral site this distance is 64.4 pm, while for the hcp octahedral site it is 54.7 pm, 15% smaller.
The high mechanical hardness of these alloys can partly be explained by their nanocrystalline grain sizes. However, their hardness values exceed nanocrystalline Al base alloys, for example, by factors of 2–3 times.[Citation17] Because the equilibrium phase is hcp, this suggests that the stacking fault energy of the fcc phase is very low, which may also contribute to the high strength.[Citation18] A comparison of the strength (estimated as hardness/3) and density of these alloys with other structural materials is given in . It is clear that these materials are comparable in strength/density values to ceramic materials such as SiC. However, our metallic alloys should exhibit much higher toughness and ductility, which is indicated from the tendency of the powder to weld during milling, the near full density of the compacted powder at room temperature, and the absence of micro cracks around the indents during microhardness indentation.
Figure 4. Ashby plot of strength vs. density for engineering materials. (Yield strength for metals and polymers, tear strength for elastomers, compressive strength for ceramics,[Citation19] and tensile strength for composites.) Reproduced with permission from Elsevier 2010.[Citation20]
![Figure 4. Ashby plot of strength vs. density for engineering materials. (Yield strength for metals and polymers, tear strength for elastomers, compressive strength for ceramics,[Citation19] and tensile strength for composites.) Reproduced with permission from Elsevier 2010.[Citation20]](/cms/asset/63c4348b-ea31-4393-96aa-5a6ce00c7c3f/tmrl_a_985855_f0004_c.jpg)
A low-density (2.67 g cm−3) high-entropy alloy with composition Al20Li20Mg10Sc20Ti30 has been prepared by mechanical alloying of elemental powders. The as-milled structure is single-phase fcc, with a nanocrystalline grain size of 12 nm, and a mechanical hardness of 5.9 GPa. The sample without O, N contamination transforms to the hcp structure on annealing at 500°C. The sample containing O, N does not transform, but rather exhibits either a slight phase separation or unit cell distortion upon annealing at 800°C. Calculations of the energies of the competing structures are consistent with the experimental observations. This material exhibits a combination of hardness (strength) and low density that is not equaled by any other metallic material.
These results need to be expanded to a study of this alloy system with various compositions, preparation by processes closer to equilibrium than mechanical alloying, and a detailed study of the mechanical behavior of these unique metallic materials.
Acknowledgements
The authors wish to acknowledge the partial support of this research by the National Science Foundation from the Metals and Metallic Nanostructures program under grant DMR-1104930.
Disclosure statement
No potential conflict of interest was reported by the author(s).
ORCID
Alexander J. Zaddach http://orcid.org/0000-0003-0530-0427
References
- Yeh J-W, Chen S-K, Lin S-J, Gan J-Y, Chin T-S, Shun T-T, Tsau C-H, Chang S-Y. Nanostructured high-entropy alloys with multiple principal elements: novel alloy design concepts and outcomes. Adv Eng Mater. 2004;6:299–303. doi: 10.1002/adem.200300567
- Zhang Y, Zuo TT, Tang Z, Gao MC, Dahmen KA, Liaw PK, Lu ZP. Microstructures and properties of high-entropy alloys. Prog Mater Sci. 2014;61:1–93. doi: 10.1016/j.pmatsci.2013.10.001
- Guo S, Liu CT. Phase stability in high entropy alloys: formation of solid-solution phase or amorphous phase. Prog Nat Sci Mater Int. 2011;21:433–446. doi: 10.1016/S1002-0071(12)60080-X
- Otto F, Yang Y, Bei H, George EP. Relative effects of enthalpy and entropy on the phase stability of equiatomic high-entropy alloys. Acta Mater. 2013;61:2628–2638. doi: 10.1016/j.actamat.2013.01.042
- Guo S, Ng C, Lu J, Liu C. Effect of valence electron concentration on stability of fcc or bcc phase in high entropy alloys. J Appl Phys. 2011;109:103505. doi: 10.1063/1.3587228
- Yang X, Zhang Y. Prediction of high-entropy stabilized solid-solution in multi-component alloys. Mater Chem Phys. 2012;132:233–238. doi: 10.1016/j.matchemphys.2011.11.021
- Juan C-C, Yeh J-W, Chin T-S. A novel light high-entropy alloy Al20Be20Fe10Si15Ti35. Paper presented at: E-MRS Fall Meeting, Symposium I; 2009 Sept 14–18; Warsaw, Poland.
- Li R, Gao JC, Fan K. Study to microstructure and mechanical properties of Mg containing high entropy alloys. Mater Sci Forum. 2010;650:265–271
- Li R, Gao JC, Fan K. Microstructure and mechanical properties of MgMnAlZnCu high entropy alloy cooling in three conditions. Mater Sci Forum. 2011;686:235–241.
- Chen Y-L, Tsai C-W, Juan C-C, Chuang M-H, Yeh J-W, Chin T-S, Chen S-K. Amorphization of equimolar alloys with HCP elements during mechanical alloying. J Alloys Compd. 2010;506:210–215. doi: 10.1016/j.jallcom.2010.06.179
- Takeuchi A, Inoue A. Classification of bulk metallic glasses by atomic size difference, heat of mixing and period of constituent elements and its application to characterization of the main alloying element. Mater Trans. 2005;46:2817–2829. doi: 10.2320/matertrans.46.2817
- Gao XQ, Zhao K, Ke HB, Ding DW, Wang WH, Bai HY. High mixing entropy bulk metallic glasses. J Non Cryst Solids. 2011;357:3557–3560. doi: 10.1016/j.jnoncrysol.2011.07.016
- Leoni M, Confente T, Scardi P. PM2K: a flexible program implementing whole powder pattern modelling. Zeitschrift für Kristallographie Suppl. 2006;23:249–254. doi: 10.1524/zksu.2006.suppl_23.249
- Vitos L. Computational quantum mechanics for materials engineers: the EMTO method and applications. London: Springer-Verlag; 2007.
- Vitos L, Korzhavyi PA, Johansson B. Stainless steel optimization from quantum mechanical calculations. Nat Mater. 2003;2:25–28. doi: 10.1038/nmat790
- Zaddach AJ, Niu C, Koch CC, Irving DL. Mechanical properties and stacking fault energies of NiFeCrCoMn high-entropy alloy. JOM. 2013;65:1780–1789. doi: 10.1007/s11837-013-0771-4
- Youssef KM, Scattergood RO, Murty KL, Koch CC. Nanocrystalline Al–Mg alloy with ultrahigh strength and good ductility. Scr Mater. 2006;54:251–256. doi: 10.1016/j.scriptamat.2005.09.028
- Bahmanpour H, Kauffmann A, Khoshkhoo MS, Youssef KM, Mula S, Freudenberger J, Eckert J, Scattergood RO, Koch CC. Effect of stacking fault energy on deformation behavior of cryo-rolled copper and copper alloys. Mater Sci Eng A Struct Mater. 2011;529:230–236. doi: 10.1016/j.msea.2011.09.022
- Budinski KG, Budinski MK. Engineering materials: properties and selection. 8th ed. Upper Saddle River, NJ: Pearson Prentice Hall; 2005.
- Ashby MF. Materials selection in mechanical design. 4th ed. Saint Louis, MO: Elsevier Science & Technology; 2010.