
Abstract
Coherent dendritic α-Fe2O3 precipitates were observed to form at the surface of epitaxial films of (Bi0.75Nd0.25)(Fe0.97Ti0.03)O3 (BNFO) grown by pulsed laser deposition. The Fe2O3 dendrites are assemblages of nanosized particles with an approximate length of 500 nm. Through the use of atomic resolution scanning transmission electron microscopy, a transition zone at the BNFO/α-Fe2O3 interface, ∼2 unit-cells wide, was observed to be Fe2O3-rich with the perovskite structure. It is proposed that the formation of the Fe2O3-rich perovskite structure encourages epitaxial growth of the α-Fe2O3 rather than the formation of the incoherent Fe2O3 particulate second phase frequently reported in BiFeO3-based thin films.
Impact Statement The discovery of the new structure may explain the abnormally high ferromagnetic response observed in the BiFeO3-based single-phase epitaxial films, and will benefit the communities of materials science.
GRAPHICAL ABSTRACT
BiFeO3 has attracted much attention in the last 10 years due to its unique combination of magnetic (TN = 370°C) and ferroelectric (TC = 830°C) phase transitions above room temperature.[Citation1,Citation2] Extensive investigations of doping on the A- and B-sites have been carried out to lower the TC as well as improve the electrical properties for potential applications.[Citation3–9] For example, various BiFeO3-based thin films fabricated via pulsed laser deposition (PLD) have been developed to enhance the breakdown strengths with respect to bulk materials.[Citation10–16] One of the common issues encountered in BiFeO3-based thin films is the appearance of parasitic second phases, that is, iron-oxides such as α-Fe2O3 and γ-Fe2O3.[Citation13–15] In a previous study, an unusual Fe2O3-rich perovskite nanophase was observed by aberration-corrected scanning transmission electron microscopy (STEM) in an epitaxial (Bi0.75Nd0.25)(Fe0.97Ti0.03)O3 (BNFO) perovskite film on SrRuO3/SrTiO3 substrate.[Citation16] The Fe2O3-rich perovskite nanophase grows coherently with the BNFO matrix in the upper relaxed region of the BNFO film, observed in parts of a cross-sectional BNFO/SrRuO3/SrTiO3 sample. In this study, dendritic α-Fe2O3 precipitates are also reported at the surface region of the BNFO film. However, unlike the other BiFeO3-based epitaxial films in which the parasitic Fe2O3 phase is readily identified by X-ray diffraction (XRD), here no second phase peaks were identified in the BNFO film by this method, due to the total volume of the fine nanoprecipitate beings not sufficient to produce a peak above the noise of a XRD pattern. Atomic-resolved STEM analysis revealed that the α-Fe2O3 phase grows coherently with the BNFO matrix. At the α-Fe2O3 dendrite/BNFO matrix interface, a thin region (∼2 pseudocubic unit cells) of coherent Fe2O3-rich perovskite structure was observed to promote the epitaxial growth of the α-Fe2O3 rather than incoherent Fe2O3 particulate second phase. The new structure may exist in many BiFeO3-based single-phase films reported before in which the crystal structures of the films were characterized solely using XRD, and may in part, explain the ferromagnetic response observed at room temperature.
A BNFO ceramic PLD target was prepared according to the process described in [Citation7,Citation8]. Films were deposited on (001) SrTiO3 (STO) substrates using a home-built PLD system with a 248 nm KrF excimer laser. The detailed film growth process is described in [Citation16]. Cross-sectional and plan-view transmission electron microscopy (TEM) samples were prepared with a dual beam FIB/SEM FEI Quanta 3D 200. Plan-view TEM samples were prepared by thinning the substrate side. Samples were finished in low-angle and low-voltage conditions to reduce ion-beam damage. A double aberration-corrected microscope JEM-Z3100F-R005 STEM/TEM operated at 300 keV was used to perform STEM analysis.
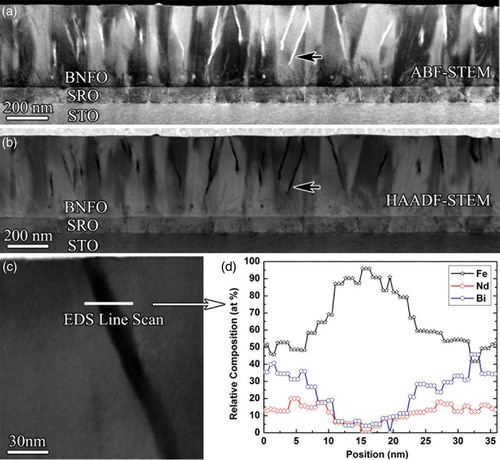
Figure (a) shows an annular bright field (ABF) STEM image of a cross-sectional sample which reveals some bright needle-shaped precipitates in the upper relaxed region of the BNFO film. The precipitates are dark in the corresponding high-angle annular dark field (HAADF) STEM image (Figure (b)). The contrasts in HAADF-STEM and ABF-STEM images suggest that the precipitates have a lower average atomic number than the surrounding BNFO matrix. The precipitates grow obliquely upwards inside the BNFO film, rather than the growth of the Fe2O3-rich perovskite nanophase perpendicular to the substrate found in a previous work.[Citation16] Figure (c) shows an enlarged HAADF-STEM image containing a precipitate, in which a white line illustrates the position for an X-ray energy-dispersive spectroscopy (EDS) line-scan analysis performed to check the chemical distribution in the BNFO matrix and the dark precipitate. Figure (d) shows the profiles of the relative composition (in atomic percentage at%) of the Fe, Nd and Bi cations (Ti was omitted due to the very weak Ti peaks which were barely above noise levels). The chemical profiles show that the cation composition of the BNFO matrix is close to the stoichiometry of the BNFO ceramic target. In contrast the precipitate is rich in Fe and deficient in Nd and Bi. In the center of the precipitate, the Fe content is as high as 96 at%, which suggests that the precipitate is an iron-oxide.
Figure 1. (Colour online) (a) ABF-STEM and (b) corresponding HAADF-STEM images of a cross-sectional sample showing the needle-shaped precipitates in the top of the BNFO film, as illustrated by the black arrows. (c) An HAADF-STEM image showing the position of a region of interest for the EDS line scan and (d) the corresponding composition profiles of Fe, Nd and Bi across the BNFO matrix and precipitate.
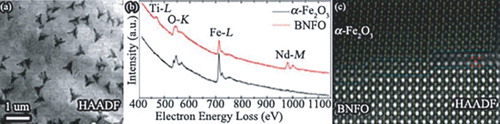
Plan-view samples were further prepared by thinning the substrate side to study the distribution of the iron-oxide precipitate in the BNFO film. Figure (a) shows a HAADF-STEM image of a plan-view sample, which reveals dark nanoprecipitates (∼10 nm) in the surface of the BNFO film. The nanoprecipitates assemble into dendrites with an approximate length of 500 nm. The precipitates are bright in the corresponding ABF-STEM image (Figure (b)). The shape and contrast as well as the electron energy-loss spectroscopy (EELS) analysis of the precipitates in the surface of the BNFO film suggest that they are the needle-shaped precipitates in the cross-sectional sample viewed end-on. The iron-oxide composition of the precipitate was confirmed by the EELS analysis. Figure (c) shows the EELS spectra acquired from the BNFO matrix and precipitate, respectively. A reference spectrum of Fe2O3 from the Gatan EELS Atlas is also plotted in Figure (c) for comparison.[Citation17] In contrast to the strong Ti-L2,3, and Nd-M4,5 peaks from the BNFO matrix, only weak Nd-M4,5 peaks were attained from the precipitate, indicating that it is Ti and Nd deficient with respect to the BNFO matrix. In addition, the electron energy-loss near-edge fine structure (ELNES) of the O-K and Fe-L2,3 edges of the precipitate are similar to those for Fe2O3 in the reference spectrum. It should be pointed out that it is not clear whether the reference spectrum was collected from α-Fe2O3 or from γ-Fe2O3. Nonetheless, α-Fe2O3, γ-Fe2O3 and Fe3O4 have very similar ELNES of O-K and Fe-L2,3 edges, and are difficult to differentiate by EELS with a normal energy resolution (∼1 eV) which is limited by the instrument.[Citation18] The crystal form of the iron-oxide can be readily identified with EELS when the energy resolution is better than 0.4 eV,[Citation19] which is not the case for the shown spectra.
Figure 2. (Colour online) (a) HAADF-STEM and (b) corresponding ABF-STEM images of a plan-view sample with local enlarged images (insets) showing the dendritic as well as dispersed round-shaped precipitates in the surface of the BNFO film. (c) EELS spectra acquired from the BNFO matrix and precipitate, respectively. A reference spectrum of Fe2O3 from Gatan EELS Atlas is plotted for comparison.[Citation17]
![Figure 2. (Colour online) (a) HAADF-STEM and (b) corresponding ABF-STEM images of a plan-view sample with local enlarged images (insets) showing the dendritic as well as dispersed round-shaped precipitates in the surface of the BNFO film. (c) EELS spectra acquired from the BNFO matrix and precipitate, respectively. A reference spectrum of Fe2O3 from Gatan EELS Atlas is plotted for comparison.[Citation17]](/cms/asset/c670597f-100c-470a-a15b-455552b85a23/tmrl_a_1160260_f0002_c.jpg)
Atomic-resolved HAADF-STEM and ABF-STEM analysis was further performed to identify the crystal structure of the dendritic precipitates. Figure (a) shows an atomic-resolution HAADF-STEM image of a coherently grown precipitate obtained along the pseudocubic zone-axis of the BNFO matrix. The precipitate shows a darker contrast than the surrounding BNFO. The bright contrast of the atomic columns of the cations in Figure (a) is reversed in the corresponding ABF-STEM image in Figure (b). The BNFO matrix reveals distinct differences in intensity and size of the A- and B-site cations, but the precipitate generally shows identical contrast for all the cation columns. The uniform contrast is consistent with the above analysis of the precipitate having primarily an iron-oxide composition. The red dash-lines across the BNFO matrix and precipitate reveal the precipitate has a rhombic lattice (∼4° deviation from right angle) and the central cation approaches another cation to form a dumbbell structure. Atomic resolution images of the precipitate are readily interpreted as the [241] zone-axis projection of rhombohedral α-Fe2O3. Figure (c) shows a polyhedral model of the α-Fe2O3 unit cell viewed along the [241] zone-axis, illustrating the neighboring FeO6 octahedra with face and edge sharing, resulting in the Fe cations approaching each other in the [241] projection, as shown in Figure (d).
Figure 3. (Colour online) (a) Atomic-resolved HAADF-STEM and (b) corresponding ABF-STEM plan-view images showing the coherent growth of α-Fe2O3 and BNFO matrix. The red dash-lines are added as a guide to the eye to identify the change of the lattices across the BNFO matrix and precipitate. (c) The polyhedral model showing face and edge-sharing FeO6 octahedra of a α-Fe2O3 unit cell viewed along [241] zone-axis and (d) the corresponding projection of the unit cell. Oxygen anions are omitted and only Fe cations are shown for the sake of clarity. The black dash lines illustrate the dumbbell structure of the Fe–Fe cations in neighboring FeO6 octahedra.
![Figure 3. (Colour online) (a) Atomic-resolved HAADF-STEM and (b) corresponding ABF-STEM plan-view images showing the coherent growth of α-Fe2O3 and BNFO matrix. The red dash-lines are added as a guide to the eye to identify the change of the lattices across the BNFO matrix and precipitate. (c) The polyhedral model showing face and edge-sharing FeO6 octahedra of a α-Fe2O3 unit cell viewed along [241] zone-axis and (d) the corresponding projection of the unit cell. Oxygen anions are omitted and only Fe cations are shown for the sake of clarity. The black dash lines illustrate the dumbbell structure of the Fe–Fe cations in neighboring FeO6 octahedra.](/cms/asset/77fcfee6-6491-491a-8d01-cde0aed59755/tmrl_a_1160260_f0003_c.jpg)
Atomic resolution HAADF-STEM imaging was used to study the mechanism of epitaxial growth at the α-Fe2O3/BNFO interface. Figure shows an enlarged HAADF-STEM image in the lower right portion of Figure (a). A structural model of the projection of the Fe cations of a α-Fe2O3 unit cell viewed along the [241] zone-axis is overlaid on the image for comparison. The structural model matches well with the experimental image. Yellow dash-dot-dot lines are added as a guide to the eye to illustrate the interface. A transition zone (blue dashed lines) at the interface region between the BNFO matrix and α-Fe2O3 precipitate is observed, ∼2 unit-cells wide, with a perovskite structure in which the intensity of the A-site columns is substantially reduced, suggesting Bi-deficiency. In a previous study, a Fe2O3-rich perovskite phase within BNFO films was reported which exhibits a high concentration of Fe3+-ions on the A-site.[Citation16] It is therefore reasonable to speculate that the BNFO perovskite/α-Fe2O3 transition zone is composed of the newly discovered Fe2O3-rich perovskite phase which in turn is responsible for epitaxial growth of the Fe2O3 dendrites, due to the similar crystal chemistry of Fe2O3-rich perovskite phase and α-Fe2O3.[Citation20] It should be noted that there are additional atomic columns superposed on the perovskite lattice in the Fe2O3-rich transition zone in a local area, as illustrated by the arrows in Figure . The positions of these additional atomic columns are similar to Nd-rich nanoprecipitates recently observed by atomic resolution EELS spectrum-imaging analysis in Nd- and Ti-codoped BiFeO3 films and ceramics.[Citation21–23] The presence of some Nd-rich nanoprecipitates in the transition zone suggests that Nd was exsolved from the matrix and precipitated heterogeneously during the PLD process.
Figure 4. Enlarged HAADF-STEM image of the lower right section of Figure (a) showing the atomic structure of the interface of α-Fe2O3 and the BNFO matrix. A structural model of the projection of a α-Fe2O3 unit cell viewed along [241] zone-axis is overlaid on the image for comparison. Only Fe cations are shown since oxygen anions are invisible in the HAADF image due to their weak scattering power. Yellow dash-dot-dot lines are added as a guide to the eye. Blue dash-dot-dot lines illustrate a transition zone with Bi-deficiency. Red arrows show additional atomic columns from a Nd-rich precipitate.
![Figure 4. Enlarged HAADF-STEM image of the lower right section of Figure 3(a) showing the atomic structure of the interface of α-Fe2O3 and the BNFO matrix. A structural model of the projection of a α-Fe2O3 unit cell viewed along [241] zone-axis is overlaid on the image for comparison. Only Fe cations are shown since oxygen anions are invisible in the HAADF image due to their weak scattering power. Yellow dash-dot-dot lines are added as a guide to the eye. Blue dash-dot-dot lines illustrate a transition zone with Bi-deficiency. Red arrows show additional atomic columns from a Nd-rich precipitate.](/cms/asset/2a834132-208a-45c1-bbc4-d10fc9f279f4/tmrl_a_1160260_f0004_c.jpg)
It should be noted that γ-Fe2O3 precipitate is favored to be formed in the BiFeO3 films grown by PLD at low oxygen partial pressure, for example below 5 mTorr.[Citation13–15] Recently, maghemite-like regions (γ-Fe2O3) were also evidenced at crossing of two antiphase boundaries in (Bi0.85Nd0.15)(Fe0.9Ti0.1)O3 ceramics synthesized in air.[Citation24] Although α-Fe2O3 is the favored precipitate with the oxygen partial pressure used in this work (40 mTorr) which is much higher than those for γ-Fe2O3 formation in the growth of BiFeO3 films, whether there is the presence of γ-Fe2O3 precipitate in this Nd- and Ti-codoped BiFeO3 film is still not clear.
In summary, coherent α-Fe2O3 forms at the surface of epitaxial films of Ti- and Nd-codoped BiFeO3 grown by PLD. A Fe2O3-rich perovskite-structured transition zone of ∼2 unit-cells wide at the BNFO/α-Fe2O3 interface promotes epitaxial growth of the α-Fe2O3 rather than the incoherent Fe2O3 particulate second phase. The new structure may exist in many BiFeO3-based single-phase films reported before, and may in part, explain the ferromagnetic response observed at room temperature.
Acknowledgements
H.Z., W.M.R. and I.M.R. acknowledge the Engineering and Physical Sciences Research Council for funding this work via grant EP/I038934/1. D.M.M. and S.T.M. acknowledge the financial support from National Science Foundation Grant 1005771, as well as a National Security Science and Engineering Faculty Fellowship. The authors thank the Kroto Centre for High Resolution Imaging & and Analysis for access the JEM-Z3100F-R005 STEM/TEM.
Disclosure statement
No potential conflict of interest was reported by the authors.
ORCID
Huairuo Zhang http://orcid.org/0000-0002-1984-1200
References
- Catalan G, Scott JF. Physics and applications of bismuth ferrite. Adv Mater. 2009;21:2463–2485.
- Blaauw C, van der Woude F. Magnetic and structural properties of BiFeO3. J Phys C: Sol Stat Phys. 1973; 6:1422–1431.
- Masó N, West AR. Electrical properties of Ca-doped BiFeO3 ceramics: from p-type semiconduction to oxide-ion conduction. Chem Mater. 2012;24:2127–2132.
- Jun YK, Moon WT, Chang CM, et al. Effects of Nb-doping on electric and magnetic properties in multi-ferroic BiFeO3 ceramics. Sol Stat Comm. 2005;135:133–137.
- Cheng CJ, Kan D, Lim SH, et al. Structural transitions and complex domain structures across a ferroelectric-to-anti-ferroelectric phase boundary in epitaxial Sm-doped BiFeO3 Thin Films. Phys Rev B. 2009;80:014109.
- Kan D, Palova L, Anbusathaiah V, et al. Universal behavior and electric field-induced structural transition in rare-earth substituted BiFeO3. Adv Funct Mater. 2010;20:1108–1115.
- Kalantari K, Sterianou I, Karimi S, et al. Ti-doping to reduce conductivity in Bi0.85Nd0.15FeO3 ceramics. Adv Funct Mater. 2011;21:3737–3743.
- Karimi S, Reaney IM, Han Y, Pokorny J, Sterianou I. Crystal chemistry and domain structure of rare-earth doped BiFeO3 ceramics. J Mater Sci. 2009;44:5102–5112.
- Kalantari K, Sterianou I, Sinclair DC, et al. Structural phase transitions in Ti-doped Bi1−xNdxFeO3 ceramics. J Appl Phys. 2012;111:064107.
- Yun KY, Ricinschi D, Noda M, Okuyama M, Nasu S. Ferroelectric and magnetic properties of multiferroic BiFeO3 thin films prepared by pulsed laser deposition. J Kor Phys Soc. 2005;46:281–284.
- Ramesh R, Spaldin NA. Multiferroics: progress and prospects in thin films. Nat Mater. 2007;6:21–29.
- Jahns R, Piorra A, Lage E, et al. Giant magnetoelectric effect in thin-film composites. J Am Ceram Soc. 2013;96:1673–1681.
- Bea H, Bibes M, Barthelemy A, et al. Influence of parasitic phases on the properties of BiFeO3 epitaxial thin films. Appl Phys Lett. 2005;87:072508.
- Murakami M, Fujino S, Lim SH, et al. Microstructure and phase control in Bi-Fe-O multiferroic nanocomposite thin films. Appl Phys Lett. 2006;88:112505.
- Lim SH, Murakami M, Sarney WL, et al. The effect of multiphase formation on strain relaxation and magnetization in multiferroic BiFeO3 thin films. Adv Fuct Mater. 2007;17:2594–2599.
- Zhang H, Reaney IM, Marincel DM, et al. Stabilisation of Fe2O3-rich perovskite nanophase in epitaxial rare-earth doped BiFeO3 films. Sci Rep. 2015;5:13066.
- Ahn CC, Krivanek OL. EELS Atlas: a reference collection of electron energy loss spectra covering all stable elements. Warrendale (PA): ASU HREM Facility & Gatan Inc.; 1983.
- Colliex C, Manoubi T, Ortiz C. Electron-energy-loss-spectroscopy near-edge fine structures in the iron-oxygen system. Phys Rev B. 1991;44:11402–11411.
- Paterson JH, Krivanek OL. ELNES of 3d transition-metal oxides II. Variations with oxidation state and crystal structure. Ultramicroscopy. 1990;32:319–325.
- Dubrovinsky L, Boffa-Ballaran T, Glazyrin K, et al. Single-crystal X-ray diffraction at megabar pressures and temperatures of thousands of degrees. High Press Res. 2010;30:620–633.
- Zhang H, Kalantari K, Marincel DM, et al. Phase assemblage and polarisation-field switching in Nd-doped BiFeO3 thin films; to be submitted.
- MacLaren I, Wang LQ, Schaffer B, et al. Novel nanorod precipitate formation in neodymium and titanium codoped bismuthferrite. Adv Funct Mater. 2013;23:683–689.
- Reaney IM, MacLaren I, Wang L, et al. Defect chemistry of Ti-doped antiferroelectric Bi0.85Nd0.15FeO3. Appl Phys Lett. 2012;100:182902.
- Salih JM, Wang L, Ramasse QM, et al. Maghemite-like regions at crosssing of two antiphase boundaries in doped BiFeO3. Mater Sci Tech. http://dx.doi.org/10.1179/1743284715Y.0000000115.