
ABSTRACT
We develop a new method using binary collision approximation simulating the Rutherford backscattering spectrometry in channeling conditions (RBS/C) from molecular dynamics atom coordinates of irradiated cells. The approach allows comparing experimental and simulated RBS/C signals as a function of depth without fitting parameters. The simulated RBS/C spectra of irradiated Ni and concentrated solid solution alloys (CSAs, NiFe and NiCoCr) show a good agreement with the experimental results. The good agreement indicates the damage evolution under damage overlap conditions in Ni and CSAs at room temperature is dominated by defect recombination and migration induced by irradiation rather than activated thermally.
GRAPHICAL ABSTRACT
IMPACT STATEMENT
A new method simulating the Rutherford backscattering Spectrometry in channeling conditions (RBS/C) was proposed.
The RBS/C simulations reveal that the radiation damage buildup in Ni, NiFe and NiCoCr was dominated by athermal defect reactions.
In recent years, strong attention has been paid to a new class of materials known as high entropy alloys [Citation1–3] and concentrated solid solution alloys (CSAs) [Citation4,Citation5]. Enhanced mechanical strength [Citation1,Citation3,Citation6,Citation7], thermal stability [Citation8–10], excellent corrosion and wear resistance [Citation3] make these materials very attractive for many demanding applications. Different from traditional alloys, consisting of one principal element and other elements being alloyed at much lower concentrations, the CSAs contain roughly equal atomic concentrations of multiple elements in a simple single crystalline phase. Recently, these alloys were proposed as potential candidates [Citation11] for the next-generation nuclear power plant components due to not only good mechanical properties [Citation1,Citation3], but also stronger resistance to radiation damage [Citation4,Citation11,Citation12]. Being exposed to neutron irradiation for a prolonged period of time, nuclear materials are expected to tolerate relatively high concentrations of radiation defects. The mechanisms of how radiation damage builds up in CSAs are of a great interest for nuclear material scientists.
Investigation of localized structural modifications in crystals is frequently done by using Rutherford backscattering spectrometry in channeling directions (RBS/C). This is a powerful tool to analyze the structural defects in few-micrometer surface layers [Citation13]. In past decades, the RBS/C technique has proven to be extremely valuable for studying radiation damage in crystalline materials induced by ion irradiation [Citation14–17]. Interpretation of experimental RBS/C spectra is not, however, straightforward, and understanding of atomic structures underlying the RBS/C signals is still a challenge. After many researchers' endeavor, various methods, such as iterative procedures [Citation13,Citation18–20], improved iterative procedures [Citation21], Monte Carlo simulations [Citation22–24], and other methods [Citation25], were developed to extract the depth profiles of radiation damage from experimental RBS/C spectra. Most of these methods utilize fitting techniques, which use the RBS/C spectra to adjust the amount of pre-assumed defects induced by ion irradiation and distributed in reasonable depth profiles. However, none of these methods are able to provide a detailed insight of the actual damage. This can be achieved via simulations of RBS/C spectra directly from an atomic structure, which can be obtained in independent simulations of radiation damage buildup [Citation26]. Comparison of the simulated and experimental RBS/C spectra from the samples irradiated to similar conditions in simulation and experiment can reveal the detailed information not only on atomic structures of the damage, but also on the mechanisms of how this damage builds up. This can enable an accurate analysis of enhanced properties of new materials and their reliable performance in extreme environment.
The experimental RBS/C spectra [Citation11,Citation12] of pure Ni and the CSAs, such as NiFe and NiCoCr, which retain completely random atomic arrangement in a well-defined face-centered cubic (FCC) crystal structure [Citation27] similar to Ni, showed that the CSAs have stronger resistance to radiation damage induced by 1.5 MeV Ni than pure Ni. However, the atomistic structure of the damage produced in these materials was studied in [Citation11] only qualitatively, since the RBS/C spectra cannot reveal details of defect structures.
In this Letter, by means of the RBSADEC code [Citation26], we develop a formalism to simulate, without any fitting to experiments, the RBS/C spectra from atomistic models of the same materials (Ni, NiFe and NiCoCr), irradiated in identical conditions as in experiments [Citation11]. The RBSADEC code is fitting parameter free and is based on the combination of molecular dynamics (MD) simulations and binary collision approximation (BCA) algorithms. More detail of the code can be found in [Citation26]. In our approach, we form a depth-dependent atomistic damage model corresponding to the experimental nuclear deposited energy profile. Comparing our spectra to the experimental ones from [Citation11], we observe very good agreement, which allows for detailed analysis of the atomic structure of defects contributing to the RBS/C spectra. Our simulation method can be extended to any crystal structure, which makes it versatile for analyzing defect structures in materials as a function of depth.
Due to limitations of computer capacity, the size of MD simulation cells ( nm), is much smaller than the size of a sample in RBS/C measurements or even ion-irradiated depth, which for a few MeV ions can reach a micrometer depth. The nuclear energy deposition is the process of energy transfer from the incident ion to the atoms in cascades during the slowing down of ions in the material. The collisions within atomic cascades displace the atoms from their lattice sites, producing point and extended defects in the structures. The nuclear energy deposition distributions are not uniform along the depth but follow roughly a peak shape with the maximum at the depth, where the density of cascades is the highest. All this must be taken into account in the process of preparation of the simulation cell to obtain realistic RBS/C spectra, which can be compared directly to the experimental ones.
We prepared the simulation cells for our RBS/C simulations according to the following new procedure. At first we estimated the depth distribution of nuclear energy deposited by the 1.5 MeV Ni ions with the fluence
cm−2 in Ni. Since the atomic masses of different components in the studied CSAs are very close to Ni, the same nuclear energy deposition depth profile can be used for all three materials. The calculation was carried out with the MDRANGE code [Citation28–35], which takes the multi-body interaction between ions and atoms into account to simulate the slowing down of energetic ions inside materials.
After that, we performed MD simulations of radiation damage buildup in the crystals following the procedure described in [Citation11]. The MD simulations were performed by using the classical MD code PARCAS [Citation36]. The interactions between atoms of different type were described by the interatomic potential by Zhou et al. [Citation37] and Lin et al. [Citation38]. We simulated multiple subsequent overlapping cascades at 300 K in the structures of the unit cells until a required irradiation dose, or energy deposited per atom via atomic collisions, was accumulated. Each consecutive cascade was initiated in the same simulation cell by a 5 keV recoil randomly selected amongst the atoms of the cell [Citation11]. The energy of 5 keV was chosen since at this energy the cascades are clearly in the heat spike regime, while the number of atoms needed to simulate it is small enough that cascade simulations are efficient enough to reach the high doses comparable to experiments. To obtain a more direct comparison with the experimental situation, a recoil energy spectrum corresponding to the ion irradiation energy of 1.5 MeV could be used in the MD simulations; however, the computational cost would be very high. Since the nuclear energy deposition depth profiles are not uniform, the same ion fluence, the number of ions arriving per surface area, will result in different irradiation doses at different depths. To mimic an extended sample measured experimentally, we merged the MD simulation cells in such an order that the doses to what the given cell was irradiated corresponded to the energy deposited at the respective depth.
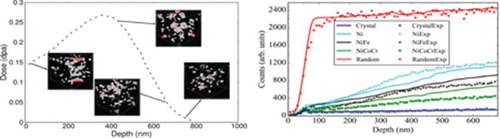
We also note that frequently accumulated irradiation dose is expressed in so-called displacements-per-atom (dpa) units. For consistency, we transformed the depth profiles of the deposited nuclear energies into dpa (dashed line in Figure ), according to the NRT equation [Citation39]. Although this equation does not give an experimentally meaningful number of defects in metals, it is a convenient way of expressing the nuclear deposited energy density [Citation40]. In this calculation, 40 eV was assumed as the threshold transferred energy which was sufficient to create a stable defect. As shown in Figure , the peak dose is about 0.25 dpa at a depth of
nm, which was the maximal irradiation dose used for all studied structures. This dose was accumulated after about 800 consecutive cascades.
Figure 1. The nuclear energy deposition depth profile in Ni by 1.5 MeV Ni ions with the fluence
cm−2. The insets of the damaged structures in Ni at different doses illustrate the MD cells used to create a large BCA-RBS cell (see text). The red and blue balls in the insets are the atoms in hexagonal close-packed (HCP) structures and body-centered cubic (BCC) structures, respectively. The white balls in the insets denote the atoms in neither FCC nor BCC and HCP structures.
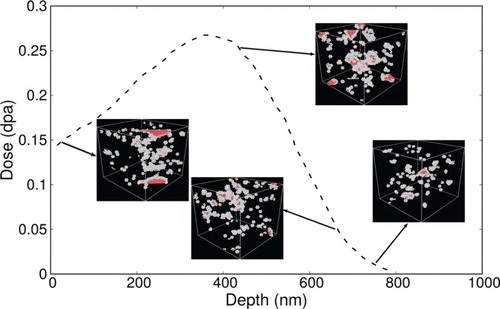
To illustrate the dose accumulation, exemplary snapshots of defect structures corresponding to different irradiation doses (, 0.25, 0.05 and 0.01 dpa) in Ni are shown in the insets of Figure and the defect structures at the final dose of 0.25 dpa in NiFe and NiCoCr are shown in Figure . In the three different samples investigated, we observe different evolution of defect structures in our MD simulations [Citation11,Citation42,Citation43]. At the beginning of the irradiation, point defects and small clusters are created and the amount of defects is linearly increasing [Citation11,Citation42]. The linear increase stops at about 0.01 dpa in the alloys and about 0.02 dpa in Ni. Saturation of defect amount is observed in the alloys at about 0.05 dpa, whereas in Ni, saturation is reached at 0.15 dpa, i.e. a much higher dose [Citation11,Citation42]. There is also a clear difference in the saturation level for the point defect amount: the damage in NiFe and NiCoCr saturates at lower level than in pure Ni [Citation11]. In addition, we distinguish different defect and dislocation structure [Citation43]. In pure Ni a large amount of stacking fault tetrahedra (SFT) are formed accompanied by large Frank loops, as seen in Figure (a). In contrast to pure Ni, the alloys show only small amounts of SFT and practically no Frank loops. Instead, the simulations in alloys show large amounts of small Shockley partial dislocation loops and Shockley partial dislocation networks (see Figure (b, c)).
Figure 2. Final snapshots of the MD simulation cells of NiFe and NiCoCr after
overlapping cascades to accumulate the dose of 0.25 dpa. The atoms shown in the cells are only the defective atoms according to common neighbor analysis [Citation41]. The color was assigned by the structure type. The red balls denote atoms in BCC or HCP structures, while the blue color balls denote the atoms which are in neither FCC nor BCC and HCP structures.
![Figure 2. Final snapshots of the MD simulation cells of NiFe and NiCoCr after overlapping cascades to accumulate the dose of 0.25 dpa. The atoms shown in the cells are only the defective atoms according to common neighbor analysis [Citation41]. The color was assigned by the structure type. The red balls denote atoms in BCC or HCP structures, while the blue color balls denote the atoms which are in neither FCC nor BCC and HCP structures.](/cms/asset/4304beeb-1c6d-4abd-a599-7a9f2bf373e7/tmrl_a_1311284_f0002_c.jpg)
Figure 3. The dislocation structure at the peak dose of 0.25 dpa in Ni (a), NiFe (b) and NiCoCr (c). The different colored lines correspond to different Burgers vectors. The cyan line represents a Frank-, the purple line a Stair-rod-, the yellow a Hirth- and the green a Shockley-dislocation. The blue volumes are defective areas according to the DXA analysis [Citation41].
![Figure 3. The dislocation structure at the peak dose of 0.25 dpa in Ni (a), NiFe (b) and NiCoCr (c). The different colored lines correspond to different Burgers vectors. The cyan line represents a Frank-, the purple line a Stair-rod-, the yellow a Hirth- and the green a Shockley-dislocation. The blue volumes are defective areas according to the DXA analysis [Citation41].](/cms/asset/4d65ba87-385a-40a7-8c86-1ac410242915/tmrl_a_1311284_f0003_c.jpg)
Previously, the study of irradiation-induced defects in Ni by using high resolution transmission electron microscopy (HRTEM) [Citation44] also showed the co-existence of SFT and interstitial dislocation loops. The comparison of the TEM images and our MD simulation results showed that the number of large () defect clusters are larger in Ni than that in the alloys [Citation11]. The overall good agreements in defect structures obtained in our simulations and in experiments give us confidence that the current set of MD simulations can describe the irradiation damage reasonably well.
By merging MD cells, the simulation size of the structure can be easily extended to the experimental dimensions and in our case, the final cell, which we used for the RBS/C spectra simulations, was unit cells, with the largest dimension aligned with the depth of the structure. To distinguish between two sizes of the cells in the remainder of this letter, we will refer to the large cells as the BCA-RBS cells and the small ones, where the cascades were actually performed, as MD cells. The number of BCA-RBS cells for each material was three matching the number of three parallel MD runs with different initial seed numbers. It is worth mentioning that while merging the MD cells with damaged structures, obtained with the periodic boundary conditions applied in all directions, the periodic boundary conditions in the depth direction of the MD cells could not be used anymore. This may cause artificial interfacial structures between two neighboring cells. However, the merging can still be used to build the BCA-RBS cell, if the crystallographic axes of two neighboring MD cells coincide, since the RBS/C spectra is only affected by the defects in the samples. Thus, we first find out the locations of crystallographic axes in the MD cells by analyzing the coordinates of the atoms in the cells, and then match the crystallographic axes of two neighboring cells through shifting the cells under the periodic boundary conditions.
After building the BCA-RBS cells, we applied the RBSADEC code to simulate the RBS/C spectra from the BCA-RBS cells. The parameters used in the RBS/C simulations are the same as the experiments performed in [Citation11]. The probe ions (α-particles) were incident along to the orientation of the crystal, the energy of the probe ions are 3.5 MeV and the backscattering angle is 155
. In the present RBS/C simulations, the incident angle of probe ions was allowed to have an uncertainty of 0.1
to emulate the various uncertainties in the experiment, e.g. angular spread of probe ions, relaxation and reconstruction of surface structures.
The number of point defects, vacancies and interstitials, in the MD cells was analyzed by using a Wigner–Seitz method [Citation36]. Figure shows the depth distribution of the number of the defects in the BCA-RBS, by analyzing this number in every corresponding constituent MD cell. The shown defect numbers are the averages of the three parallel simulations of each material and the depth profile of the averaged defect number in the BCA-RBS cells of Ni, NiFe and NiCoCr presented in the red circles, green triangles and blue stars, respectively.
Figure 4. Depth profiles of point defects in the BCA-RBS simulation cells, which were obtained by merging corresponding MD cells. The number of defects is extracted from the Wigner–Seitz analysis in every MD cell, and averaged over three parallel simulations.

These defect number depth profiles obtained by MD methods (Figure ), unfortunately, are not comparable directly to the experimental RBS/C results. The MD simulations give exact amount of point defects, whereas the experimental RBS/C spectra also depends on the type of defects. For instance, we recently showed that the RBS yield generated by extended defects is much larger than that of single Frenkel pairs (interstitial and vacancy) [Citation26]. This is why it is very important to compare the RBS/C spectra obtained in simulation and experiment, to enable the link of the MD irradiation results to the experimental ones.
In Figure we show both the experimental and simulated RBS/C spectra of the all three irradiated materials, Ni, NiFe and NiCoCr. We use the markers to show the experimental results from [Citation11], and the lines to show the present results of the simulated RBS/C spectra by RBSADEC. The reference levels of pristine crystalline (blue color, line and diamonds) and completely random (red color, line and circles) structures are also shown. Other colors, cyan (line and triangles), black (line and stars) and green (line and squares), show the RBS/C spectra of the samples, Ni, NiFe an NiCoCr, respectively, irradiated with the same Ni ion fluence.
Figure 5. Comparison of simulated RBS/C spectra shown in solid lines and experimental results shown in markers. The simulated spectra from the all studied materials are the averages over three parallel simulations.
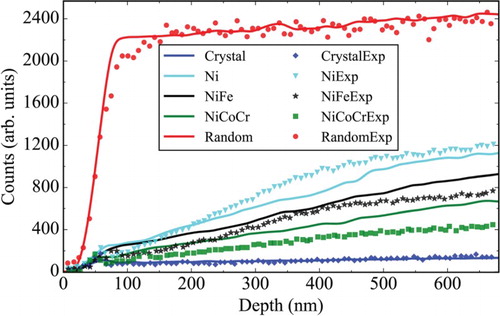
As seen in Figure , the simulated RBS/C spectra are in a good agreement with the experimental ones, considering that no fitting was used for these results and both are obtained fully independently. With increasing of complexity of the system (from one- to three-component alloys) the RBS/C signals obtained in simulation and experiment from deeper layers of the samples behave somewhat differently. There are several possible factors that may influence this result. First of all, the statistical uncertainty may not be captured by only three simulation runs especially for complex alloys, secondly the size of the MD simulation cell and the use of a single recoil energy (5 keV) may have affected the diversity of defect types which can form in the much larger experimental samples. Moreover, the simplified potential used in the current study may not be sufficient to describe accurately the defect formation energetics. Finally, it is of course possible that thermally enhanced defect migration (which practically does not occur on MD time scales) could change the defect types in the experiments. However, we underline the very good agreement between the simulated and the experimental spectra in the following two important aspects: (I) the shapes of the simulated spectra are very similar to those obtained experimentally; (II) consistently with experiments, the simulated results show that the RBS/C yield for the irradiated Ni is larger than that for NiFe, which is, in its turn, is larger than in NiCoCr; (III) Even though thermally enhanced defect migration is likely to change the defect shapes in experiments, the good agreement obtained here between simulations (with no long-term migration of defects) and experiments shows that possible defect migration does not lead to massive recombination or reorganization of damage, at least under the conditions of the current experiments.
Analyzing the data presented in Figure , we see that the depth profiles of Wigner–Seitz defects in all three irradiated structures are fairly similar, only a small reduction in this number is observed in the CSAs compared to the pure Ni. The simulated RBS/C yields indicate that the CSA samples are indeed clearly less damaged compared to the pure metal (see Figure ). It is also consistent with the analysis of the size distribution of defect clusters in the MD cells, given in [Citation11], which showed that the fraction of large defect clusters in Ni is clearly larger than that in NiFe and NiCoCr. Thus, we conclude that the reason for the highest RBS/C yields of irradiated Ni, observed consistently in experiment and simulations, is that large defect clusters agglomerated in Ni much faster than in other studied materials.
The shapes of RBS/C spectra are mainly determined by the depth profiles of the irradiation damage in the materials. It was reported that, under a high irradiation fluence, the damage depth in metal can reach far beyond the range of incident ions [Citation44] due to dislocation movements [Citation45]. In the current simulations, we did not take into account these long-term migration processes, which may lead to changes in defect concentration and hence affect RBS/C spectrum shapes. However, the good shape agreement of the RBS/C spectra obtained in our simulations and experiments indicates that the long-term migration processes are not significant in the condition of the experiments reported in [Citation11].
It is important to note that the experimental time scale of irradiation process is much longer than in MD simulations. All our MD simulations of overlapping cascades were performed with the frequency of 1 cascade per 30 ps, since our previous tests indicated that within 30 ps the ballistic phase of the cascades was over and the temperature was restored back to the room temperature due to the heat conduction of materials. Such a short time per one cascade in simulations (compared to microseconds to seconds between the cascades in experiments) is motivated by computational efficiency. However, during the long time in experiments, the defects created in the ballistic phase of the cascade have more possibilities to recombine or anneal due to thermal action, which may be reflected in the RBS/C spectra as well. The good agreement between simulated and experimental spectra suggests that the thermal annealing processes do not develop strongly in the studied materials to play an important role in the radiation damage buildup at room temperature. Instead, the dominant process for damage evolution is the athermal, irradiation-induced overlap of cascades with pre-existing damage, which builds up extended defects but also recombines previous damage until a steady-state damage level is reached.
To summarize, in the Letter we present a parameter-free method, which combines MD and BCA together, to simulate the RBS/C spectra. The direct comparison of the simulated and experimental RBS/C spectra provides a new way to quantitatively analyze the atomic structure of defects, complementing other microscopy techniques. We obtained a good agreement between our simulated RBS/C spectra and experiment presented in [Citation11] for pure Ni and two CSAs with two and three components, NiFe and NiCoCr. The agreement allows to derive a conclusion on the nature of the defects and the mechanisms of their buildup by analyzing in detail the atomistic models used for the simulated spectra. We concluded that athermal defect creation and recombination in collision cascades dominates the damage buildup. Ni is more susceptible to the radiation damage compared to the alloys and this behavior can be explained by the formation of large defect clusters, which result in stronger RBS/C signals compared to those produced by point defects. The thermal diffusion processes, including thermally activated recombination and annealing that may take place during the long time between the cascades in the experiments, do not affect the damage buildup in the studied materials as strongly as the athermal cascade overlap.
Acknowledgements
Grants of computer time from the Center for Scientific Computing in Espoo, Finland, are gratefully acknowledged.
Disclosure statement
No potential conflict of interest was reported by the authors.
Additional information
Funding
References
- Zhang Y, Zuo TT, Tang Z, et al. Microstructures and properties of high-entropy alloys. Prog Mater Sci. 2014;61(8):1–93.
- Ye YF, Wang Q, Lu J, et al. High-entropy alloy: challenges and prospects. Mater Today. 2015;19:349–362.
- Tsai M-H, Yeh J-W. High-entropy alloys: A critical review. Mater Res Lett. 2014;2(3):107–123.
- Zhang Y, Stocks GM, Jin K, et al. Influence of chemical disorder on energy dissipation and defect evolution in concentrated solid solution alloys. Nat Commun. 2015;68736.
- Jin K, Bei H, Zhang Y. Ion irradiation induced defect evolution in ni and ni-based {FCC} equiatomic binary alloys. J Nucl Mater. 2016;471:193–199.
- Gludovatz B, Hohenwarter A, Catoor D, et al. A fracture-resistant high-entropy alloy for cryogenic applications. Science. 2014;345(6201):1153–1158.
- Jin K, Sales BC, Stocks GM, et al. Tailoring the physical properties of Ni-based single-phase equiatomic alloys by modifying the chemical complexity. Sci Rep. 2016;620159.
- Wu Z, Bei H, Pharr G, et al. Temperature dependence of the mechanical properties of equiatomic solid solution alloys with face-centered cubic crystal structures. Acta Mater. 2014;81:428–441.
- Senkov ON, Wilks GB, Scott JM, et al. Mechanical properties of nb 25 mo 25 ta 25 w 25 and v 20 nb 20 mo 20 ta 20 w 20 refractory high entropy alloys. Intermetallics. 2011;19(5):698–706.
- Otto F, Yang Y, Bei H, et al. Relative effects of enthalpy and entropy on the phase stability of equiatomic high-entropy alloys. Acta Mater. 2013;61(7):2628–2638.
- Granberg F, Nordlund K, Ullah MW, et al. Mechanism of radiation damage reduction in equiatomic multicomponent single phase alloys. Phys Rev Lett. 2016;116:135504.
- Zhang Y, Zhao S, Weber WJ, et al. Atomic-level heterogeneity and defect dynamics in concentrated solid-solution alloys. Curr Opin Solid State Mater Sci. 2017; Accepted. DOI: 10.1016/j.cossms.2017.02.002.
- Feldman LC, Mayer JW, Picraux ST. Materials analysis by ion channeling: Submicron crystallography. New York: Academic Press; 1982.
- Zhang Y, Ishimaru M, Jagielski J, et al. Damage and microstructure evolution in gan under au ion irradiation. J Phys D: Appl Phys. 2010;43(8):085303.
- Lulli G, Bianconi M, Parisini A, et al. Damage profiles in high-energy as implanted si. J Appl Phys. 2000;88(7):3993–3999.
- Zhang LM, Fadanelli RC, Hu P, et al. Structural damage in ingan induced by mev heavy ion irradiation. Nucl Instr Meth Phys Res B. 2015;356–357:53–56.
- Albertazzi E, Bianconi M, Lulli G, et al. Different methods for the determination of damage profiles in si from rbs-channeling spectra: a comparison. Nucl Instr Methods Phys Res B. 1996;118(1–4):128–132.
- Zhang Y, Lian J, Zhu Z, et al. Response of strontium titanate to ion and electron irradiation. J Nucl Mater. 2009;389(2):303–310.
- Leavitt JA, McIntyre Jr LC, Weller MR. Backscattering spectrometry. Pittsburgh, PA: Materials Reseach Society; 1995.
- Williams JS, Elliman RG. Ion beams for materials analysis. Sydney: Academic Press; 1989.
- Shao L, Nastasi M. Methods for the accurate analysis of channeling rutherford backscattering spectrometry. Appl Phys Lett. 2005;87(6):064103.
- Barrett JH. Monte carlo channeling calculations. Phys Rev B. 1971;3:1527–1547.
- Smulders PJM, Boerma DO. Computer simulation of channeling in single crystals. Nucl Instr Meth Phys Res. 1987;29:471–489.
- Nowicki L, Turos A, Ratajczak R, et al. Modern analysis of ion channeling data by monte carlo simulations. Nucl Instr Meth Phys Res B. 2005;240(1–2):277–282.
- Gärtner K. Axial dechanneling in compound crystals with point defects and defect analysis by {RBS}. Nucl Instr Meth Phys Res B. 1997;132(1):147–158.
- Zhang S, Nordlund K, Djurabekova F, et al. Simulation of rutherford backscattering spectrometry from arbitrary atom structures. Phys Rev E. 2016;94:043319.
- Wu Z, Gao YF, Bei H. Single crystal plastic behavior of a single-phase, face-center-cubic-structured, equiatomic fenicrco alloy. Scr Mater. 2015;109:108–112.
- Nordlund K. Molecular dynamics simulation of ion ranges in the 1–100 kev energy range. Comput Mater Sci. 1995;3:448–456.
- Nordlund K, Keinonen J, Rauhala E, et al. Range profiles in self-ion-implanted crystalline Si. Phys Rev B. 1995;52:15170–15175.
- Haussalo P, Nordlund K, Keinonen J. Stopping of 5–100 kev helium in tantalum, niobium, tungsten, and AISI 316l steel. Nucl Instr Methods Phys Res B. 1996;111(1/2):1–6.
- Sillanpää J, Nordlund K, Keinonen J. Electronic stopping of Si from a three-dimensional charge distribution. Phys Rev B. 2000;62:3109–3116.
- Sillanpää J, Peltola J, Nordlund K, et al. Electronic stopping calculated using explicit phase shift factors. Phys Rev B. 2000;63:134113.
- Sillanpää J. Electronic stopping of silicon from a 3d charge distribution. Nucl Instr Methods Phys Res B. 2000;164:302–309.
- Peltola J, Nordlund K, Keinonen J. Explicit phase shift factor stopping model for multi-component targets. Nucl Instr Meth Phys Res B. 2003;212:118–122.
- Chan HY, Nordlund K, Peltola J, et al. Low energy ion implantation in crystalline silicon: application of binary collision approximation and molecular dynamics. Nucl Instr Meth Phys Res B. 2005;228:240–244.
- Nordlund K, Ghaly M, Averback RS, et al. Defect production in collision cascades in elemental semiconductors and fcc metals. Phys Rev B. 1998;57(13):7556–7570.
- Zhou XW, Johnson RA, Wadley HNG. Misfit-energy-increasing dislocations in vapor-deposited cofe/nife multilayers. Phys Rev B. 2004;69:144113.
- Lin Z, Johnson RA, Zhigilei LV. Computational study of the generation of crystal defects in a bcc metal target irradiated by short laser pulses. Phys Rev B. 2008;77(21):214108.
- Norgett MJ, Robinson MT, Torrens IM. A proposed method of calculating displacement dose rates. Nucl Engr Design. 1975;33(1):50–54.
- Nordlund K, Zinkle SJ, Suzudo T, et al. Primary radiation damage in materials: review of current understanding and proposed new standard displacement damage model to incorporate in-cascade mixing and defect production efficiency effects. Paris: OECD Nuclear Energy Agency; 2015.
- Stukowski A. Visualization and analysis of atomistic simulation data with ovito-the open visualization tool. Model Simul Mater Sci Eng. 2010;18(1):015012.
- Granberg F, Djurabekova F, Levo E, et al. Damage buildup and edge dislocation mobility in equiatomic multicomponent alloys. Nucl Instrum Methods Phys Res, Sect B. 2017;393:114–117. Computer Simulation of Radiation Effects in Solids Proceedings of the 13 {COSIRES} Loughborough, UK, 2016 June 19–24.
- Levo E, Granberg F, Fridlund C, et al. Radiation damage buildup and dislocation evolution in equiatomic multicomponent alloys. Submitted to Acta Mater. 2017.
- Lu C, Jin K, Béland LK, et al. Direct observation of defect range and evolution in ion-irradiated single crystalline Ni and Ni binary Alloys. Sci Rep 6. 2016;6:19994. DOI: 10.1038/srep19994
- Sharkeev YP, Kozlov EV. The long-range effect in ion implanted metallic materials: dislocation structures, properties, stresses, mechanisms. Surf Coat Technol. 2002;158–159:219–224. Proceedings of the 12th International Conference on {SMMIB}; 2001 Sep 9–14; Marburg, Germany.