
ABSTRACT
Magnetic ordering in the MAX phase (Cr0.96Mn0.04)2GeC is investigated by means of neutron powder diffraction (NPD). Upon cooling, the temperature dependence of the magnetization shows a two-step increase. The NPD refinement reveals that the first step, at 300 K, and the second step, at 38 K, originate from a collinear magnetic structure within the MAX phase and a spinel MnCr2O4 impurity phase, respectively. The former magnetic structure is oriented perpendicular to the c axis, with a net magnetic moment of ∼0.6(2) μB per Cr/Mn atom at 50 K. This is the first direct evidence for magnetic ordering within a bulk MAX phase.
GRAPHICAL ABSTRACT
IMPACT STATEMENT
Direct neutron diffraction evidence for magnetic ordering in a bulk (Cr0.96Mn0.04)2GeC polycrystalline MAX phase sample is presented for the first time.
1. Introduction
The Mn+1AXn (MAX) phases (n = 1, 2, 3), where M is an early transition metal (Ti, V, Cr, …), A an A-group element (Al, Ge) and X is either C and/or N, were discovered by Nowotny et al. [Citation1] in the 1960s and subsequently ignored for ≈20 years. Renewed interest was sparked by Barsoum et al. [Citation2] who showed that some of these phases exhibit some of the best characteristics of ceramics and metals [Citation3].
The MAX phase structure is comprised of near close-packed M-planes interleaved with pure A-layers (mostly group 13 and 14), with the C and or N-atoms occupying the octahedral sites between the M-layers. Given their naturally nanolaminated nature, they have spurred interest in whether some of them are magnetic [Citation4–6], with some recent success [Citation7–14].
The first experimental observations of macroscopic magnetic response (MMR) were made on epitaxial thin films in the solid solution (Cr0.75,Mn0.25)2GeC [Citation7]. Since then, MMR has been reported for other Cr- and/or Mn-based thin films, including (Cr1−x,Mnx)2AlC [Citation8], (Mo1−x,Mnx)2GaC [Citation13] and Mn2GaC [Citation9,Citation14], among others. Moreover, a recent neutron reflectometry study, performed under a field of 20 Oe, showed, on a microscopic scale, antiferromagnetic (AFM) ordering within an Mn2GaC thin film [Citation15]. For a recent review article on the subject, see Ingason et al. [Citation16].
The focus of this work is on bulk Cr-Mn-Ge-C samples. The first attempt to introduce Mn into Cr2GeC was motivated by ab initio calculations, suggesting a solubility limit of x = 0.25 in (Cr1−xMnx)2GeC [Citation7]. Additional calculations on (Cr0.75,Mn0.25)2GeC predicted the local magnetic moments on the Mn and Cr atoms to be ≈2 and 0.7 µB, respectively, with a tendency for the Cr moments to line up parallel to the Mn moments. The magnetic ground state was AFM, though the ferromagnetic (FM) state was quite close in energy. Interestingly, the ground state for the end member, Cr2GeC, was theoretically predicted to be AFM, with finite Cr local moments in the 0.6–0.9 µB range depending on the spin configuration [Citation17]. We note that this result does not contradict X-ray magnetic circular dichroism analysis of Cr2GeC thin films, which concluded the Cr net moment to be 0.02 µB [Citation18].
Previous investigations of magnetism in (Cr1−x,Mnx)2GeC revealed MMR [Citation10,Citation11]. Moreover, the value of the Curie temperature obtained, assuming that magnetic ordering takes place, increased with Mn-content. Currently there are two schools of thought on the nature of magnetism in these compounds. The Linköping group suggest overall AFM coupling, though observe a small FM component, which suggests competing magnetic interactions [Citation7]. In contrast, Liu et al. made the case for itinerant magnetism [Citation10]. However, all experimental results and conclusions in the field of magnetic bulk MAX phases were based on MMR alone, which was the impetus for this work. Herein neutron powder diffraction (NPD)—obtained, with no externally applied magnetic field, using two independent neutron instruments at several temperatures—is used to investigate possible magnetic ordering within a (Cr1−x,Mnx)2GeC powder sample. A third, high angular resolution neutron instrument, is used at room temperature (RT) alone, in order to improve the precision in the amount of Cr randomly replaced by Mn. The FM structure, found below 50 K, constitutes the first evidence, on a microscopic scale, for magnetic ordering within a bulk MAX phase.
2. Experimental details
A (Cr1−x,Mnx)2GeC powder was synthesized by solid-state reaction of elemental powders (99.9% purity). The details can be found elsewhere [Citation11]. In brief, elemental powders were mixed in an agate mortar, sealed in evacuated quartz tubes and heated to 1100°C for 48 h. The nominal chemistry was chosen to generate a compound with x = 0.1; the actual value, measured herein, is 0.04 (see Section 3).
The magnetization, M, and the susceptibility, χ, as a function of temperature, T, were obtained using a Quantum-Design type SQUID magnetometer and an alternating current (AC) susceptometer, respectively, operated under standard settings. A 80 mg solid sample was used and a T range of 5–375 K was covered. Two frequencies of alternating magnetic fields (293 and 1465 Hz) were used to obtain χ.
The high flux E6 neutron diffractometer, located at the Helmholtz–Zentrum Berlin (HZB, Germany), was used to obtain NPD profiles at 323.0(5), 50.0(5) and 1.5(3) K. An incident neutron wave-length, λ, of 2.43(1) Å was obtained using a focusing pyrolytic graphite monochromator. A 5 g (Cr1−xMnx)2GeC powder sample was loaded into a vanadium, V, cylindrical sample holder, with a 6 mm diameter.
The neutron reflectometer MIRA [Citation19], located at the Heinz Maier-Leibnitz Institute (Munich, Germany), was used to obtain complimentary higher angular resolution NPD results, as well as low angle count, at RT, 145.0(5), 38.0(2) and 12.2(2) K. The incident neutron beam, with λ = 4.334(1) Å, was unpolarized. Since MIRA is designed for small angle scattering, the obtained NPD profiles were limited to a small angular range. Three grams of (Cr1−xMnx)2GeC powder were loaded into a V cylindrical holder, with a 10 mm diameter.
The high angular resolution (and low incident neutron flux) E9 neutron diffractometer (HZB) was used to obtain high-resolution NPD profile at RT. An incident λ = 1.795(1) Å was obtained using the 111 reflection of a Ge single crystal monochromator. Measurements were undertaken on 5 g of (Cr1−xMnx)2GeC powder in a 6 mm diameter V holder.
3. Results and analysis
When M is plotted as function of externally applied magnetic field, H (Figure (a)), a steep M increase appears below 280 K. The field cooled (FC), at 35(3) Oe, and the zero field cooled (ZFC), M as a function of T (Figure (b), symbols), obtained under a ∼15 Oe applied field upon heating, exhibit significant change at three temperatures, T1, T2, T3, designated as ‘magnetic event temperatures’ herein. Both the FC and ZFC Ms coincide at Tmrg = 290(5) K. Above T1, a Curie-Weiss type magnetization model [Citation20] fits the ZFC (and the FC) M values (Figure (c), line), with an effective paramagnetic moment of 0.5(2) μB.
Figure 1. (a) Macroscopic magnetization, M, of (Cr1−xMnx)2GeC sample as a function of externally applied magnetic field, H, at 340, 280, 50 and 5 K. (b) M as a function of temperature, T, after cooling the sample at H = 35(3) Oe (circles, FC) and after cooling the sample under a near zero field (squares, ZFC), respectively. A ∼15 Oe external field was applied upon heating in both cases. In addition, the AC susceptibility, χ, observed using AC field frequencies of 293 Hz (lower line) and 1465 Hz (upper line) are also presented with an arbitrary scale. (c) The ZFC M values above 330 K, fitted with a Curie-Weiss type fitted curve (see text). (d) Derivative, dχ/dT, for both AC field frequencies, as a function of T. In all cases, the random error is smaller than the symbol size or line width.
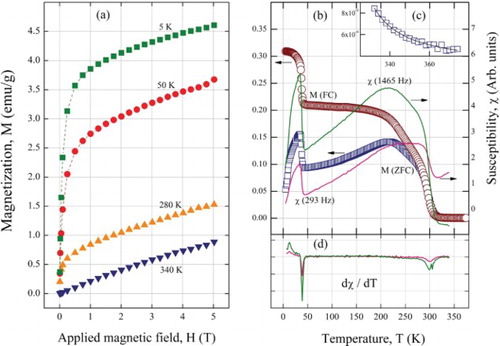
The magnetic events temperatures obtained from the AC susceptibility results (Figure (b), lines) agree with those obtained from the magnetization measurements. In second order magnetic phase transitions, χ exhibits a discontinuity at the transition temperature [Citation21]. Hence, the extremum of dχ/dT (Figure (d)) is the best estimate for the temperature of an observed magnetic event. The width of this extremum indicates the uncertainty in these values. Based on the results shown in Figure (d), we identify three magnetic events at T1 = 300(4), T2 = 38.0(5), T3 = 12(2) K. In addition, because the Ts of these extremums coincide for both the 1465 and 293 Hz AC field frequencies (Figure (d)), the presence of a ‘spin-glass’ state can be excluded [Citation22].
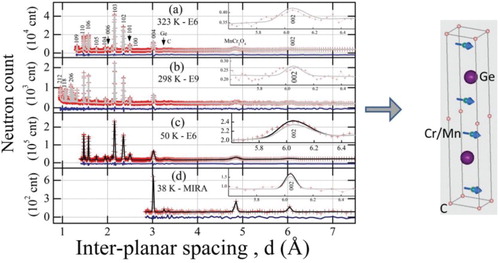
The observed NPD profile using E6 above T1 (Figure (a)), and the observed NPD profiles using both E9 (Figure (b)) and MIRA slightly below T1 (not shown), in which the contribution of magnetic scattering—if present—is expected to be negligible, were analyzed using the Rietveld refinement method [Citation23]. A P63/mmc space group [Citation24] was used, with the Cr1−xMnx, Ge and C atoms positioned at the 4f, 2e and 2a sites, respectively. The refined profiles are in good agreement with the observed profiles, as can be viewed by their corresponding differences (Figure (a) and (b), blue horizontal lines). The obtained lattice parameters a0 and c0, the z coordinate of the 4f site, z4f, the Mn occupancy of the 4f site, x, and the relative fraction of the M2AX phase, Ω, are listed in Table . Isotropic atomic displacement parameters [Citation26] were assumed for each site separately (not reported).
Figure 2. Neutron powder diffraction of (Cr1−xMnx)2GeC observed using, (a) E6 at 323 K (symbols), the Rietveld refined profile (gray line) and their corresponding difference (horizontal line). Reflections that originate from the MAX structure are denoted by their Miller indices. Reflections that originate from the impurities MnCr2O4, graphite and Ge are also noted. (b) E9 at 298 K (symbols) with the corresponding Rietveld refined profile (gray line) and difference (horizontal line). Additional reflections of the MAX structure are denoted. (c) E6 at 50 K (symbols) with the corresponding Rietveld refined profile, which includes both crystallographic and magnetic profiles (black line), and difference (horizontal line). (d) MIRA at 38 K (symbols) with the corresponding Rietveld refined profile, which includes both crystallographic and magnetic profiles (black line), and difference (horizontal line). In all cases insets in the top right corners show the observed 002 reflection profile (symbols) with the corresponding refined profile including the crystallographic profile alone (gray) and, in (c) and (d), including both crystallographic and magnetic profiles (black).
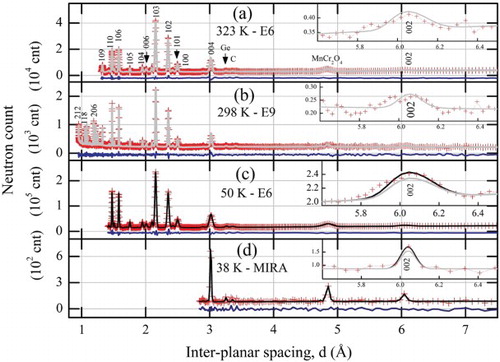
Table 1. Crystallographic parameters of (Cr1−xMnx)2GeC, obtained using NPD at E6, E9 and MIRA, refined using the P63/mmc space group. a0 and c0 are the lattice parameters, x is the Mn concentration on the 4f site, Ω is the relative fraction of the (Cr1−xMnx)2GeC unit cells within the sample. Rf is the refinement’s quality agreement factor [Citation25]. The magnetic moment, μ4f, oriented perpendicular to the hexagonal c axis (see text), was refined using the P1 space group. Numbers in parentheses are standard deviations of the last significant digit, representing the statistical uncertainty component.
Reflections additional to those of the M2AX structure were found to originate from MnCr2O4 [Citation27] (Fd-3 m) Ge (Fd-3 m), MnO2 (P42/mnm) and graphite (P63/mmc) impurity phases with refined relative fraction percentages of 3.5(3), 0.7(1), 0.5(1) and 0.13(5), respectively, averaged for E6 and E9 results. At 8.389(2) Å, the refined lattice constant of MnCr2O4—averaged for the E6 and E9 results—is lower than the previously reported value of 8.437(2) Å [Citation27]. Because the observed NPD profile of MIRA includes only the 002, 004 reflections of the MAX structure (Figure (d)), only c0, x and Ω were refined and found to be in good agreement with their corresponding values obtained using E6 and E9 (Table ).
The 002 and 100 reflections serve as proxies for FM ordering, originating from the 4f site, within (Cr0.96Mn0.04)2GeC. The ratio between the magnetic and nuclear scattering contributions in other reflections is smaller by a factor of three (and less). The 002 magnetic count originates from an FM component oriented in the basal planes, while the 100 magnetic count originates from either a c-axis or basal plane components or a combination of both. Moreover, the nuclear count of the 002 reflection is expected to remain constant as T is decreased because the change in the thermal diffuse scattering, that is, the change in the Debye–Waller coefficients [Citation24], associated with this reflection, is negligible due to its large d value (∼6 Å).
An increase in the 002 count is observed at 50 K (E6, Figure (c)) and at 38 K (MIRA, Figure (d)). Although this count increase is small, its presence above crystallographic count (black line) is observed using two independent neutron instruments, with statistical significance. Moreover, this 002 count increase corresponds to the T1 magnetization increase (Figure (b)), and in retrospect, the refined ordered magnetic moment of ∼0.75 μB per 4f atom (see below), averaged for the E6 and MIRA results (Table ), is consistent with the effective paramagnetic moment of 0.5(2) μB above T1 (Figure (c)). Notice, that the effective paramagnetic moment includes also the paramagnetic contribution of the MnCr2O4 impurity phase. Hence, we conclude that magnetic ordering perpendicular to, or containing a perpendicular component to, the c-axis is present below 50 K. However, because the 002 count increase is small, and originates from a single reflection, it is difficult to distinguish whether it originates from long or short range magnetic ordering. Because the 002 profile remains unchanged as T is lowered from 50 to 1.5 K (not shown) [Citation25], and whereas both the integrated count and profile widths, generated by short range magnetic ordering, are expected to exhibit a T-dependence, it is reasonable to assume long range magnetic ordering. In this case, a non-c-axis magnetic component does not conform with hexagonal symmetry and would lead to a symmetry decrease.Footnote1
A two-phase-based refinement process was carried out for both the E6 and MIRA results (Figure (c,d), black lines). The first phase is crystallographic, with the initial parameters values set at the refined values obtained from the paramagnetic state (Figure (a,b)). The second phase is magnetic, based on the P1 space group, with the a0, c0, z4f, Ω and instrumental parameters constrained to their corresponding values within the first phase. Assuming an FM spins arrangement within the 4f site, an average ordered magnetic moment of μ4f = 0.6(2) μB/atom is refined using E6 at 50 K. For MIRA, μ4f = 0.9(2) μB/atom is refined at 38 K. The sum of the crystallographic and magnetic refined profiles (black line) fits the observed profile better than the crystallographic profile alone in both the E6 and MIRA results (see top insets in Figure (c) and (d), respectively). The effects of different Mn and Cr magnetic form factors on the refined μ4f were found to be negligible.
Upon cooling below T3 to 1.5 K (E6), and below T2 to 12 K (MIRA), the count profiles of the MAX reflections remain unchanged. Below T2 (and above T3), MIRA results show that no additional reflections emerge up to d ∼ 100 Å. On the other hand, the count profile of the MnCr2O4 reflections was found to increase in both cases. Also, below T3, in agreement with previous findings [Citation27–29], low count satellite reflections, originating from a spiral magnetic structure, were found. However, new unidentified reflections, with an inter-planar distance of ∼5.4 and 2.7 Å, and similar count to the satellite reflections, are also found at 1.5 K.
4. Discussion
The negative neutron scattering length of Mn [Citation24], versus an opposite sign and similar size scattering length of Cr, offers high sensitivity to x (Table ). Herein by combining the E6, MIRA and E9 NPD results, x is found with a combined statistical (Table ) and systematical precision of ∼0.002 and 0.005, respectively. On the other hand, because Cr and Mn are adjacent in the periodic table, the corresponding x-ray diffraction accuracy in x is ∼0.4. The uncertainty weighted average of the x values in Table yields 0.042(5). We thus establish that Mn was indeed successfully introduced into a Cr2GeC. However, only ∼4 at.% of the Cr atoms are randomly replaced by Mn to yield (Cr0.96Mn0.04)2GeC, while the nominal amount aimed for was 10 at.% (Section 2). The missing Mn is consistent with its amount in the MnCr2O4 impurity phase [Citation30].Footnote2
Using the refined crystallographic and magnetic profiles of (Cr0.96Mn0.04)2GeC in E6 and MIRA (Figure (c,d), black lines), and the corresponding statistical precision of the 002 and 100 profile counts (after background subtraction), we find that the limit of detection for an FM (or a ferrimagnetic) structure, oriented perpendicular and parallel to the c axis, is ∼0.5 and ∼1 μB/atom within the 4f site, respectively. Because the refined μ4f (Table ) is just above the limit of detection, a similar size parallel component may be present but below the 100 limit of detection.Footnote3
Neglecting the differences in temperature, the average value of μ4f obtained from E6 and MIRA (Table ) is 0.75 µB/atom. Coincidentally or not, this value is in excellent agreement with the net moment one would obtain if one assumes that the Mn and Cr moments are the DFT predicted values of 2 and 0.7 μB [Citation7], respectively, since 0.04×2 + 0.96 × 0.7 = 0.75. If one assumes Cr2GeC is AFM with 0.7 µB on each Cr atom [Citation17], it follows that the Mn atoms must align all the Cr moments in the same direction. This conjecture is consistent with the increase of Curie temperatures with increasing Mn content [Citation10,Citation11]. Moreover, the obtained magnetic structure is consistent with the previous theoretical prediction [Citation7] of competing AFM and FM ordering within Cr-Mn-Ge-C MAX phase systems.
Upon cooling below T2, the neutron count of the 002 and 100 reflections remain unchanged, indicating that the magnetic structure, which emerged below T1, is unaffected by the T2 magnetic event. The count increase is found to originate from the MnCr2O4 impurity reflections, indicating the onset of a collinear [Citation26] magnetic ordering within. Hence, the ‘reentrant cluster glass state’ magnetic ordering model, previously proposed [Citation11] for the T2 magnetic event, cannot hold. Below T3, several new low count reflections are found to emerge. Few of these are identified as MnCr2O4 satellite reflections, originating from a spiral [Citation26] magnetic structure. At this point, due to angular resolution and statistics limitations of the E6 and MIRA results, we can only speculate that the unidentified reflections originate from AFM ordering within (Cr0.96,Mn0.04)2GeC, which was previously proposed [Citation7] to coexist with FM ordering.
5. Conclusions
Neutron diffraction shows that ≈4 at.% of Cr atoms are replaced by Mn, yielding a MAX phase with a composition of (Cr0.96Mn0.04)2GeC. The increase in the 002 reflection’s count below 50 K (Figure (c,d)) is consistent with FM ordering of the atoms within the 4f site. As far as we are aware, this is the first direct evidence for bulk MAX phase magnetic ordering, shown on a microscopic scale. Moreover, since this ordering is attributed to the magnetization increase observed just below 300 K (Figure (b)), the possibility for synthesizing magnetically ordered MAX phases at room temperature must be noted. Future work, focused on introducing higher Mn concentrations within Cr2GeC, is recommended.
Acknowledgements
The authors wish to acknowledge Prof. I. Felner from the Hebrew University in Jerusalem (Israel) for making the University’s SQUID magnetometer and AC susceptometer available for this work. One of the author (O.R.) thanks Prof. I. Felner for many insightful discussions about magnetometry. O.R. also acknowledges Dr F. Yokaichiya for enabling the use of the E9 diffractometer (Helmholtz–Zentrum Berlin).
Disclosure statement
No potential conflict of interest was reported by the authors.
Notes
1. The 1.5 and 50 K reflections profile width is not comparable with that at 323 K (Figure (a)) because different angular resolution settings were used.
2. Considering the MnCr2O4 impurity, the following balance for Mn content holds: 0.1 × 4 ≈ x × 4 × Ω + 8 ×ΩMnCr2O4. Where 4 and 8 is the site multiplicity occupied by the Mn atoms within the unit cell of (Cr0.096Mn0.04)2GeC and MnCr2O4, respectively, ΩMnCr2O4 = 0.035(3) is the relative fraction of the MnCr2O4 impurity (Section 3) and x and Ω are given in Table .
3. If a parallel component is absent (present), an arrangement of spins perpendicular to the c axis lowers the crystal symmetry to orthorhombic (see note 1) (monoclinic).
References
- Nowotny H. Strukturchemie einiger verbindungen der Übergangsmetalle mit den elementen C, Si, Ge, Sn. Prog Solid State Chem. 1971;5:27–70. doi: 10.1016/0079-6786(71)90016-1
- Barsoum MW. The MN+1AXN phases: a new class of solids. Prog Solid State Chem. 2000;28:201–281. doi: 10.1016/S0079-6786(00)00006-6
- Barsoum MW. MAX phases: properties of machinable ternary carbides and nitrides. Weinheim: John Wiley & Sons; 2013.
- Luo W, Ahuja R. Magnetic Fen+1ACn (n = 1, 2, 3, and A = Al, Si, Ge) phases: from ab initio theory. J Phys Cond Matter. 2008;20:064217–064221. doi: 10.1088/0953-8984/20/6/064217
- Dahlqvist M, Alling B, Abrikosov IA, et al. Magnetic nanoscale laminates with tunable exchange coupling from first principles. Phys Rev B. 2011;84:220403–220408(R). doi: 10.1103/PhysRevB.84.220403
- Mockute A, Dahlqvist M, Emmerlich J, et al. Synthesis andab initiocalculations of nanolaminated (Cr,Mn)2AlC compounds. Phys Rev B. 2013;87:094113–094117. doi: 10.1103/PhysRevB.87.094113
- Ingason A, Mockute A, Dahlqvist M, et al. Magnetic self-organized atomic laminate from first principles and thin film synthesis. Phys Rev Lett. 2013;110:195502–195507. doi: 10.1103/PhysRevLett.110.195502
- Mockute A, Persson P, Magnus F, et al. Synthesis and characterization of arc deposited magnetic (Cr,Mn)2AlC MAX phase films. Phys Status Solidi. 2014;5:420–423.
- Ingason A, Petruhins A, Dahlqvist M, et al. A nanolaminated magnetic phase: Mn2GaC. Mater Res Lett. 2014;2:89–93. doi: 10.1080/21663831.2013.865105
- Liu Z, Waki T, Tabata Y, et al. Mn-doping-induced itinerant-electron ferromagnetism inCr2GeC. Phys Rev B. 2014;89:054435–054441. doi: 10.1103/PhysRevB.89.054435
- Tao QZ, Hu CF, Lin S, et al. Mater Res Lett. 2014;2/4:192–198. doi: 10.1080/21663831.2014.909542
- Petruhins A, Ingason AS, Lu J, et al. Synthesis and characterization of magnetic (Cr0.5Mn0.5)2GaC thin films. J Mater Sci. 2015;50:4495–4502. doi: 10.1007/s10853-015-8999-8
- Meshkian R, Ingason A, Arnalds U, et al. A magnetic atomic laminate from thin film synthesis: (Mo0.5Mn0.5)(2)GaC. Appl Phys Lett Mat. 2015;3:076102. http://dx.doi.org/10.1063/1.4926611
- Dahlqvist M, Ingason A, Alling B, et al. Magnetically driven anisotropic structural changes in the atomic laminateMn2GaC. Phys Rev B. 2016;93:014410–014419. doi: 10.1103/PhysRevB.93.014410
- Ingason A, Pálsson G, Dahlqvist M, et al. Long-range antiferromagnetic order in epitaxialMn2GaCthin films from neutron reflectometry. Phys Rev B. 2016;94:024416–024420. doi: 10.1103/PhysRevB.94.024416
- Ingason A, Dahlqvist M, Rosen J. Magnetic MAX phases from theory and experiments; a review. J Phys Condens Matter. 2016;28:433003. doi: 10.1088/0953-8984/28/43/433003
- Dahlqvist M, Alling B, Rosen J. A critical evaluation of GGA + U modeling for atomic, electronic and magnetic structure of Cr2AlC, Cr2GaC and Cr2GeC. J Phys Condens Matter. 2015;27:095601. doi: 10.1088/0953-8984/27/9/095601
- Jaouen M, Bugnet M, Jaouen N, et al. Experimental evidence of Cr magnetic moments at low temperature in Cr2A(A=Al, Ge)C. J Phys: Condens Matter. 2014;26:176002.
- Georgii R, Seemann K. J of Large-Scale Research Facilities. 2015;A3:1–4.
- Smart JS. Effective field theories of magnetism. New York (NY): W.B. Saunders; 1966.
- Kittel C. Introduction to solid state physics. Hoboken (NJ): Wiley Hoboken; 2005.
- Hidetoshi N. Statistical physics of spin glasses and information processing: an introduction. Oxford: Oxford University Press; 2001.
- Carvajal JR. Recent advances in magnetic structure determination by neutron powder diffraction. Physica B. 1993;192:55–69. doi: 10.1016/0921-4526(93)90108-I
- Hahn T. International tables for crystallography, vol A, space-group symmetry. Dordrecht: Kluwer Dordercht; 1995.
- Rodriguez-Carvajal J. An introduction to the program FullProf 2000 [Internet]. Available from: http://www.ill.eu/sites/fullprof/php/tutorials.html.
- Lovesey SW. Theory of neutron scattering from condensed matter. Oxford: Oxford Press UK; 1984.
- Hastings JM, Corliss LM. Magnetic structure of manganese chromite. Phys Rev. 1962;126:556–565. doi: 10.1103/PhysRev.126.556
- Opechowski W, Guccione R. In: Rado GT, Suhl H, editor. Magnetism. New York (NY): Academic; 1965.
- Bhowmik RN, Ranganathan R, Nagarajan R. Lattice expansion and noncollinear to collinear ferrimagnetic order in aMnCr2O4nanoparticle. Phys Rev B. 2006;73:144413–144422. doi: 10.1103/PhysRevB.73.144413
- Winkler E, Blanco Canosa S, Rivadulla F, et al. Magnetocrystalline interactions inMnCr2O4spinel. Phys Rev B. 2009;80:104418–104426. doi: 10.1103/PhysRevB.80.104418