
 ?Mathematical formulae have been encoded as MathML and are displayed in this HTML version using MathJax in order to improve their display. Uncheck the box to turn MathJax off. This feature requires Javascript. Click on a formula to zoom.
ABSTRACT
Bulk metallic glasses (BMGs), like other glasses, soften in the super-cooled liquid region (SCLR). Here in this work, surprisingly, a large expansion is reported occurring in the deep SCLR of a Zr47Cu37Al8Ag8 BMG. Nano-crystals (NCs) are found precipitated during the anomalous expansion of Zr47Cu37Al8Ag8, but also in the SCLR of Zr43Cu41Al8Ag8 that exhibits a conventional softening. It is found that there is a steep composition and density change at the NCs/amorphous matrix transition region in the former alloy, and this transition region exerts a thermal stress of about 0.15 MPa to the surrounding super-cooled liquid (SCL) and drives the soft SCL to expand severely.
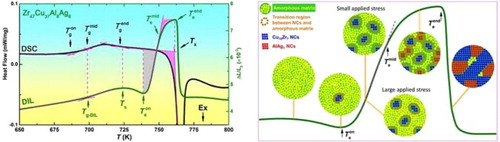
GRAPHICAL ABSTRACT
1. Introduction
An attractive advantage of bulk metallic glasses (BMGs) over traditional alloys is that it can be thermal-plastically formed in the SCLR, due to the viscous flow of the super-cooled liquid (SCL) [Citation1]. The viscous flow, however, brings along an unpleasant consequence when measuring the thermal expansion of BMGs using the mechanical thermal dilatation (DIL) method, i.e. sample softening [Citation2–6], which essentially results in the DIL data look similar for different compositions, and thus featureless. It is reported that some BMGs have anomalous calorimetric signals in the SCLR, such as PdNiP [Citation7], FeMoYB [Citation8], ZrTiBe [Citation9] and CuZrAlY [Citation10], which are correlated to the poly-amorphous phase transition between two SCLs [Citation7], the formation of local chemical short-range order [Citation8,Citation9], or the precipitation of nano-crystals (NCs) [Citation10]. However, to the best of our knowledge, no anomalous expansion, especially a large expansion in the SCLR detected by the DIL method, during which a small amount of compressive load is applied on the sample, has been reported. On the other hand, BMGs shrink upon crystallization due to the amorphous materials with a disordered structure usually having a lower density than the crystalline counterpart with an ordered structure [Citation11]. So far, only Pd40Ni40−xCuxP20 (x > 30) alloys are reported to be less dense in the crystalline state than in the amorphous state [Citation12]. A similar scenario, can also be expected when precipitation of NCs occurs in the SCLR, which is indeed seen in Zr-based BMGs [Citation13] and there is no anomalous thermal expansion behavior when heating up in the SCLR [Citation6]. In this work, we report an anomalous expansion, and particularly a large expansion in the deep SCLR of a Zr47Cu37Al8Ag8 (Zr47) BMG [Citation14], where NC precipitates, revealing a special effect of nano-crystallization on the physical properties of the SCL.
2. Experimental methods
2.1. Sample preparation
Zr43Cu41Al8Ag8 (Zr43) and Zr47Cu37Al8Ag8 (Zr47) BMG plates with a dimension of 2 × 5 × 50 mm3 were fabricated by copper-mold casting (Rapid Quench Machine System VF-RQT50, MAKABE).
2.2. Thermal analysis tests
The glass transition and crystallization behaviors were measured by differential scanning calorimetry analyses (DSC, NETZSCH 200F3) under a high-purity argon flow. The thermal expansion behavior was measured in a thermal dilatometer (NETZSCH DIL 402C) using samples with dimensions of 2 × 5 × 20, 2 × 2 × 20, 2 × 1 × 20 and 1 × 1 × 20 mm3 cut from the as-cast plates. The equipment was calibrated with a standard alumina sample and the applied push load was fixed as 0.3 N, corresponding to an applied compressive stress of 0.03–0.3 MPa. Accuracy of the measurement process was ensured by the very low-thermal expansion of the Invar measurement system at a constant temperature (20.0 ± 0.1°C) maintained by the circulating coolant. The equipment was evacuated to 1 × 10⁻⁴ mbar and back-filled by 1 bar high-purity argon before the tests, and was flushed by a high-purity argon flow during the tests. The heating rates of the DSC and DIL tests were 0.083 Ks−1.
2.3. Structural analysis tests
The samples were heated to different temperatures in the DIL instrument and quickly moved out and fast cooled by the ice water. The as-cast and water-cooled samples were tested by X-ray diffraction (XRD, Bruker D8, Cu-Kα, 40 kV × 200 mA) and high-resolution transmission electron microscopy (HRTEM, FEI Tecnai F30). The TEM samples were prepared by ion milling. The microstructures and chemical compositions were also studied under the scanning transmission electron microscopy (STEM) mode equipped with a high-angle annular dark field (HAADF) detector and an energy dispersive X-ray (EDX) spectrometer. A step size of 0.2 nm was used in the linear energy-spectrum scanning.
2.4. Density measurement
Densities of the as-cast and water-cooled samples were measured by the Archimedes method using the deionized water and a precise electronic balance with a sensitivity of 0.1 mg.
3. Results
3.1. The anomalous thermal expansion in the deep SCLR
As shown in Figure (a), the slope of DIL trace of Zr43 changes at Tg-DIL, that is the glass transition point on the DIL trace. The Tg-DIL is close to the mid glass transition temperature rather than the onset temperature
or the end temperature
, because the endothermic behavior is more intense and thus the speed of free volume generation is faster at
than that at other temperatures, according to the free volume theory [Citation15]. The glass transition ends at
, and the amorphous solid completely transits to the SCL and begins to soften, as indicated by the DIL trace starting to change gently at the softening temperature Ts. When heating to the crystallization temperature Tx, the DIL trace shows a dramatic drop because crystallization, the process of atomic long-range arrangement changing from disorder to order, is usually accompanied by a fast volume shrinkage [Citation11]. After crystallization, the sample expands linearly again.
Figure 1. DSC and DIL traces of (a) Zr43Cu41Al8Ag8 and Zr47Cu37Al8Ag8 BMGs.
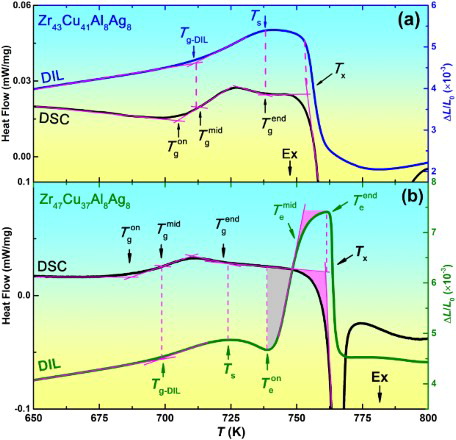
As described above, Zr43 has a normal thermal expansion behavior, similar to other previously reported BMGs, with the difference lying in the degree of softening before Tx. Some BMGs have gentle softening, such as Fe- [Citation4], Ti- [Citation5] and Cu- [Citation3,Citation5] BMGs. Other BMGs have severe softening, such as Mg- [Citation5], Pd- [Citation2,Citation4,Citation5], rare-earth- [Citation3] and Zr-based BMGs [Citation5], due to their larger width of SCLR and lower Tg [Citation16,Citation17]. In spite of different degrees, the previously reported BMGs all soften, rather than expand, in the SCLR when measured by the mechanical DIL method. It is therefore indeed surprising to observe the DIL trace of Zr47. As shown in Figure (b), after a gentle softening above Ts, an unexpected sharp expansion suddenly stands out. From the expansion onset temperature of 739 K to the end temperature
of 761 K, the length quickly expands by about 3.0‰, corresponding to a volume expansion of about 1%. Noting that from the room temperature to Ts of 724 K, the length only expands by 4.9‰.
Detailed observation shows that the anomalous expansion experiences two stages separated by . The expansion is very quick in the first stage and becomes much slow in the second stage. As marked by the shadows in the DSC trace, the heat flow signal shows no obvious change in the first stage, and an early onset exothermal crystallization process in the second stage. With the increase in temperature, the exothermal crystallization process becomes much severe above Tx. At the same time, above
that is very close to Tx, the DIL trace quickly sinks in. This is attributed to the severe shrinkage induced by the fast crystallization, just like what happens in Zr43 and all other reported BMGs. Noting that the good matches between
and Tg-DIL,
and Ts, and
and Tx show the DSC and DIL signals always have precise correspondence. Therefore, the absence of extra energy change in the first stage of the anomalous expansion is not due to experimental inaccuracy, but is indeed a real and unexpected phenomenon [Citation14].
Usually, in phase transitions or other kinds of structural transitions, the volume changes are companied by the energy changes. For example, alloys absorb heat and synchronously expand during glass transition and melting, while they release heat and synchronously shrink during crystallization and solidification. Based on these known phenomena, an endothermic process accompanied with the first stage of anomalous expansion is expected. The smooth DSC trace suggests that the energy needed in the anomalous expansion may be compensated by the energy released from some exothermal processes in the first stage. It is reported that some BMGs have a clear exothermal signal in the SCLR, which is correlated to the transition between different amorphous structures [Citation7–9], or the precipitation of NCs [Citation10]. It is thus necessary to investigate the detailed structural evolution in the SCLR of Zr47.
3.2. The structural evolution in the SCLR
Zr47 and Zr43 alloys are heated to different temperatures in the DIL instrument, as shown in Figure (a), and then fast cooled by the ice water. The heating temperatures are set as 723, 740 and 758 K (723 K < Ts < 740 K < Tx< 758 K) for Zr43, and 730, 743, 753 and 763 K (Ts < 730 K < < 743 K <
< 753 K <
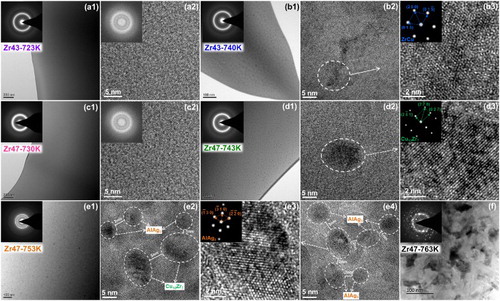
=Tx < 763 K) for Zr47, respectively. The cooling rate in water quenching is estimated to be in the order of 103 Ks−1, which ensures that decomposition of the microstructure during quenching is prevented [Citation18]. XRD results show that only the samples heated above Tx show obvious crystalline peaks. However, HRTEM results show that only the Zr43-723 K and Zr47-730 K samples have a fully amorphous structure, and the other samples already present a large amount of precipitation of NCs. The precipitates in Zr43-740 K and Zr47-743 K samples are ZrCu and Cu10Zr7 NCs, respectively, and no other NC are found by HRTEM. The Cu10Zr7 NCs have a uniform distribution in the amorphous matrix as indicated in Figure (d1). The dimension d and concentration c are about 10–20 nm and 2 × 10⁻⁴ molL−1, respectively. Taking the Cu10Zr7 NCs have a roughly spherical structure with an average diameter d of 15 nm, the volume fraction vC (vC = 1/6 × π × d3 × c × NA, where NA is the Avogadro constant) of the NCs is estimated to be ∼20% in the Zr47-743 K sample. The precipitation of such an amount of NCs should release some heat, which compensates the heat that is needed in the first stage of the anomalous expansion, and results in a smooth DSC trace. In the Zr47-753 K sample that is cooled from the second stage of the anomalous expansion, apart from Cu10Zr7 NCs, a lot of AlAg3 NCs also precipitate. As shown in Figure (e2,e4), the distances between most neighboring AlAg3 NCs are about 1–3 nm and thus result in the crowed surroundings of these NCs, which is quite different to the open surroundings shown in Figure (d2). In the Zr47-763 K sample, large areas of crystalline phases with complex structures are formed. The NCs grow to XRD detectable phases.
Figure 2. (a) DIL traces of Zr43Cu41Al8Ag8 and Zr47Cu37Al8Ag8 BMGs heating to different temperatures and (b) XRD patterns of water-cooled samples.
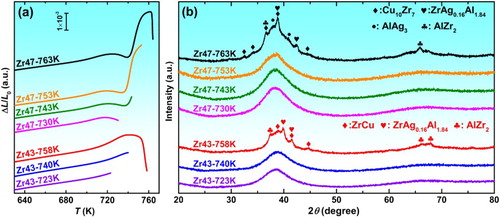
Figure 3. HRTEM and selected-area electron diffraction of the water-cooled samples.
As listed in Table , the densities of both Zr43 and Zr47 increase after heating to above Tg due to the free volume annihilation [Citation19], even that the precipitated ZrCu NC has a slightly smaller density than that of the as-cast Zr43. The densities of two alloys further increase after heating above Tx, which is a common phenomenon occurring in almost all metallic glasses. The density of Cu10Zr7 is 5% larger than that of the as-cast Zr47 sample. It is thus unlikely that the anomalous expansion occurred in the first stage can be ascribed to precipitates with a smaller density [Citation12]. The large anomalous expansion, however, must leave some traces in the microstructure of the fast cooled sample, which needs further investigation. In addition, the density of AlAg3 is 19% larger than that of the as-cast Zr47 sample. The precipitates with a much larger density can slow down the anomalous expansion in the second stage.
Table 1. Room temperature densities of the as-cast samples, samples fast cooled from different temperature, and ZrCu, Cu10Zr7 and AlAg3 crystals according to the powder diffraction file (PDF) database.
3.3. The C/A region with steep density and composition
It is very difficult to measure the absolute density of individual microstructures, although the relative density change in local microstructure, even at the nano-meter scale, can be studied by STEM [Citation20]. In the HAADF and EDX detectors coupled STEM mode, the detector receives and records the counts and energy of the characteristic spectral X-ray photons emitted from the microstructure shot by the electron beam. On the one hand, the relative content of different elements can be calculated by normalizing the photon counts with particular energies by total photon counts. On the other hand, the total photon counts are proportional to the total atomic counts of shot parts, thus are determined by the atomic density and sample thickness. As shown in Figure (a2,a3), in the Zr43-740 K sample, the photon counts during the linear scanning increases slightly from the ZrCu NC side to the amorphous matrix side, which agrees with the slightly higher density of the latter. Noting that the density of ZrCu NC (7.419 gcm−3) is lower than the sample density (7.466 gcm−3), the density of the amorphous matrix is thus higher than 7.466 gcm−3, as indicted in the Figure (a3). In addition, from the beginning to the end, the photon counts continually increases along the scanning direction. It is known that the thickness of ion milled sample increases gradually from the central hole to outside. It is very likely that the linear scanning of Figure (a1) is roughly along the radial direction from the central hole, resulting a gradual increase of the thickness and thus the increasing emitted photon counts. By contrast, most parts of the curve shown in Figure (b3) are flat, which is possibly due to the linear scanning is roughly perpendicular to the radial direction. A more important difference between Figure (a3,b3) lies in the degree of the fluctuation in the transition region from the NC to the amorphous matrix, as indicated by the C/A region delineated using dotted lines. Clearly, the photon counts in the C/A region of Zr43-740 K and Zr47-743 K samples have a gentle and dramatic fluctuation, respectively, meaning that the atomic density does not change much in the former but change dramatically in the latter, which agrees well with densities listed in Table .
Figure 4. (a1, a2, b1, b2) Colored STEM images and (a3, b3) the change of total characteristic spectral X-ray photon counts along the linear scanning direction of Zr43-740 K and Zr47-743 K samples. (b4) The relative atomic percentage change in the transition region from the nano-crystal Cu10Zr7 to the amorphous phase in the Zr47-743 K sample.
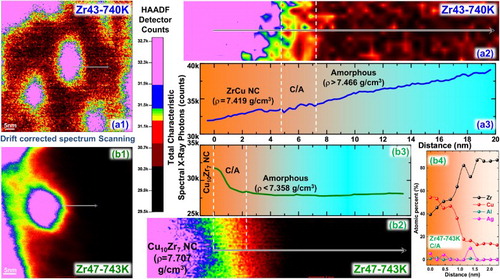
Besides the atomic density, another significant difference is that the chemical composition, i.e. the atomic ratio of Zr to Cu, changes by 15% from the Cu10Zr7 NC to the amorphous matrix in the Zr47-743 K sample, but only changes by 1% from the ZrCu NC to the amorphous matrix in the Zr43-740 K sample, as also listed in Table . As shown in Figure (b4), in the C/A region, from the Cu10Zr7 NC side to the amorphous matrix side, the content of Zr increases and that of Cu decreases sharply, displaying a distinct composition change. Based on the above observation, the C/A region with steep density and composition change is exactly the characteristic microstructure left after the anomalous expansion in the Zr47-743 K sample.
3.4. The thermal stress
It was found a long time ago that the thermal expansion coefficient, α, of the grain boundary is a few to a dozen times larger than that of the grain [Citation21,Citation22], which is attributed to the atoms at grain boundaries having weaker binding and thus larger inharmonic vibrations [Citation23,Citation24]. Like the grain boundary, the C/A interface or transition region shall also have a larger α. It is predicted that in the beginning of nano-crystallization of the amorphous materials, an expansion rather than a shrinkage may occur due to the large α of the C/A interface [Citation25]. Based on the STEM observation, a C/A region with an abrupt change in density and composition exists between the Cu10Zr7 NCs and the amorphous matrix of the Zr47, which could have a lager α and result in an expansion, even that the density of Cu10Zr7 is 5% larger than the as-cast sample.
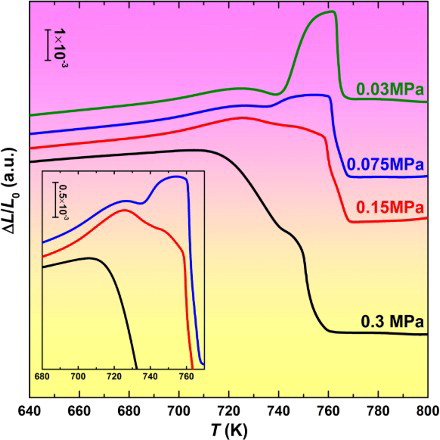
Since the C/A region has a larger α, the α mismatch will induce a thermal stress with the direction extending from the C/A region to the surrounding SCL. The SCL, especially the deep SCL, which has a viscosity of several order of magnitudes lower than that of the glassy solid [Citation1], will expand under this thermal stress. On the other hand, as shown in Figure (b), from Ts to , the pure SCL of Zr47 without precipitates already softens slightly under the instrument applied compressive stress of 0.03 MPa. Above
, 80% volume fraction of the sample is still SCL that should keep on softening, unless a thermal stress larger than 0.03 MPa suppresses the softening and expands the SCL severely. To estimate the thermal stress, thinner samples were used to test the thermal expansion behavior under the same applied load (so a larger applied stress). As shown in Figure , with an increase of the applied stress, the anomalous expansion weakens significantly, while the softening becomes more and more severe. When the applied stress is 0.15 MPa, both the anomalous expansion and the softening are not very conspicuous, indicating a rough balance between the instrument applied stress and the thermal stress is reached. The thermal stress is thus estimated to be about 0.15 MPa. In addition, a small bump always occurs between the softening stage and the fast crystallization shrinkage, indicating the expansion of the C/A region cannot be completely suppressed even under a large applied stress.
Figure 5. Thermal expansion traces of Zr47 with different dimensions. The corresponding instrument applied compressive stresses of 0.03–0.3 MPa.
4. Discussion
Wada and Inoue et al. studied the SCL foaming of porous Zr48Cu36Al8Ag8 BMG that has a similar composition with Zr47 [Citation26]. The spherical pores have a diameter of dozens of micrometers and contain 1 MPa of pressurized helium. Annealing the porous alloy in the SCLR under vacuum increased the porosity from 3.9% to 13%, which is corresponding to a total volume expansion of 10%. The large expansion is generated by the stress of about 1 MPa with the direction extending from the pores to the surrounding soft SCL, which essentially can be deemed as a thermal stress induced by the large α mismatch between the helium and the SCL. As a comparison, the volume of Zr47 expands by about 1% in the deep SCLR under a net stress of 0.12 MPa (the thermal stress of 0.15 MPa exerted by the C/A region, minus the instrument applied compressive stress of 0.03 MPa). Comparing to the foaming of porous BMGs, both the thermal stress and the volume expansion decrease by an order of magnitude for the case of Zr47, indicating a similarity between these two processes. Although the C/A region in Zr47 and the pores of BMG foam are quite different, in terms of both material type and size, the anomalous expansion seen here can be deemed sharing a similar mechanism with the foaming process, i.e. the viscous flow of the SCL under a thermal stress.
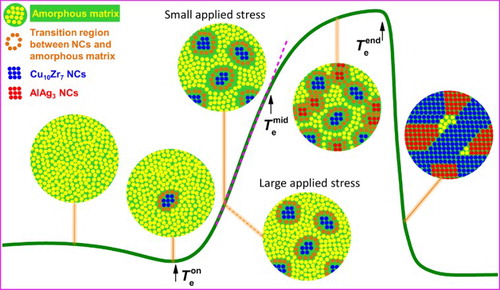
Based on the above discussion, the microstructural evolutions behind the anomalous expansion are schematically presented in Figure . The sample has a fully amorphous structure below and some Cu10Zr7 NCs begin to precipitate at
. Above
, more Cu10Zr7 NCs occur in the matrix and release some heat. The released heat is consumed in driving the steep C/A region to expand rapidly, and thus no exothermic signal was detected by the DSC test. A thermal stress about 0.15 MPa is induced by the α mismatch between the C/A region and the surroundings. When the instrument applied stress is larger than 0.15 MPa, the SCL softens significantly, but a slight expansion of the C/A region remains to exist. When the instrument applied stress is lower than 0.15 MPa, both the C/A region and the soft SCL nearby expand severely, which compensates the volume decrease due to the precipitation of Cu10Zr7 and results in a large sample expansion. Apart from the thermal stress, an open surrounding, as shown in Figure (d2), is also important to the large expansion of the the C/A region and the soft SCL nearby. Above
, however, the local surroundings become crowded with the precipitation of AlAg3 NCs. The distances between most neighboring AlAg3 NCs are 1–3 nm as shown in Figure (e2,e4), which are similar to the thickness of the C/A region, about 2 nm as indicated in Figure (a2,a3,b2,b3). With such crowded surroundings, the C/A regions for AlAg3 cannot expand freely as the C/A regions for Cu10Zr7 in the first stage, even though the C/A regions for AlAg3 may also have a large α due to the clear composition and density difference between the AlAg3 and amorphous matrix. On the other hand, the density of Cu10Zr7 is only 5% larger than the as-cast sample, while the density of AlAg3 is 19% larger than the as-cast sample. The volume decrease due to the precipitation of AlAg3 cannot be completely compensated by the expansion of the C/A region that is restricted in a limited space. Therefore, the anomalous expansion slows down in the second stage. Above
, the precipitates grow up and the amorphous matrix disappears quickly. The C/A region and the extra volume produced by its expansion are occupied by large areas of atomic rearrangement during the fast crystallization, which results in a sudden shrinkage.
Figure 6. The sketch of the microstructural evolutions behind the anomalous expansion.
The above analyses indicate that the thermal behavior of the SCL is not simple, even that it has a normal calorimetric behavior. It is very possible that the NCs precipitation with a steep C/A region can be found in other BMGs, since there are a large number of BMGs with a wide SCLR, and the NCs precipitation is actually a common phenomenon for many of them. Whether the steep C/A region can bring special physical properties other than the large expansion, is an interesting issue deserved further investigations.
5. Conclusions
In conclusion, an anomalous expansion is found occurring in the deep SCLR of the Zr47Cu37Al8Ag8 BMG, without anomalous calorimetric signals since the energy needed in expansion is compensated by the heat released in precipitation of Cu10Zr7 NCs. The anomalous expansion is mostly attributed to the NCs/amorphous matrix transition region with a steep composition and density change, which exerts a thermal stress of about 0.15 MPa to the surrounding SCL and drives the soft SCL to expand severely.
Disclosure statement
No potential conflict of interest was reported by the authors.
Additional information
Funding
References
- Schroers J. Processing of bulk metallic glass. Adv Mater. 2010;22:1566–1597. doi: 10.1002/adma.200902776
- Kato H, Chen HS, Inoue A. Relationship between thermal expansion coefficient and glass transition temperature in metallic glasses. Scripta Mater. 2008;58:1106–1109. doi: 10.1016/j.scriptamat.2008.02.006
- Chen XH, Zhang Y, Chen GL, et al. Calculations of potential functions and thermophysical behaviors for La62Al14Ni12Cu12 and Cu46Zr44Al7Y3 bulk metallic glasses. J Appl Phys. 2008;103:113506. doi: 10.1063/1.2937204
- Hu Q, Zeng XR, Fu MW. Characteristic free volumes of bulk metallic glasses: measurement and their correlation with glass-forming ability. J Appl Phys. 2011;109:053520. doi: 10.1063/1.3549819
- Hu Q, Zeng XR, Fu MW. Characteristic free volume change of bulk metallic glasses. J Appl Phys. 2012;111:083523. doi: 10.1063/1.4704688
- Jiang MQ, Naderi M, Wang YJ, et al. Thermal expansion accompanying the glass-liquid transition and crystallization. AIP Adv. 2015;5:127133. doi: 10.1063/1.4939216
- Lan S, Ren Y, Wei XY, et al. Hidden amorphous phase and reentrant supercooled liquid in Pd-Ni-P metallic glasses. Nat Commun. 2017;8:14679. doi: 10.1038/ncomms14679
- Huang XM, Wang XD, He Y, et al. Are there two glass transitions in Fe-M-Y-B (M = Mo, W, Nb) bulk metallic glasses? Scripta Mater. 2009;60:152–155. doi: 10.1016/j.scriptamat.2008.09.022
- Kumar G, Nagahama D, Ohnuma M, et al. Structural evolution in the supercooled liquid of Zr36Ti24Be40 metallic glass. Scripta Mater. 2006;54:801–805. doi: 10.1016/j.scriptamat.2005.11.019
- Park ES, Kim DH. Phase separation and enhancement of plasticity in Cu-Zr-Al-Y bulk metallic glasses. Acta Mater. 2006;54:2597–2604. doi: 10.1016/j.actamat.2005.12.020
- Li Y, Guo Q, Kalb JA, et al. Matching glass-forming ability with the density of the amorphous phase. Science. 2008;322:1816–1819. doi: 10.1126/science.1163062
- Shen TD, Harms U, Schwarz RB. Correlation between the volume change during crystallization and the thermal stability of supercooled liquids. Appl Phys Lett. 2003;83:4512–4514. doi: 10.1063/1.1631056
- Wang Q, Liu CT, Yang Y, et al. Atomic-scale structural evolution and stability of supercooled liquid of a Zr-based bulk metallic glass. Phys Rev Lett. 2011;106:215505. doi: 10.1103/PhysRevLett.106.215505
- Zhang QS, Zhang W, Inoue A. New Cu-Zr-based bulk metallic glasses with large diameters of up to 1.5 cm. Scripta Mater. 2006;55:711–713. doi: 10.1016/j.scriptamat.2006.06.024
- van den Beukel A, Sietsma J. The glass transition as a free volume related kinetic phenomenon. Acta Metall Mater. 1990;38:383–389. doi: 10.1016/0956-7151(90)90142-4
- Schroers J. On the formability of bulk metallic glass in its supercooled liquid state. Acta Mater. 2008;56:471–478. doi: 10.1016/j.actamat.2007.10.008
- Hu Q, Zeng XR, Fu MW, et al. Improvement of the thermoplastic formability of Zr65Cu17.5Ni10Al7.5 bulk metallic glass by minor addition of Erbium. Physica B. 2016;502:68–72. doi: 10.1016/j.physb.2016.08.012
- Kosiba K, Pauly S. Inductive flash-annealing of bulk metallic glasses. Sci Rep. 2017;7:2151. doi: 10.1038/s41598-017-02376-x
- Haruyama O, Inoue A. Free volume kinetics during sub-Tg structural relaxation of a bulk Pd40Ni40P20 metallic glass. Appl Phys Lett. 2006;88:131906. doi: 10.1063/1.2189833
- Schmidt V, Roesner H, Peterlechner M, et al. Quantitative measurement of density in a shear band of metallic glass monitored along its propagation direction. Phys Rev Lett. 2015;115:035501. doi: 10.1103/PhysRevLett.115.035501
- Klam HJ, Hahn H, Gleiter H. The thermal expansion of grain boundaries. Acta Metall. 1987;35:2101–2104. doi: 10.1016/0001-6160(87)90038-1
- Sui ML, Lu K. Thermal expansion behavior of nanocrystalline Ni-P alloys of different grain sizes. Nanostruct Mater. 1995;6:651–654. doi: 10.1016/0965-9773(95)00142-5
- Daniel R, Holec D, Bartosik M, et al. Size effect of thermal expansion and thermal/intrinsic stresses in nanostructured thin films: experiment and model. Acta Mater. 2011;59:6631–6645. doi: 10.1016/j.actamat.2011.07.018
- Fecht HJ. Intrinsic instability and entropy stabilization of grain boundaries. Phys Rev Lett. 1990;65:610–613. doi: 10.1103/PhysRevLett.65.610
- Ye F, Lu K. Pressure effect on polymorphous crystallization kinetics in amorphous selenium. Acta Mater. 1998;46:5965–5971. doi: 10.1016/S1359-6454(98)00240-7
- Wada T, Wang X, Kimura H, et al. Preparation of a Zr-based bulk glassy alloy foam. Scripta Mater. 2008;59:1071–1074. doi: 10.1016/j.scriptamat.2008.07.016