
ABSTRACT
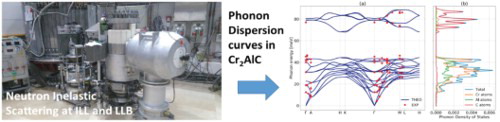
Neutron inelastic scattering is used for the first time to measure phonon dispersion branches in Cr2AlC MAX phase single crystals with appreciable size. Phonon spectra are also calculated within the Density Functional Perturbation Theory (DFPT) framework and exhibit a very good match with experimental data, including high energy carbon-related optical branches. Both experiments and ab initio simulations confirm the existence of a substantial phonon gap and discard the presence of any softening mode or possible magnetic effect.
IMPACT STATEMENT
We synthesized Cr2AlC single-crystalline platelets with areas over 10 cm2. This breakthrough in materials synthesis was a prerequisite for measuring inelastic neutron scattering and phonon anisotropies.
GRAPHICAL ABSTRACT
1. Introduction
Nanolamellar Carbides and Nitrides with formula Mn + 1AXn, also known as ‘MAX’ phases, are highly anisotropic compounds which arouse the interest of the scientific community either for their own intrinsic physical properties [Citation1] or as precursors of a new family of two-dimensional (2D) materials called MXenes [Citation2]. The latter are obtained by exfoliation of the former [Citation2]. M is a transition metal, A belongs to groups 13–16 and X is either C or N. New members of the MAX phase family are continuously added. MXenes form novel and original hydrophilic 2D electron systems. A high number of potential applications is allowed by an exceptional combination of metallic and ceramic-like properties [Citation1].
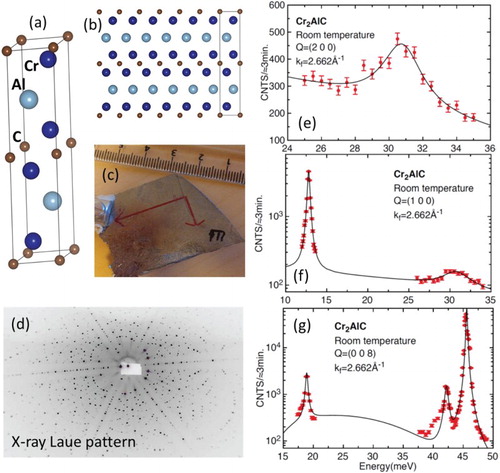
Pure MAX phases were synthesized for the first time in 1996 [Citation3], but the lack of large single crystals has long prohibited a direct assessment of the physical anisotropies expected from their crystal structure (see Figure (a,b) for Cr2AlC). Macroscopic crystals are now available [Citation4–6]. They have been used to probe magneto-transport [Citation7,Citation8] and electronic structure [Citation9]. In this letter, particularly large Cr2AlC crystals are used to determine experimentally their lattice vibration anisotropies using neutron inelastic scattering techniques.
Figure 1. (a) and (b) atomic structure of Cr2AlC (P63/mmc space group, a = 0.286 nm, c = 1.282 nm) (c) Photograph picture of a Cr2AlC single crystal used for measurements. (d) Transmission Laue diffraction pattern (the longer red axis in (c) corresponds to the horizontal direction in (d)). Crystal shape corresponds to a vertical cross section of the crucible shape and solution surface, which ultimately limit crystal expansion. (e), (f) and (g) are selected inelastic neutron scattering phonon spectra measured for scattering vector values indicated in the Figure. Lines are fits of the data with harmonic oscillator line shape. The scattering vector Q is decomposed into Q = G + q, where G is a reciprocal lattice wavevector and q is the wavevector of the excitation.
The atomic structure of MAX phases is particular because they combine in one system strong covalent MX bonds and weaker metallic MA bonds. Atomic masses may also be very different (C atoms are light in comparison with some M’s and A’s). This leads to a wide range of optical phonon energies [Citation1]. Cr2AlC is predicted to exhibit two ‘phonon bands’ (hereafter designed as B1 and B2 for the low and high energy range, respectively). They are separated by a wide phonon gap ħΔωG, almost equal to ħωmax, the upper possible value of the phonon energy in B1 [Citation10]. B1 includes both acoustic and optical branches. B2 mainly involves the vibrations of the C and Cr atoms [Citation10]. Up to now, the only direct comparison between theory and experiment was mostly restricted to Raman spectroscopy (see [Citation5,Citation11] for Cr2AlC). However, the phonon modes of B2 are not Raman active and cannot be probed by this spectroscopic method. Yet, checking the experimental values of the highest band is not of pure academic interest: we recently applied Angle Resolved Photo-Emission Spectroscopy (ARPES) to Cr2AlC single crystals and found that the ARPES signal exhibits a larger dispersion in two localized binding energy domains [Citation9]. Checking that the phonon density of states is high for the same energies could confirm the existence of a strong electron–phonon coupling, as hypothesized from previous magneto-transport data [Citation7,Citation8] and specific heat measurements [Citation1]. Besides, the predicted phonon gap is just below the limit beyond which Klemens’ [Citation12] or Ridley’s [Citation13] decay channels of the optical phonons are prohibited. Therefore, an accurate experimental assessment of the phonon energies can also shed light on the optical phonon lifetime. The phonon density of modes of two other MAX phases has already been assessed by inelastic neutron scattering measured on highly polycrystalline samples prohibiting a direct observation of anisotropy [Citation14]. Although the allocated neutron beam time was not long enough for measuring all phonon branches, an appreciable fraction of these branches were spanned, allowing for direct comparison with ab initio calculations to a much broader extent than previously achieved. In the following, both experimental findings and first-principles calculations exhibit a quite satisfying agreement, as well as with previously predicted theoretical phonon dispersion curves [Citation10].
2. Experimental and theoretical details
Single crystals were grown at LMGP from a liquid solution of composition xCr = 0.36, xAl = 0.57 and xC = 0.07. After a temperature plateau at Tmax = 1650°C during two hours to ensure carbon dissolution, crystal growth was achieved by slowly cooling down the solution from Tmax to T = 1200°C during times ranging from 5 to 7 days with an Ar pressure pAr = 1.5bar. Slow cooling aims at limiting unwanted spontaneous nucleation by putting to good use Ostwald ripening. Even though, the solidified flux usually contains more than 10 large size crystals as well as many smaller ones. A large size crystal is defined as the one whose dimensions are mainly limited by the crucible size and solution volume (see Figure (c)). Growth rate is much slower along the c-axis, resulting in a morphology with a very low aspect ratio. The areas of the platelets used here were varying from around 8–12 cm2, with a thickness limited to 1–2 mm. The c-axis is systematically perpendicular to the platelet surface. Crystal quality was first checked by X-ray Laue transmission (Figure (d)) and through neutron diffraction.
Neutron beam slit was around 4 cm × 2 cm. In the low phonon energy range (from 0 to about 40 meV), neutron inelastic scattering was performed at room temperature on the thermal neutron three-axis IN22, CRG-CEA spectrometer. The initial beam was provided by a double-focusing pyrolithic graphite (PG) monochromator [PG(0,0,2)] and the scattered beam was analyzed by a double-focusing PG analyzer [PG(0,0,2)] with fixed kf = 2.662Å−1. The sample was aligned first in the [h 0 l] direction then in the [h h l] direction. At LLB, the graphite monochromator was replaced by a Cu monochromator in order to reach the 50–100 meV energy range necessary for observing B2. Each phonon wavevector value was selected by choosing a Brillouin zone compatible with the spectrometer configuration range and an acceptable predicted intensity, as detailed in [Citation15]. For each selected value, the spectrometer configuration was varied in order to scan over an adequate energy range. Spurious resonances were eliminated by checking the configurations leading to higher order parasitic signals and accidental Bragg scattering (two such spurious points might have led to the false conclusion that a substantial phonon softening occurs around M). Due to limited beam time allowance, only some branches along three crystallographic directions: ΓM, ΓA and ML, were investigated.
The structural and vibrational properties are computed ab initio using Density Functional Theory (DFT) and Density Functional Perturbation Theory (DFPT), respectively, using the ABINIT package [Citation16,Citation17] which is based on plane-wave basis sets to represent the electronic wavefunctions. The exchange–correlation functional is approximated using the Generalized Gradient Approximation (GGA) as proposed by Perdew, Burke and Ernzerhof [Citation18]. Optimized norm-conserving Vanderbilt pseudopotentials [Citation19] are used to describe core-valence interaction. Configurations of C-2s22p2, Al-3s23p1 and Cr-3s23p63d54s1 are treated as valence electrons. A plane-wave kinetic energy cut-off of 1360 eV is determined through a careful convergence investigation. The first Brillouin zone is sampled using a 12 × 12 × 12 Monkhorst–Pack k-point grid, and a Gaussian smearing of 1mHa is used to accelerate the convergence. Phonon calculations involving the determination of the dynamical matrix are performed on a 6 × 6×6 q-point grid in the Brillouin zone. Lattice parameter optimization leads to an underestimation of the real values and thus to an overestimation of the high frequency C-related branches by roughly 10 meV. We thus fix the lattice parameters using the experimental values of Cr2AlC a = 0.286 nm and c = 1.282 nm as reported in [Citation20] (and as measured from our samples), but we fully optimize the atomic positions inside the cell until the largest force is smaller than 2.5 × 10⁻⁴ eV/Å.
3. Results and discussion
Inelastic neutron scattering phonon spectra are presented in Figure (e–g). Table lists the zone center phonon mode properties and energy values deduced from theory and experiment. Raman frequencies measured in [Citation5,Citation11] are all recovered by the neutron experiment. Those points are also reported in Figure (a), which depicts the ab initio phonon spectrum of Cr2AlC onto which the experimental points obtained from the recorded neutron scattering resonances are superimposed along three crystallographic directions: ΓM, ΓA and ML. A very reasonable agreement is obtained. Both measurements and ab initio modeling confirm the existence of a substantial phonon gap. B2 is centered around 80 meV and mainly involves the stronger Cr-C bonds (Figure (b)).
Figure 2. (a) First-principles phonon spectrum and experimental phonon energy modes of Cr2AlC along major crystallographic directions and (b) corresponding theoretical phonon density of states separated among the various atomic constituents.
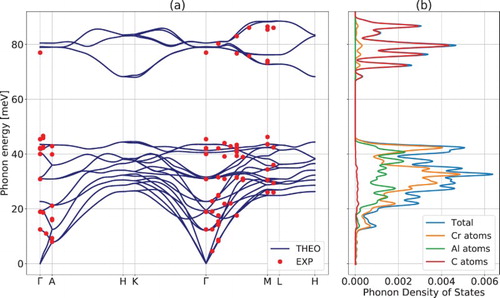
Table 1. Zone center phonon modes.
In this letter, two main goals are considered. The first one is the experimental assessment of the phonon branches in B2, combined with an interpretation of their behavior based on our DFT calculations. Figure illustrates the atoms vibrations inside a unit cell of Cr2AlC for the 6 optical branches of B2 at the zone center. Although the Al atoms do vibrate with the Cr atoms, calculations predict that their vibration amplitude is quite small in comparison with that of the C and Cr atoms and they are not practically involved in those modes. This is obviously due to the weak Cr-Al bonding strength. Al atoms are excited by the neighboring Cr atoms too far from their own natural resonant frequency and, as for a simple harmonic oscillator, they thus exhibit no appreciable vibration amplitude. Since the Al atoms stay almost immobile, everything works as if the various Cr2C planes were vibrating independently. For a phonon wavevector close to Γ, mode propagation can therefore only take place in the ab plane, and the system behaves as 2D. This is confirmed by the calculations along ΓA, ML or HK, which predict almost totally flat dispersion curves, and indicate that this analysis can even be extended away from Γ (Figure ).
Figure 3. Schematic representation of the atomic displacements for the six highest phonon energy modes at Γ. (a,c) in-plane transverse optical modes, (b,d) in-plane longitudinal optical modes and (e,f) out-of-plane transverse optical modes. The arrows (eigendisplacement X atomic mass) schematically represent the atomic displacement for the specific vibration mode.
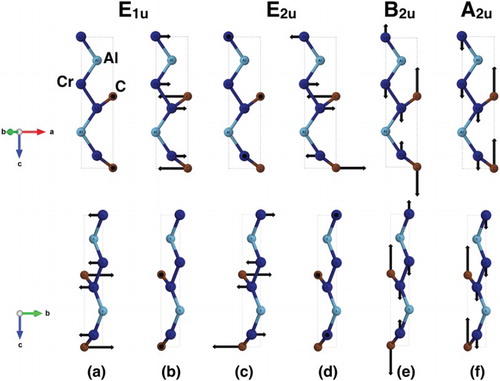
Such a situation allows us to produce a very simplified, yet meaningful analysis: limiting the system to a Cr2C plane, there are two inequivalent Cr atoms and one C atom per 2D unit cell, so that the number of inequivalent atoms is p = 3. In such a system, one expects d(p−1) optical branches, where d = 3 since d is equal to the number of possible directions of vibration (one out-of-plane and two in-plane). Therefore 6 optical branches are expected, which can be decomposed into two Transverse Optical (TO) in-plane branches, 2 Longitudinal Optical (LO) in-plane branches and 2 TO out-of-plane branches. In the present scenario, ‘in-plane’ means that the vibration takes place inside the ab plane, whereas ‘out-of-plane’ vibrations are parallel to the c-axis. The 2 out-of-plane branches are degenerate and have no reason to exhibit the same phonon energy as the four other branches; they correspond to the schematics of Figure (e–f) (highest energy branches). DFT calculations predict that those 2 upper branches remain almost degenerate whatever is the wavevector, as expected from our simplified analysis. The four remaining in-plane modes can be indexed as follows along ΓM: Figure (a–c) represent the TO in-plane modes, and Figure (b–d) correspond to the LO in-plane modes, respectively.
A second important aspect is the experimental determination of ħΔωG. If the latter exceeds twice the value of ħωmax, then all two-phonons decay processes for optical phonons lying in B2 near Γ are forbidden (from now we only consider the decay of B2 phonons). This may lead to unusually long optical phonon lifetimes, as for InN [Citation21] or HfN [Citation22], where calculations predict that ħΔωG is close to or even exceeds this threshold, inducing a substantial impact on some applications [Citation22]. Similar materials are also described in [Citation23,Citation24]. For Cr2AlC, experiment gives ħΔωG∼31.5 meV in Γ, whereas ħωmax ≅ 45.4 meV. Hence, ħΔωG is close but below the threshold. As a consequence, Klemens’ channels, where an optical phonon close to Γ decays into two phonons of half energy and opposite wavevectors [Citation12,Citation25], are possible, but limited to the upper optical branches of B1 (the possible transitions are obtained by intersecting the phonon branches of B1 with a line of energy ħ(ωmax + ΔωG)/2). Ridley’s channels consist in a decay of an optical phonon into an optical phonon and an acoustic phonon [Citation13,Citation25]. Any channel leading to a decay into two phonons pertaining to B1 imposes that the energy of any of these two phonons exceeds ħΔωG. Since no acoustic phonon exhibits an energy higher than ħΔωG (see Figure (a)), such channels are forbidden. A third channel might consist in the decay into two optical phonons of B1 [Citation25], but the phonon gap severely limits this possibility: The potentially acceptable domain is roughly restricted to an interval between 31.5 and 45 meV (see Figure (a)). Besides, the small gap appearing around Γ between 30.8 and 40.0 meV further limits the possible transitions in the same domain (see Figure (a)). Although it is not possible to draw firm conclusions about the optical phonon lifetimes, the restricted possibilities of transition might favor large values. This could be studied using, e.g. Raman spectra broadening as a function of T [Citation21]. The possibility for these observations to have a noticeable impact on electron–phonon coupling, electrical transport or heat dissipation remains to be investigated. It is worth noticing that the maxima of the phonon density of modes in B1 and B2 roughly correspond to the regions with a broader dispersion recently observed in the ARPES signal measured on similar crystals [Citation9].
The experimentally investigated acoustic branch along ΓM is in quite good agreement with theoretical predictions (Figure (a)). Sound velocities can be estimated using the ab initio phonon spectrum. Along ΓM (gradient method), vTA1 = 4.820, vTA2 = 5.216 and vLA = 7.664 km/s are obtained for the first transverse, second transverse and longitudinal acoustic modes, respectively. Along ΓK, vTA1 = 4.821, vTA2 = 5.216 and vLA = 7.664 km/s are respectively estimated. At last, along ΓA, vTA1 = 5.057, vTA2 = 5.057 and vLA =9.567 km/s, are respectively calculated. Values are typical of materials with ‘intermediate’ bonding strength. In contrast with B2, from the point of view of sound velocity, the material is almost isotropic.
4. Conclusion
The agreement between first-principles calculations and neutron inelastic scattering experiments makes us confident in the reliability of these techniques for predicting and measuring the physical properties of nano-lamellar materials such as the MAX phases. In Cr2AlC, ab initio modeling can predict the anisotropy of both the electronic structure [Citation9] and the phonon branches (this letter) with a very satisfying accuracy when compared to experiment. Our results confirm the existence of a substantial phonon gap in Cr2AlC which pushes 6 optical branches (2 TO and 2 LO in-plane, and 2 TO out-of-plane) at high energy. Although the gap is not large enough for prohibiting two-phonons decay, our result indicate that optical phonon lifetimes deserve to be further investigated.
Acknowledgments
LMGP was financially supported by the ‘Agence Nationale de la Recherche’ (project ANR-13-BS09-0024). A.C. and J.-C.C. acknowledge financial support from the Fédération Wallonie-Bruxelles through the Action de Recherche Concertée (ARC) ‘3D nanoarchitecturing of 2D crystals’ (N°16/21-077), from the European Union’s Horizon 2020 researchers and innovation programme (N°696656), and from the Belgium FNRS. T.O., A.C., and J.-C.C are also indebted to the Flag-ERA JTC 2017 project entitled ‘MORE-MXenes’. Computational resources were provided by the supercomputing facilities of the UCL (CISM) and the Consortium des Equipements de Calcul Intensif en Fédération Wallonie-Bruxelles (CECI) funded by the Fonds de la Recherche Scientifique de Belgique (F.R.S.-FNRS) under convention N°2.5020.11. PP acknowledges the support by the National Science Centre, Poland, Project N°. 2017/25/B/ST3/02586.
Disclosure statement
No potential conflict of interest was reported by the authors.
ORCID
I. Gélard http://orcid.org/0000-0003-0102-7611
Additional information
Funding
References
- Barsoum MW. MAX phases: properties of machinable ternary carbides and nitrides. Weinhem: Wiley-VCH Verlag GmbH; 2013.
- Naguib M, Kurtoglu M, Presser V, et al. Two dimensional nanocrystals produced by exfoliation of Ti3AlC2. Adv Mater. 2011;23:4248–4253. doi: 10.1002/adma.201102306
- Barsoum MW, El-Raghy T. Synthesis and characterization of a remarkable ceramic: Ti3SiC2. J Amer Cer Soc. 1996;79:1953–1956. doi: 10.1111/j.1151-2916.1996.tb08018.x
- Mercier F, Ouisse T, Chaussende D. Morphological instabilities induced by foreign particles and Ehrlich-Schwoebel effect during the two-dimensional growth of crystalline Ti3SiC2. Phys Rev B. 2011;83:075411. doi: 10.1103/PhysRevB.83.075411
- Ouisse T, Sarigiannidou E, Chaix-Pluchery O, et al. High temperature solution growth and characterization of Cr2AlC MAX phase single crystals. J Cryst Growth. 2013;384:88–95. doi: 10.1016/j.jcrysgro.2013.09.021
- Shi L, Ouisse T, Sarigiannidou E, et al. Synthesis of single crystals of V2AlC phase by high temperature solution growth and slow cooling technique. Acta Mater. 2015;83:304–309. doi: 10.1016/j.actamat.2014.10.018
- Ouisse T, Barsoum MW. Magnetotransport in the MAX phases and their 2D derivatives: MXenes. Mat Res Lett. 2017;5:365–378. doi: 10.1080/21663831.2017.1333537
- Ouisse T, Shi L, Piot B, et al. Magneto-transport properties of nearly free electrons in two-dimensional hexagonal metals and application to the Mn+1AXn phases. Phys Rev B. 2015;92:045133. doi: 10.1103/PhysRevB.92.045133
- Ito T, Pinek D, Fujita T, et al. Electronic structure of Cr2AlC as observed by angle-resolved photoemission spectroscopy. Phys Rev B. 2017;96:195168. doi: 10.1103/PhysRevB.96.195168
- Bai Y, He X, Wang R. Lattice dynamics of Al-containing MAX-phase carbides: a first-principle study. J. Raman Spectrosc. 2015;46:784–794. doi: 10.1002/jrs.4720
- Leaffer OD, Gupta S, Barsoum MW, et al. On Raman scattering from selected M2AC compounds. J Mater Res. 2007;22(10):2651–2654. doi: 10.1557/JMR.2007.0376
- Klemens G. Anharmonic decay of optical phonons. Phys Rev. 1966;148(2):845–848. doi: 10.1103/PhysRev.148.845
- Ridley BK. The LO phonon lifetime in GaN. J Phys: Condens Matter. 1996;8:L511–L513.
- Gray V, Kearley GJ, Kirstein O, et al. Mn+1AXn phonon density of states: Ti3AlC2 and Ti3SiC2 simulation and experimentation results. J Chem Chem Eng. 2015;9:253–261.
- Buhot J, Méasson MA, Gallais Y, et al. Lattice dynamics of the heavy-fermion compound URu2Si2. Phys Rev B. 2015;91:035129. doi: 10.1103/PhysRevB.91.035129
- Gonze X, Rignanese GM, Verstraete M, et al. A brief introduction to the Abinit software package. Z Kristallogr. 2005;220:558–562.
- Gonze X, Amadon B, Anglade PM, et al. ABINIT: first-principles approach to material and nanosystem properties. Comput Phys Commun. 2009;180:2582–2615. doi: 10.1016/j.cpc.2009.07.007
- Perdew JP, Burke K, Ernzerhof M. Generalized gradient approximation made simple. Phys Rev Lett. 1996;77:3865–3868. doi: 10.1103/PhysRevLett.77.3865
- Hamann DR. Optimized norm-conserving Vanderbilt pseudopotentials. Phys Rev B. 2013;88:1544. doi: 10.1103/PhysRevB.88.085117
- Jeitschko W, Nowotny H, Benesovsky F. Kohlenstoffhaltige ternäre Verbindungen (HPhase). Monatsch Chem. 1973;94:1198–1200. doi: 10.1007/BF00905710
- Domènech-Amador N, Cusco R, Artus L, et al. Raman scattering study of anharmonic phonon decay in InN. Phys Rev B. 2011;83:258. doi: 10.1103/PhysRevB.83.245203
- Chung S, Shrestha S, Wen X, et al. Evidence for a large phononic band gap leading to slow hot carrier thermalisation. IOP Conf Ser: Mater Sci Eng. 2014;68:012002. doi: 10.1088/1757-899X/68/1/012002
- Jha PK, Gupta SD, Gupta SK. Puzzling phonon dispersion curves and vibrational mode instability in superconducting MgCNi3. AIP Adv. 2012;2:022120. doi: 10.1063/1.4714366
- Tütüncü HM, Srivastava GP. Electronic structure, phonons and electron–phonon interaction in MgXNi3 (X = B, C and N). J Phys: Condens Matter. 2006;18:11089–11101.
- Barman S, Srivastava GP. Long-wavelength non equilibrium optical phonon dynamics in cubic and hexagonal semiconductors. Phys Rev B. 2004;69:659.