
ABSTRACT
A negative electrocaloric effect (ECE) in B-site non-stoichiometric (Pb0.97La0.02)(Zr0.95Ti0.05)O3 antiferroelectric ceramics synthesized by the conventional solid-state reaction method is investigated via indirect and direct measurements. Temperature-dependent P-E hysteresis loops were measured. A giant negative electrocaloric temperature change of about 12.45 K was achieved. The results indicate that the antiferroelectric ceramics with non-stoichiometry modification could be a promising candidate for the applications in cooling devices.
IMPACT STATEMENT
Giant negative electrocaloric effect (NECE) was achieved in B-site non-stoichiometric PLZT2/95/5 ceramics, the NECE parameters are comparable or even larger than most of the reported bulk materials, making it attractive for cooling devices application.
GRAPHICAL ABSTRACT
The electrocaloric effect (ECE) refers to the reversible adiabatic temperature change (ΔT) or isothermal entropy change (ΔS) of a dielectric material on the application or withdraw of an electric field [Citation1]. ECE in dielectric materials has great potential for reliable solid-state cooling device for a broad range of application such as on-chip cooling and temperature regulations for sensors, electric devices, and medical specimens. Furthermore, refrigeration based on the ECE approach is more environmental friendly and hence may also provide an alternative to the existing vapor-compression approach [Citation2]. Recently, extensive studies have been focused on caloric materials, especially electrocaloric (EC) materials for promising candidates with solid-state refrigeration application. Since a large ECE is always associated with phase transition and a larger polarization change [Citation3,Citation4], antiferroelectric ceramics are thus unequaled among all reported materials for their ultrahigh temperature changes [Citation5,Citation6].
The theoretical and experimental studies have reve-aled that there exist two ECEs, including the positive and negative effects in various FE/AFE bulk and film systems [Citation7–10]. Ponomareva and Lisenkov [Citation7] predicted that a negative adiabatic temperature change was found in Ba0.5Sr0.5TiO3 alloys. Then, the negative ECE was observed in Pb(Mg1/3Nb2/3)O3-PbTiO3 single crystals [Citation9]. Specifically, it is expected that a negative ECE could be used in practical promising applications such as cooling devices, where the sign of negative ΔT and ΔS values are achieved. In order to get better ECE, most of the scholars put their focus on thin films that can bear greater electric field. For example, the negative ECE was reported in a La-doped Pb(Zr,Ti)O3 film [Citation11], in Hf0.5Zr0.5O2 thin films [Citation12] and in Eu-doped AFE PbZrO3 thin films [Citation13]. Thin films have the advantage on the application in small solid-state cooling devices, but the bulk materials are essential to the middle- and large-scale devices, such as refrigeration [Citation14,Citation15]. Moreover, the EC strength and the practical cooling capacity of thin films are still weaker than that of the bulk counterpart, including single crystals and ceramics. Hence, research on bulk ECE materials is of great more importance.
In this study, the ECE of non-stoichiometry PLZT2/95/5 antiferroelectric ceramics were firstly investigated as a function of the electric field and temperature. A giant negative ECE calculated from hysteresis loops was achieved about −12.45 K (ΔTmax) via indirect methods. This work reports our discovery of giant negative ECE values, which was significantly highest than that of ferroelectric ceramics reported so far, which could be further developed into ECE cooling devices.
(Pb0.97La0.02)(Zr0.95Ti0.05)1+yO3 (y = −0.03, −0.01, 0.01, 0.03) ceramics were successfully fabricated by via a mixed-oxide route. Raw materials of PbO, TiO2, ZrO2, and La2O3 were weighed according to the formula (Pb0.97La0.02)(Zr0.95Ti0.05)1+yO3 in the required stoichiometry with 5 wt% excess PbO. Precursor oxides were mixed by ball milling in ethanol for 24 h, then dried and presintered at 850°C in an alumina crucible for 5 h. After re-milled and dried, the calcined fine powder with 5 wt% PVA as a binder was cold pressed into cylindrical pellets of size 12 mm diameter and 1–2 mm thickness using a hydraulic press. The ceramics were fabricated by sintering at 1250°C for 5 h. In order to avoid the vaporization, PbO atmosphere for the sintering was maintained using Pb(Zr0.95Ti0.05)O3 as spacer powder.
Ceramic samples were polished to the thickness of 0.8 mm for the measurement of electrical properties. Both sides of samples were electroded with silver paste and sintered at 650°C for 2 h. The crystal structure and orientation of the ceramic samples were characterized by using an X-ray diffractometer (XRD, D/MAX 2200 VPC, Rigaku, Japan) with working current and voltage of 20 mA and 36 kV, respectively. The bias electric field and temperature dependence of dielectric and impedance properties were measured by Agilent E4980A in the temperature range of 26–650°C with the heating rate of 3°C/min. The polarization-electric field (P-E) loops were characterized by Radiant Technologies’ Precision premier II (Albuquerque, NM) over the temperature range of 30–240°C. The density of all the ceramics was measured using Archimedes methods. Heat flow analysis of these ceramics was conducted by a differential scanning calorimeter (DSC8000, USA). Each temperature point was reached at 10°C/min heating/cooling rate.
Figure represents the XRD patterns of the (Pb0.97La0.02)(Zr0.95Ti0.05)1+yO3 (PLZT2/95/5) (y = −0.03, −0.01, 0.01, and 0.03) ceramics measured at room temperature. It can be seen that perovskite phase of PLZT is predominant for all the samples after final sintering at 1250°C for 5 h. The peaks were observed to shift to lower angles with decreasing y values. The shift implies a contraction of the unit cell, which should be related to the formation of cation and oxygen vacancies [Citation16].
Figure 1. XRD patterns of (Pb0.97La0.02)(Zr0.95Ti0.05)1+yO3 (PLZT2/95/5) (y = −0.03–0.03) ceramics measured at room temperature.
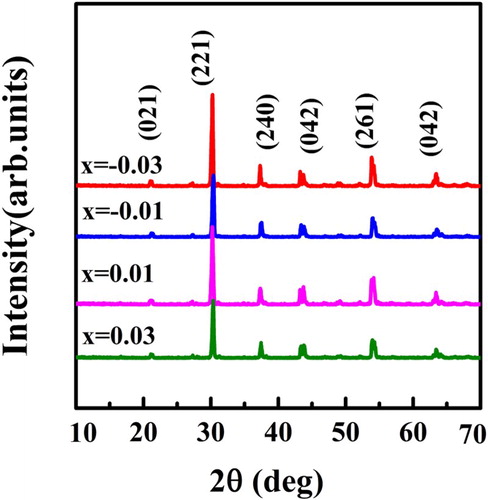
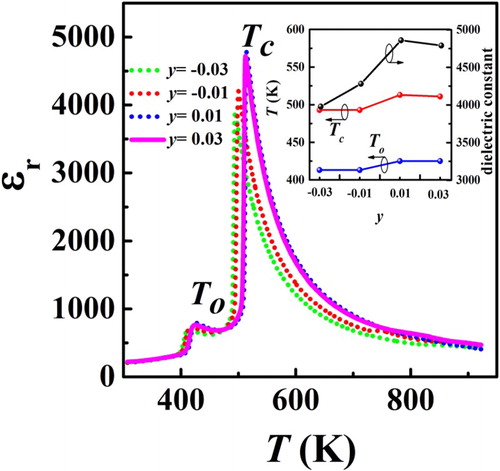
Figure gives the temperature-dependent dielectric permittivity (ϵγ) of PLZT2/95/5 ceramics with different non-stoichiometry content, which are tested at 10 kHz on heating process. Obviously, all the samples exhibit the parallel curves features of the relative permittivity and two anomalous peaks could be seen. Starting from room temperature on heating, the dielectric constant shows the Curie–Weiss type increase to To, probably indicating the antiferroelectric-to-ferroelectric (AFE-FE) transition temperature, and an additional increase to Tc, which denotes the temperature of FE to paraelectric (PE) phase transition. It is also worth mentioning that from the inset, one can both the temperatures corresponding to the anomalous peak are almost equal when the y values are −0.03 and −0.01. Likewise, it appears similar when the y values are 0.01 and 0.03. However, both To and Tc present a rising trend with the y values increasing from −0.03 to 0.03. Recent studies have suggested that the commonly observed dielectric anomalies around Tc are related to the thermal evolution of polar nanoregions (PNRs) with different structural symmetry [Citation16]. The maximum dielectric constant for y = −0.03, −0.01, 0.01, and 0.03 is 3980, 4280, 4860, and 4790, respectively. Generally, the dielectric constant of AFEs material has a close relationship with the AFE phase, and higher stability of AFE phase usually leads to lower dielectric [Citation17].
Figure 2. The temperature dependence of dielectric constant (ϵr) and inset of the To, Tc, and maximum dielectric constant of the PLZT2/95/5 ceramics at 10 kHz.
In order to evaluate the ECE of the PLZT ceramics, the polarization-electric field (P-E) hysteresis loops at 10 Hz were measured at a serious of temperatures with a 10 K interval. For all samples, the P-E loops were recorded under the applied electric field of 50 kV/cm from 303 K to 493 K during the heating process. Typical P-E hysteresis loops for all ceramics are shown in Figure . At room temperature, a linear P-E loop is achieved, which suggests orthorhombic AFE phase behavior. Generally, only linear P-E loops rather double P-E loops were obtained in the orthorhombic AFE phase. This is because the critical electric field, which induces the orthorhombic AFE to orthorhombic FE phase transition, is higher than the breakdown field of PLZT sample [Citation18]. Moreover, the temperature played an important role in defining the shape of P-E loops. From Figure , double hysteresis loops, signifying the antiferroelectric state, could be seen only at higher temperatures (about 463 K) in all ceramics, which was attributed to the free energy barrier between FE and AFE with the rising temperature [Citation19]. Notably, there was no obvious FE single P-E loops above To, which may be resulted from the weak ferroelectricity as reported in typical antiferroelectric PbZrO3 [Citation20]. Above Tc, a PE-like hysteresis loop is obtained. On the whole, these P-E loops given attest the phase transition on heating following the AFE→FE→PE sequence, which agrees with temperature-dependent dielectric properties.
Figure 3. P-E hysteresis loops recorded at different temperatures under 50 kV/cm :(a) y = −0.03, (b) y = −0.01, (c) y = 0.01, and (d) y = 0.03. The inset of (a)–(d) shows the corresponding evolution of polarization versus temperatures of the PLZT2/95/5 ceramics under various electric fields.
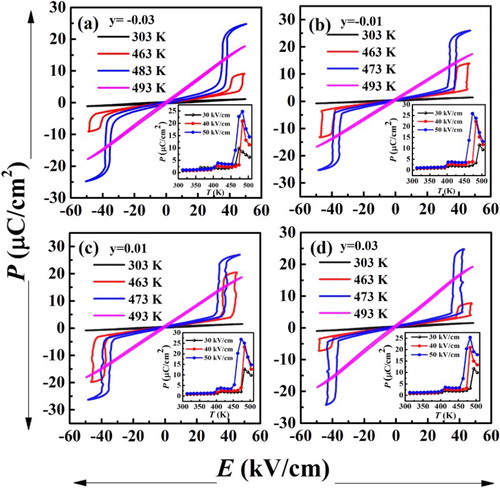
The polarization measurement, therefore, confirms the similar phase transition sequences in those ceramics. The temperature dependence of polarization under different electric fields was shown in the inset of Figure . Clearly, as E increases, the break polarization is shifted to lower temperatures. Polarization at different fields was calculated using the upper branches of the hysteresis loops as stated by Xu et al. [Citation3]. Two anomalies in the P-T cures could be seen. When the temperature reaches To, the polarization first increases and then decreases. On further heating above To, the polarization reached a peak value at Tc. The rising polarization near phase transition may generate negative ECEs. Reversible adiabatic temperature change ΔT and isothermal entropy ΔS due to an applied electric field E, for a material of density ρ with specific heat capacity Cp is given as follows:
(1)
(2)
where P is the polarization, E1 and E2 are the starting and final applied fields, respectively. The values of
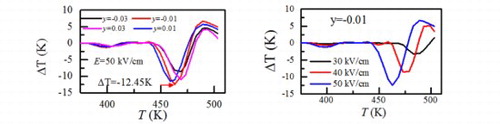
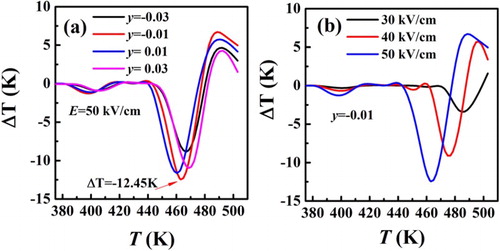
were obtained from P versus T data by fitting a fourth order polynomial. The density ρ for each sample, measured by Archimedes’s principle, are 6.88, 6.91, 7.0, and 6.88 g/cm3 for the ceramic with y = −0.03, −0.01, 0.01, and 0.03, respectively. The heat capacity Cp, shown in Figure S2 in the Supplemental material, is assumed to be a constant within the measurement temperature window and is taken to be 0.40, 0.30, 0.32, and 0.32 JK−1 g−1 for y = −0.03, −0.01, 0.01, and 0.03, respectively. Temperature-dependent adiabatic temperature changes ΔT calculated at an electric field of 50 kV/cm are presented in Figure (a). As expected, two negative electrocaloric responses are achieved in the PLZT ceramics. Also, the coexistence of positive and negative electrocaloric effect has been found. From Figure (a), around To, negative ΔT = −0.89, −1.09, −1.03, and −0.89 K and giant negative ECE ΔT = −8.12, −12.45, −11.14, and −9.70 K near Tc respectively for y = −0.03, −0.01, 0.01, and 0.01 were obtained. Moreover, the positive ECE ΔT = 4.61, 6.34, 5.64, and 4.25 K near Tc were found, respectively for y = −0.03, −0.01, 0.01, and 0.01. Obviously, electric field plays a key role in ECE, and higher electric fields will induce larger ECE. Taking the sample y = −0.01 for instance, shown in Figure (b), when the electric field increases, temperatures corresponding to the peak positions of ΔT(ΔTECmax) shift toward the lower temperatures, answering for that as the electric field is increased, the break polarization is shifted to minor temperatures. Values of ΔTECmax also increased from −1.95 K (30 kV/cm) to −8.12 K (50 kV/cm), −3.24 K (30 kV/cm) to −12.45 K (50 kV/cm), −3.44 K (30 kV/cm) to −11.14 K (50 kV/cm), −3.16 K (30 kV/cm) to −8.90 K (50 kV/cm), respectively for y = −0.03, −0.01, 0.01, and 0.01 ceramics. Undoubtedly, the huge negative ECE achieved in this work has far surpassed recent reports in PbZrO3 ceramics (−1.5 K), (Pb0.88Sr0.08)(Nb0.08(Zr0.53Ti0.47)0.92)O3 ceramics (0.65 and −0.38 K), Na0.5Bi0.5TiO3-BaTiO3 ceramics (−0.33 K) and 0.91Pb(Zn1/3Nb2/3)O3-0.09PbTiO3 single crystals (0.9 K) [Citation20–23]. The significant enhancement in the electrocaloric properties is beneficial for design of solid-state cooling devices with high cooling efficiency.
Figure 4. (a) Temperature-dependent adiabatic temperature changes ΔT and in PLZT2/95/5 ceramics under 50 kV/cm with different compositions. (b)Temperature-dependent adiabatic temperature changes ΔT in PLZT2/95/5 ceramic with y = −0.01 under different electric fields.
The mechanism underlying the negative ECE is still controversial. Most of the current thermodynamic theories focus on the AFE phase transition induced by external stimuli, such as electric fields, temperature, and mechanical stresses. Zhou et al. [Citation18] used a modified phenomenological Landau-type model to give a quantitative explanation to the negative electrocaloric effects, which is consistent with our results. Phenomenological Landau-type modeling suggests distinct minima exist for the AFE nonpolar state (B) and the FE ordered state (A or A’). At low temperatures, the AFE nonpolar state is very stable due to the lower energy state. In this case, there is not enough kinetic energy to overcome the energy barrier in the double wells. For the low-temperature AFE phase, the induced polarization can be enhanced at higher temperatures. The nonzero electric field induced polarization is very small. With increasing temperature to To, the ferroelectric order has a deeper local energy minimum. However, the shallow minimum of the AFE nonpolar state would, from thermal fluctuations, result in a transition to the FE ordered state and be stuck in the deeper energy well. Therefore, a thermally excited path going from B to A’ is feasible. When applying an electric field to the system, the underlying potentials will become asymmetric. There is a significant increase in the magnitude of polarization due to the AFE-to-FE phase transition, resulting in a negative ECE at around To. Additionally, the polarization will decrease sharply when the temperature is above Tc, leading to a positive EC response.
Furthermore, we have also supplemented the work of ECE-directed test to validate the ΔT values. Figure S1. in the Supplemental material show ΔT of (Pb0.97La0.02)(Zr0.95Ti0.05)0.99O3 ceramics via direct methods. We got the ΔT valve 1.7 K near room temperature with the electric field of 40 kV/cm. Unfortunately, due to the limitations of the test equipment, we could not measure the ΔT in high temperatures.
In summary, the ECE of antiferroelectric (Pb0.97La0.02)(Zr0.95Ti0.05)1+yO3 ceramics is investigated via the indirect and direct method. The microstructures, dielectric and phase properties of the samples were also investigated and discussed in connection with the ECE results. Hysteresis loops denote the observable phase transition of AFE, FE, and PE behavior with the increasing external temperature. An expression based on reversible thermodynamics is used to determine the ΔT-T relation, demonstrating a giant negative ECE in non-stoichiometric PLZT ceramics with y = −0.01, which reveals peaks in both ΔT = −12.45 K around 463 K, and a considerable result ΔT = 1.7 K near room temperature was achieved via the direct test method.
Supplemental Material
Download MS Word (360.1 KB)Disclosure statement
No potential conflict of interest was reported by the authors.
Additional information
Funding
Related Research Data
References
- Zhuo F, Li Q, Gao J, et al. Coexistence of multiple positive and negative electrocaloric responses in (Pb, La)(Zr, Sn, Ti)O3 single crystal. Appl Phys Lett. 2016;108: 082904, 1–5. doi: 10.1063/1.4941816
- Ramesh G, Ramachandra Rao MS, Sivasubramanian V, et al. Electrocaloric effect in (1−x)PIN-xPT relaxor ferroelectrics. J Alloys Compd. 2016;663:444–448. doi: 10.1016/j.jallcom.2015.11.028
- Xu Z, Fan Z, Liu X, et al. Impact of phase transition sequence on the electrocaloric effect in Pb(Nb,Zr,Sn,Ti)O3 ceramics. Appl Phys Lett. 2017;110: 082901, 1–4.
- Lu B, Li P, Tang Z, et al. Large electrocaloric effect in relaxor ferroelectric and antiferroelectric lanthanum doped lead zirconate titanate ceramics. Sci Rep. 2017;7: 45335, 1–8. doi: 10.1038/s41598-016-0028-x
- Aly Hamad M. Detecting giant electrocaloric effect in SrxBa1−xNb2O6 single crystals. Appl Phys Lett. 2012;100: 192908, 1–4. doi: 10.1063/1.4718350
- Hao X, Zhai J. Electric-field tunable electrocaloric effects from phase transition between antiferroelectric and ferroelectric phase. Appl Phys Lett. 2014;104: 022902, 1–4.
- Ponomareva I, Lisenkov S. Bridging the macroscopic and atomistic descriptions of the electrocaloric effect. Phys Rev Lett. 2012;108:167604, 1–5.
- Li B, Wang JB, Zhong XL, et al. The coexistence of the negative and positive electrocaloric effect in ferroelectric thin films for solid-state refrigeration. Europhys Lett. 2013;102: 47004, 1–5.
- Peräntie J, Hagberg J, Uusimäki A, et al. Electric-field-induced dielectric and temperature changes in a <011>-oriented Pb(Mg1/3Nb2/3)O3—PbTiO3 single crystal. Phys Rev B. 2010;82: 134119, 1–8. doi: 10.1103/PhysRevB.82.134119
- Uddin S, Zheng GP, Iqbal Y, et al. Unification of the negative electrocaloric effect in Bi1/2Na1/2TiO3-BaTiO3 solid solutions by Ba1/2Sr1/2TiO3 doping. J Appl Phys. 2013;114: 213519, 1–8. doi: 10.1063/1.4842935
- Geng W, Liu Y, Meng X, et al. Giant negative electrocaloric effect in antiferroelectric La-doped Pb(ZrTi)O3 thin films near room temperature. Adv Mater. 2015;27:3165–3169. doi: 10.1002/adma.201501100
- Park MH, Kim HJ, Kim YJ, et al. Giant negative electrocaloric effects of Hf0.5Zr0.5O2 thin films. Adv Mater. 2016;28:7956–7961. doi: 10.1002/adma.201602787
- Ye M, Li T, Sun Q, et al. A giant negative electrocaloric effect in Eu-doped PbZrO3 thin films. J Mater Chem C. 2016;4:3375–3378. doi: 10.1039/C6TC00218H
- Liu Y, Dkhil B, Defay E. Spatially resolved imaging of electrocaloric effect and the resultant heat flux in multilayer capacitors. ACS Energy Lett. 2016;1:521–528. doi: 10.1021/acsenergylett.6b00232
- Valant M, Axelsson AK, Le Goupil F, et al. Electrocaloric temperature change constrained by the dielectric strength. Mater Chem Phys. 2012;136:277–280. doi: 10.1016/j.matchemphys.2012.08.059
- Qiao XS, Chen XM, Lian HL, et al. Dielectric, ferroelectric, piezoelectric properties and impedance analysis of nonstoichiometric (Bi0.5Na0.5)0.94+ xBa0.06Ti0.03 ceramics. J Eur Ceram Soc. 2016;36:3995–4001. doi: 10.1016/j.jeurceramsoc.2016.06.032
- Wang X, Shen J, Yang T, et al. Phase transition and energy storage performance in Ba-doped PLZST antiferroelectric ceramics. J Mater Sci: Mater. Electron. 2015;26:9200–9204.
- Zhou F, Li Q, Yan QF, et al. Temperature induced phase transformations and negative electriccaloric effect in (Pb,La)(Zr,Sn,Ti)O3 antiferroelectric single crystal. J Appl Phys. 2017;122: 154101, 1–10.
- Bharadwaja SSN, Krupanidhi SB. Backward switching phenomenon from field forced ferroelectric to antiferroelectric phases in antiferroelectric thin films. J Appl Phys. 2001;89:4541–4547. doi: 10.1063/1.1331659
- Dai X, Li JF, Viehland D. Weak ferroelectricity in antiferroelectric lead zirconate. Phys Rev B. 1995;51:2651–2655. doi: 10.1103/PhysRevB.51.2651
- Pirc R, Rožič B, Koruza J, et al. Negative electrocaloric effect in antiferroelectric PbZrO3. Europhys Lett. 2014;107: 17002, 1–5. doi: 10.1209/0295-5075/107/17002
- Chen C, Liang R, Liu Z, et al. Coexistence of negative and positive electrocaloric effect in Sr and Nb co-doped Pb(Zr,Ti)O3 ferroelectric ceramics. Mater Lett. 2017;189:303–306. doi: 10.1016/j.matlet.2016.11.006
- Bai Y, Zheng GP, Shi SQ, et al. Abnormal electrocaloric effect of Na0.5Bi0.5TiO3–BaTiO3 lead-free ferroelectric ceramics above room temperature. Mater Res Bull. 2011;46:1866–1869. doi: 10.1016/j.materresbull.2011.07.038