
ABSTRACT
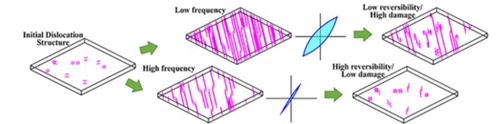
High-frequency testing (HFT) is useful for accelerated fatigue testing of conventional materials that typically serve under low-frequency loading conditions, as well as for the assessment of the robustness of microelectromechanical systems which typically experience high-frequency service conditions. Using discrete dislocation dynamics, we attempt to elucidate the effect of loading frequency on the reversibility of cyclic deformation. We demonstrate that the HFT induces a higher fraction of reversible cyclic deformation because of a larger portion of elastic/anelastic deformation due to limited dislocation mobility, and a higher degree of reversibility in plastic deformation owing to the less occurrence of cross-slip.
IMPACT STATEMENT
Dislocation-based frequency effects on high-cycle deformation reversibility in metals are elucidated. Hysteresis energy is shown to dissipate even under ideal, damage-free conditions, contrary to popular assumptions of energy-based fatigue models.
GRAPHICAL ABSTRACT
1. Introduction
High-frequency testing (HFT)—including ultrasonic fatigue testing (UFT, with a frequency as high as 20 kHz) and megahertz frequency testing (MFT, with a frequency of several, tens, or hundreds of MHz) [Citation1–6]—are among the accelerated testing techniques currently being applied to evaluate fatigue lives/strength beyond the Giga-cycle regime. MFT, in particular, routinely provides a means to assess the robustness of microelectromechanical structures (MEMS). However, research shows that, due to variation in the imposed cyclic strain rate, the effect of loading frequency on the deformation behavior of materials, as observed in the UFT, is strongly material dependent [Citation5,Citation7,Citation8], owing to the distinct dislocation core structures in different crystal structures.
In principle, the motion of dislocations, regardless of the crystal structures, is always thermally activated [Citation9]. The dislocations in BCC exhibit strong non-planar core structure. Therefore, their motion—which is associated with high lattice friction and high activation energy—exhibit strong rate dependence. Under UFT, the time allowed for dislocation relaxation in BCC materials is limited, and a large portion of the total strain is accommodated by elastic or anelastic [Citation10] deformation [Citation11]. As a result, the effect of frequency on the fatigue behavior of BCC materials observed from UFT is noticeably higher than that of the FCC materials [Citation5]. Since the plastic strain rate () is related to the velocity (
) and density (
) of the mobile dislocations on slip system i [Citation12,Citation13], i.e.
(1)
Limited by the mobility of dislocations, if the density of the mobile dislocations is low, more time is required for dislocation structure to fully relax (i.e. to achieve the same amount of plastic deformation), and the frequency dependence is expected to be more pronounced. Therefore, the frequency dependence of fatigue strength and cyclic life is expected to manifest even in FCC materials with low mobile dislocation densities.
In addition, the rate dependent cross-slip does not have sufficient time to occur during UFT (∼20 kHz) and MFT (∼100 MHz). As a result, plastic deformation at these frequencies is more ‘reversible’Footnote1 [Citation14,Citation15] than in lower frequency (<20 Hz) testing. In other words, the to-and-fro motions of screw dislocations between walls, loop patches, or within cells [Citation16] are less likely to be affected by cross-slip frequencies, so that much less debris/traces are left behind in the form of immobile dislocations. Therefore, the damage induced by the HFT is expected to be considerably smaller than the one from the conventional low-frequency testing, even though the hysteresis energy might be the same. Energy-based fatigue damage models typically assume that a given material, under a specific load level, can only sustain a critical amount of cumulative plastic deformation energy before it fails [Citation17–19]. Hence, plastic deformation energy in each cycle (hysteresis energy, ) is often used as the damage parameter to establish the critical total hysteresis energy (
). Such models, with appropriate modifications [Citation17,Citation20], perform reasonably well for specimens under variable loading amplitudes. However, their accuracy maybe debatable when significantly higher frequencies are introduced, due to the aforementioned rate-dependent damage mechanics.
In this work, using interface dislocation dynamics (IDD) [Citation21], we attempt to elucidate the two issues mentioned above: (1) the effect of loading frequency (and the imposed cyclic strain rate) as well as the mobile dislocation density on the hysteresis response; (2) the effect of loading frequency (and the imposed cyclic strain rate) on the accumulation of immobile dislocation density. Both issues pertain to the reversibility [Citation14,Citation15] of deformation during cyclic loading as impacted by potentially high-/ultrahigh- loading frequency, which, in principle, should be independent of the material system utilized. Higher fractions of reversible cyclic deformation can potentially be achieved during HFT via an increased percentage of elastic/anelastic [Citation10] deformation or reversible plastic deformation [Citation14,Citation15] per loading cycle.
2. Methods
The IDD model used in this work is developed from the parametric dislocation dynamics (PDD) code described in Ref. [Citation22]. We use Al as a model system (), with isotropic elastic assumption with the following materials constants: lattice parameter a = 4.05 Å, Young’s modulus E = 70.74 GPa, shear modulus μ = 26.2 GPa, and Poisson’s ratio ν = 0.35. Due to the high stacking fault energy in Al, Shockley partial dislocations and stacking faults are not explicitly treated. Limited by the time scale of the dislocation dynamics simulations [Citation21,Citation23], strain rates of and
(a difference of only a factor of 5) are used to study the effect of loading frequency.
Figure 1. Initial dislocation structure for cases of high (a: 1.75 × 10¹³ m−2) and low (b: 0.35 × 10¹³ m−2) initial dislocation densities. The crystallographic orientations are given in the figure. The dislocation walls are represented using blue shades. The dashed lines with green arrows denote the direction on which the shear strain is applied. The dash-dot lines show the directions on which the dislocations propagate.
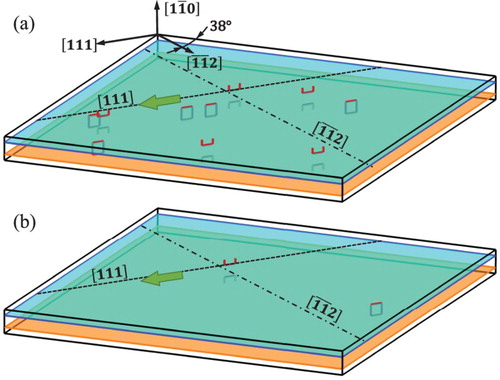
When the cyclic deformation is saturated, a regularly spaced dislocation wall structure, known as persistent slip band (PSB), forms and dominates the cyclic plastic deformation by localized shear deformation [Citation16,Citation24–26]. Therefore, we consider the localized deformation behavior of a well-developed dislocation wall structure during tension-compression cyclic loading by subjecting the simulation cell to a fully reversed pure shear loading condition () with a triangle wave loading profile. Typical dislocation wall structure comprises pure-edge dislocation dipole walls bounding the gliding screw dislocations (known as runner dislocations, or runners) in between [Citation16,Citation24–26]. The theoretical treatment of the saturation stress associated with the dipole wall typically ignore the discrete dislocation structure within the walls and only consider the bowing and passing stress of screw dislocations [Citation25,Citation27]. The long-range stress posed by the walls, in the case of strong external constraint as specified by Ref. [Citation26], can be treated by the superposition of a piece-wise uniform stress field inside the channels. As shown by Ref. [Citation26], the long-range stress only acts to moderately reduce the resolved shear stress on the primary slip planes (their traces on the PSB wall are marked by dash-dotted lines in ) in the channels. As a result, the net forces acting on the runner dislocations along the primary slip planes may be reduced overall, slightly decreasing the velocities of dislocations. However, since the long-range stress do not produce an out-of-plane force components, the rate of cross-slip events is not affected.
In this work, we model the walls as featureless plane entities that are impenetrable to gliding dislocations (, cyan and orange planes) [Citation21]. Runner dislocations move within the channels in a threading fashion, akin to multilayered composites [Citation28]. The size of the computational cell is 1.10μm × 1.04μm × 0.07μm. The resulting spacing between the walls is 35 nm, this being approximately an order of magnitude smaller than the typical wall spacing [Citation5,Citation16], which is applied to reduce computational cost. This discrepancy in the wall spacing between IDD and experiment, although results in an increase in flow stress, is not expected to impact effect of loading frequency on the cyclic behavior. In effect, the behavior of dislocations is very much similar to those propagating within thin coatings on a substrate [Citation29,Citation30] or within a multilayered metal composites [Citation21,Citation31]. The applied pure shear strain amplitude in the simulations is Δεshear/2 = 1.3%, which translates to a strain amplitude of Δε/2 = 2.6% in a tension-compression test (assuming that the walls are 45° with the loading axis). This relatively large strain is applied to simulate the localized shear deformation in the PSB or dislocation wall structure. As is well known that the local shear strain amplitude in PSBs is around 1%, regardless of the imposed plastic strain amplitude [Citation26,Citation32,Citation33]. The loading frequencies are 312.5 MHz and 62.5 MHz which falls within the megahertz frequency range of fatigue experiments [Citation4]. In addition, it is important to note that the simulations performed in this work do not explicitly consider the effect of temperature and we assume that the temperature of the samples is well controlled during the high-/ultrahigh- frequency fatigue experiments.
The effects of cross-slip are considered phenomenologically, assuming that the primary slip planes (dash-dotted lines in ) in a PSB are perfectly aligned with a maximum shear plane and that the Burgers vector is aligned with the maximum shear direction. The cross-slip events are modeled only to avoid obstacles (i.e. like-signed dislocations considered in this work) or facilitate annihilation. Once an obstacle is avoided, the net force acting on a screw segment is expected to be mostly parallel to the slip plane again. Therefore, another cross-slip event, shifting the screw runner back to its original slip plane immediately follows. When two ‘runner dislocations’ approach each other, force components perpendicular to the primary slip plane arise due to their mutual interaction, which is apparently a function of their proximity. The probability of the cross-slip events is dependent on the effective force act on the dislocation segment pointing on a secondary slip plane. The following probabilistic equation is typically followed in the numerical implementation of cross-slip in dislocation dynamics [Citation34–37]:
(2)
where A0 is a normalization factor, τ* is the critical athermal resolved shear stress for cross-slip, τ is the actual resolved shear stress on a particular slip system, V is the activation volume and D0 is the length of a screw dislocation segment. Note that τb gives the force acting on the dislocation segment resolved onto a specific plane. In our simulations, all dislocation segments propagating in the channels are of the same length and of the same Burgers vector. Therefore, the only factor that determines the probability of cross slip is the force component pointing away from the current slip plane. For simplicity, in the current work the cross-slip is modeled by periodically picking a runner dislocation with the largest Peach-Koehler (PK) force component acting perpendicular to the current slip planes. This process is modeled in this work following the procedure below:
At every 0.4 ns,Footnote2 the components of Peach-Koehler (PK) force acting on each screw runner dislocations normal to their current slip planes are evaluated, i.e.
, where
The screw dislocation with the largest PK force acting normal to its slip plane is picked;
The picked dislocation is then shifted normal to its slip plane along the PK force by a small distance (17.5 nm is used in this work); and
Classical dislocation dynamics is performed for the next 0.4 ns interval.
Table 1. Details of the five IDD simulations performed.
3. Results and discussions
The effect of the strain rate as well as mobile dislocation density is clearly demonstrated by the hysteresis loops shown in (a). Under the lower frequency of 62.5 MHz (Simulation #3), the dislocations have more time to propagate, resulting in a higher cyclic plastic strain as well as a more ‘relaxed’ dislocation structure (see supplementary videos). The change in the density of the wall dislocations (Δρwall) induced by the runner screw dislocations can be as high as 1.70 × 10¹⁵ /m2 (, red dash double dot curve). Note that the IDD simulations consider plastic deformation within well-developed wall structures so that the dislocation density generated in these simulations should be considered as the ‘change’ in the overall density of the wall structures. On the other hand, under a higher frequency of 312.5 MHz (Simulation #1), dislocations have less time to propagate (see supplementary videos). The change in the wall dislocation density is significantly smaller than for Simulation #3 (solid blue curve in ). As a result, a higher fraction of the total strain is accommodated by elastic or anelastic deformation, which, in turn, leads to hardening (solid blue loop in (a)). The hysteresis energy associated with the higher frequency simulations is significantly smaller than the one for lower frequency ones (compare the areas enclosed by the hysteresis loops). In this sense, the reversibility of the cyclic deformation, associated with the reversible elastic deformation, increases with increasing loading frequency, leading to less fatigue damage.
Figure 2. Hysteresis responses of the IDD simulations shown by the normalized shear stress (τ/μ) vs. normalized shear strain () curves: (a) demonstrates the effect of loading frequency as well as mobile dislocation density, and (b) demonstrates the effect of the loading frequency as well as the effect of cross-slip events.
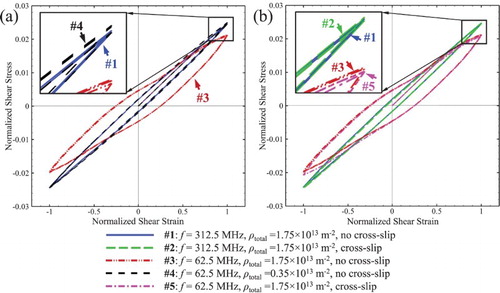
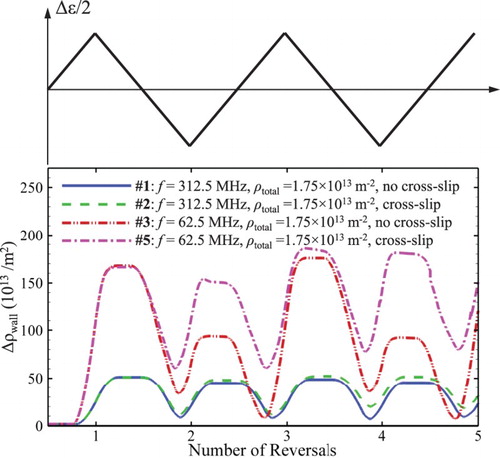
Figure 3. The change in the density of wall dislocations (Δρwall) as a function of the number of reversals. The loading profile is overlaid on the top of the figure.
The same reduction in hysteresis energy can also be observed even without changing the loading frequency and only by varying the mobile dislocation density. Consider two dislocation configurations with different mobile dislocation densities (Simulation #3 vs. Simulation #4). According to Equation 1, in order for the two structures to achieve the same plastic strain rate (), the ‘mean velocity’ for dislocations in the structure with lower mobile dislocation density (Simulation #4) would need to be significantly higher than for the case with higher mobile dislocation density (Simulation #3), i.e.
. Since dislocations’ motion is limited by phonon drag (i.e. F/L = Bv, where B is the drag coefficient [Citation9]), the dislocation structure in Simulation #4 cannot sustain the same amount of plastic strain as Simulation #3. Therefore, a stiffer stress–strain response and a higher fraction of elastic strain is witness in Simulation #4. This results in a significantly smaller hysteresis energy associated with the black dashed loops compared to the red dash-dot loops in (a). Supplementary videos show, due to the lower mobile dislocation density, Simulation #4 develops significantly less plastic deformation (evidenced by the dislocation deposited in the ‘walls’) than Simulation #3.
The occurrence of cross-slip events may either be promoted or suppressed, depending on the different amount of time allowed during the cyclic deformation, which is affected by loading frequency (i.e. cyclic strain rate). As a result of such events, the trajectory of the screw runner dislocations is altered. Although during reverse loading the plastic strain stored during the forward loading is reverted, the backward motion of the dislocations leaves debris on the dislocations wall, which indicates the cyclic plastic strain is not reversible. Such an irreversible cyclic plastic strain leads to accumulated fatigue damage, and, since it is related to rate-dependent events, is not well correlated with the cumulated hysteresis energy. To investigate this phenomenon, the cross-slip events are treated phenomenologically as a constant rate event, which occurs every 0.4 ns. The cross-slip has been applied to both Simulations #2 and #5. As shown in (b), within the 2 cycles or so simulated by IDD, the impact of the cross-slip events on the hysteresis behavior is insignificant. Over a large number of cycles, however, the following can be expected. (1) Through the cross-slip events, the screw dislocations may annihilate which reduces the population of mobile dislocations and leads to cyclic hardening. The cyclic hardening, in turn, may stimulate the bow-out of dislocations from the wall forming new runner dislocations, which may balance the overall mobile dislocation density. (2) The debris left behind by the runner dislocations may increase local Burgers content of the wall, which generates local rises of back stress, increase in the wall dislocation density, and overall cyclic hardening.
The cross-slip can lead to a significant change in the evolution of wall dislocation densities (in , compare magenta dash-dot curve with the red dash-double-dot curve, also compare green dashed curve with the blue solid curve). Under the higher frequency, the total occurrences of the rate dependent cross-slip events are considerably less than under the lower frequency. As a result, the increase in the dislocation wall density is much more pronounced in the lower frequency simulation. The provided supplemental videos offer a direct comparison of the evolution of dislocation structures with and without the cross slip enabled.
An interesting observation can be made on the asymmetry in the evolution of wall dislocation density during the odd and even number of load reversals that exists in Simulations #1 and #3 (), although it is less pronounced for Simulation #1. For instance, the peak Δρwall for Simulation 3 reaches up to 1.7 × 10¹⁵ /m2 during the odd reversals, but only 1.0 × 10¹⁵ /m2. This alternation is inherent to the initial conditions of our simulations. In this work, we only considered the change in dislocation density in the walls (Δρwall) using the initial configurations (as shown in ) as references. During the first load reversal (and the subsequent odd number of reversals) and above certain critical strains the dislocations first propagate extensively and deposit onto the walls, which accounts for the initial increases in the dislocation density. However, during the even number of reversals, the wall dislocations that have been extensively deposited in the odd reversals need to retract before they can be deposited in the opposite directions. This accounts for the asymmetry in the evolution in the dislocation densities shown in for both Simulation #1 and Simulation #3, although the asymmetry for the former is less pronounced. Note that Simulation #1 and Simulation #3 have the same initial conditions. The difference in the extent of this asymmetry is ascribed to two reasons: (1) the shorter time scale in Simulation #1 allowed for less distances for ‘runner’ dislocations to travel and less chance for their mutual short range interactions; (2) the higher stress levels in Simulation #1 enabled dislocations to easily overcome relatively weak mutual interactions. Therefore, for Simulation #1, the diminished effect of mutual interactions among the runner dislocations leads to a higher degree of symmetry in the evolution of dislocation density during the odd and even reversals. The inverse is true for Simulation #3, where the more pronounced mutual interaction among runner dislocations dictates that the retraction of wall dislocations (during the even cycles) are hindered, which gives rise to a higher degree of asymmetry in the evolution of dislocation density. On the other hand, due to the effect of cross-slip, the asymmetry is much less pronounced in Simulations #2 and #5.
4. Concluding remarks
Although this work only probed five total reversals, important observations and conclusions can be made from the IDD simulations. Indeed, the fact that a material exhibits substantial hysteresis energy without accumulating damage and that the cross-slip events do not lead to an apparent change in the hysteresis behavior but lead to substantial damage (evidenced by the change in the wall dislocation density) is remarkable. Conventional energy based fatigue damage theories associate fatigue damage with hysteresis energy and tend to ignore the explicit treatment of damage accumulation mechanism. As a result, the fatigue life of a material that is less susceptible to fatigue damages due to materials design and/or due to high loading frequencies, such as the ones demonstrated by Simulations #1, #2 and #5, may be significantly underestimated. In fact, a hypothetical scenario as shown by Simulation #5, where the associated theoretical fatigue life is infinite, would be predicted to possess a finite life by the energy-based fatigue damage theories.
Finally, it needs to be emphasized that although the simulations are carried out in the frequency regime MFT, our results are very relevant to the high-/ultrahigh- frequency tests. The phenomenon observed in (a) on the frequency’s effect on the hysteresis energy is essentially dependent on the mobility and the density of the mobile dislocations with respect to the strain rate (frequency and strain amplitude dependent) of the cyclic loading. In the experiments, this phenomenon is less significant for FCC materials exposed to UFT due to the higher dislocation mobility in such materials. Conversely, the rate sensitively for BCC materials in the UFT is significant. We further argue that in higher frequency cyclic loading conditions, such as those applied to MEMS materials [Citation4], even the FCC may show a significant amount of frequency sensitivity.
5. Conclusion
In this work, using the discrete interface dislocation dynamics, we offer insight into two very relevant issues regarding the high- and ultrahigh- frequency fatigue testing pertaining to the reversibility of cyclic deformations. We conclude that under high-/ultrahigh- frequency testing, the deformations are more likely to be reversible. The increased reversibility is ascribed to two reasons: (1) high-frequency testing typically yields higher fractions of elastic and anelastic deformations because of the limited mobility of dislocations; (2) hence, higher frequency testing may inhibit the occurrence of cross-slip events and lead to a substantially higher fraction of reversible plastic deformations.
Case_5.avi
Download Microsoft Video (AVI) (9.9 MB)Case_4.avi
Download Microsoft Video (AVI) (17.4 MB)Case_3.avi
Download Microsoft Video (AVI) (17.5 MB)Case_2.avi
Download Microsoft Video (AVI) (3.7 MB)Case_1.avi
Download Microsoft Video (AVI) (3.7 MB)Acknowledgements
The support provided by the U.S. National Science Foundation (NSF OIA-1541079) and the Louisiana State Board of Regents (LEQSF(2013-16)-RD-B-01) is acknowledged. The support provided by the Office of Research and Economic Development and the Department of Mechanical and Industrial Engineering, Louisiana State University is greatly appreciated. This work was performed, in part, at the Center for Integrated Nanotechnologies, an Office of Science User Facility operated for the U.S. Department of Energy (DOE) Office of Science. Los Alamos National Laboratory, an affirmative action equal opportunity employer, is operated by Los Alamos National Security, LLC, for the National Nuclear Security Administration of the U.S. Department of Energy under contract DE-AC52-06NA25396.
Disclosure statement
No potential conflict of interest was reported by the authors.
Additional information
Funding
Notes
1 Quotation marks are used here to signify the reversible nature of plastic deformation during high-frequency cyclic loading. In monotonic loading, plastic deformation is commonly perceived to be irreversible after unloading. In cylic loading under low frequencies, as will be demonstrated in this paper, are not truly reversible since wall dislocations are left behind.
2 In reality, the time scale of the cross-slip event is sensitive to temperature but generally varies from a fraction to several nanoseconds, which agrees with the cross-slip time scale considered in our simulations. For instance, it has been demonstrated that the time scale for annihilation of two screw dipoles in Cu due to cross-slip is from ∼0.005 ns to ∼5 ns, over a temperature range of 225K to 375K [37].
Related Research Data
References
- Bathias C. Piezoelectric fatigue testing machines and devices. Int J Fatigue. 2006;28:1438–1445. doi: 10.1016/j.ijfatigue.2005.09.020
- Ebara R. The present situation and future problems in ultrasonic fatigue testing – mainly reviewed on environmental effects and materials’ screening. Int J Fatigue. 2006;28:1465–1470. doi: 10.1016/j.ijfatigue.2005.04.019
- MacDonald DE. Ultrasonic frequency metal fatigue: a review of the investigations of the institute for the study of fatigue fracture and structural reliability. Eng Fract Mech. 1976;8:17–29. doi: 10.1016/0013-7944(76)90074-6
- Muhlstein C, Brown S. Reliability and fatigue testing of MEMS. Tribol Issues Oppor. MEMS. 1997;519–528. Available from: http://link.springer.com/chapter/10.1007/978-94-011-5050-7_38.
- Mayer H. Fatigue crack growth and threshold measurements at very high frequencies. Int Mater Rev. 1999;44:1–34. doi: 10.1179/imr.1999.44.1.1
- Granato A, Lücke K. Application of dislocation theory to internal friction phenomena at high frequencies. J Appl Phys. 1956;27:789–805. doi: 10.1063/1.1722485
- Wang QY, Berard JY, Dubarre A, et al. Gigacycle fatigue of ferrous alloys. Fatigue Fract Eng Mater Struct. 1999;22:667–672. doi: 10.1046/j.1460-2695.1999.t01-1-00185.x
- Po G, Cui Y, Rivera D, et al. A phenomenological dislocation mobility law for bcc metals. Acta Mater. 2016;119:123–135. Available from: http://linkinghub.elsevier.com/retrieve/pii/S1359645416305948. doi: 10.1016/j.actamat.2016.08.016
- Hirth JP, Lothe J. Theory of dislocations. 2nd ed. Malabar (FL): Krieger Publishing Company; 1982.
- Arechabaleta Z, Van Liempt P, Sietsma J. Quantification of dislocation structures from anelastic deformation behaviour. Acta Mater. 2016;115:314–323. doi: 10.1016/j.actamat.2016.05.040
- Tsutsumi N, Murakami Y, Doquet V. Effect of test frequency on fatigue strength of low carbon steel. Fatigue Fract Eng Mater Struct. 2009;32:473–483. Available from: http://doi.wiley.com/10.1111/j.1460-2695.2009.01350.x
- Zbib HM, Diaz de la Rubia T, Bulatov V. A multiscale model of plasticity based on discrete dislocation dynamics. J Eng Mater Technol. 2002;124:78. Available from: http://materialstechnology.asmedigitalcollection.asme.org/article.aspx?articleid=1426646. doi: 10.1115/1.1421351
- Zbib HM, Diaz de la Rubia T. A multiscale model of plasticity. Int J Plast. 2002;18:1133–1163. Available from: http://linkinghub.elsevier.com/retrieve/pii/S0749641901000444. doi: 10.1016/S0749-6419(01)00044-4
- Sleeswyk AW, James MR, Plantinga DH, et al. Reversible strain in cyclic plastic deformation. Acta Metall. 1978;26:1265–1271. doi: 10.1016/0001-6160(78)90011-1
- Baudry G, McLean D, Pineau A. Estimating the reversibility of plastic strain during fatigue with the martensitic transformation. Scr Metall. 1977;11:987–989. Available from: http://linkinghub.elsevier.com/retrieve/pii/0036974877902526 doi: 10.1016/0036-9748(77)90252-6
- Kuhlmann-Wilsdorf D. Theory of plastic deformation: - properties of low energy dislocation structures. Mater Sci Eng A. 1989;113:1–41. doi: 10.1016/0921-5093(89)90290-6
- Fatemi A, Yang L. Cumulative fatigue damage and life prediction theories: a survey of the state of the art for homogeneous materials. Int J Fatigue. 1998;20:9–34. Available from: http://linkinghub.elsevier.com/retrieve/pii/S0142112397000819. doi: 10.1016/S0142-1123(97)00081-9
- Shrestha R, Simsiriwong J, Shamsaei N, et al. Cyclic deformation and fatigue behavior of polyether ether ketone (PEEK). Int J Fatigue. 2016;82:411–427. Available from: http://linkinghub.elsevier.com/retrieve/pii/S0142941816305244 doi: 10.1016/j.ijfatigue.2015.08.022
- Mahtabi MJ, Shamsaei N. A modified energy-based approach for fatigue life prediction of superelastic NiTi in presence of tensile mean strain and stress. Int J Mech Sci. 2016;117:321–333. doi: 10.1016/j.ijmecsci.2016.08.012
- Shrestha R, Simsiriwong J, Shamsaei N. Fatigue modeling for a thermoplastic polymer under mean strain and variable amplitude loadings. Int J Fatigue. 2017;100:429–443. doi: 10.1016/j.ijfatigue.2017.03.047
- Wang J, Zhou C, Beyerlein IJIJ, et al. Modeling interface-dominated mechanical behavior of nanolayered crystalline composites. JOM. 2014;66:102–113. Available from: http://link.springer.com/10.1007/s11837-013-0808-8
- Ghoniem N, Tong S-H, Sun L. Parametric dislocation dynamics: a thermodynamics-based approach to investigations of mesoscopic plastic deformation. Phys Rev B. 2000;61:913–927. doi: 10.1103/PhysRevB.61.913
- Huang S, Wang J, Zhou C. Effect of plastic incompatibility on the strain hardening behavior of Al-TiN nanolayered composites. Mater Sci Eng A. 2015;636:430–433. doi: 10.1016/j.msea.2015.04.013
- Zhu Y, Chapman SJ. Motion of screw segments in the early stage of fatigue testing. Mater Sci Eng A. 2014;589:132–139. Available from: http://linkinghub.elsevier.com/retrieve/pii/S0921509313010642 doi: 10.1016/j.msea.2013.09.079
- Kubin L, Sauzay M. Persistent slip bands: the bowing and passing model revisited. Acta Mater. 2017;132:517–524. doi: 10.1016/j.actamat.2017.04.064
- Mughrabi H. Dislocation wall and cell structures and long-range internal stresses in deformed metal crystals. Acta Metall. 1983;31:1367–1379. doi: 10.1016/0001-6160(83)90007-X
- Brown LM. Dislocation bowing and passing in persistent slip bands. Philos Mag. 2006;86:4055–4068. doi: 10.1080/14786430500501689
- Li N, Wang J, Misra A, et al. Direct observations of confined layer slip in Cu/Nb multilayers. Microsc Microanal. 2012;18:1155–1162. doi: 10.1017/S143192761200133X
- Nicola L, Van der Giessen E, Needleman A. Discrete dislocation analysis of size effects in thin films. J Appl Phys. 2003;93:5920–5928. Available from: http://aip.scitation.org/doi/10.1063/1.1566471.
- Davoudi KM, Nicola L, Vlassak JJ. Bauschinger effect in thin metal films: discrete dislocation dynamics study. J Appl Phys. 2014;115:013507. Available from: http://aip.scitation.org/doi/10.1063/1.4861147.
- Shao S, Misra A, Huang H, et al. Micro-scale modeling of interface-dominated mechanical behavior. J Mater Sci. 2017;53:5546–5561. Available from: http://link.springer.com/10.1007/s10853-017-1662-9.
- Winter AT. A model for the fatigue of copper at low plastic strain amplitudes. Philos Mag. 1974;30:719–738. Available from: http://www.tandfonline.com/doi/abs/10.1080/14786437408207230.
- Finney JM, Laird C. Strain localization in cyclic deformation of copper single crystals. Philos Mag. 1975;31:339–366. Available from: http://www.tandfonline.com/doi/abs/10.1080/14786437508228937
- Wang ZQ, Beyerlein IJ, LeSar R. The importance of cross-slip in high-rate deformation. Model Simul Mater Sci Eng. 2007;15:675–690. Available from: http://stacks.iop.org/0965-0393/15/i=6/a=006?key=crossref.8b9d6c7ed1156d3379cb5349d3db63f9. doi: 10.1088/0965-0393/15/6/006
- Bonneville J, Escaig B, Martin J. A study of cross-slip activation parameters in pure copper. Acta Metall. 1988;36:1989–2002. Available from: http://linkinghub.elsevier.com/retrieve/pii/000161608890301X.
- Rhee M, Zbib HM, Hirth JP, et al. Models for long-/short-range interactions and cross slip in 3D dislocation simulation of BCC single crystals. Model Simul Mater Sci Eng. 1998; 6:467–492. Available from: http://iopscience.iop.org/0965-0393/6/4/012. doi: 10.1088/0965-0393/6/4/012
- Vegge T, Rasmussen T, Leffers T, et al. Determination of the of rate cross slip of screw dislocations. Phys Rev Lett. 2000;85:3866–3869. Available from: https://link.aps.org/doi/10.1103/PhysRevLett.85.3866.