
 ?Mathematical formulae have been encoded as MathML and are displayed in this HTML version using MathJax in order to improve their display. Uncheck the box to turn MathJax off. This feature requires Javascript. Click on a formula to zoom.
ABSTRACT
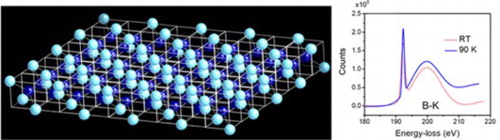
We present 1D, 2D and 3D structures of boron-doped Q-carbon with a higher superconducting transition temperature than the current value of 55 K in 25 at% B-doped amorphous Q-carbon. The higher transition temperature is predicted for 1D and 2D crystalline structures with increasing density of states near the Fermi level through dopant trapping in substitutional sites. We have synthesized 50at% B-doped Q-carbon where diamond tetrahedra are arranged randomly and packed with over 80% efficiency to generate an amorphous structure. Detailed EELS measurements show higher density of states near the Fermi level above 90 K and preliminary transport data show signature of Tc above 100 K.
GRAPHICAL ABSTRACT
IMPACT STATEMENT
Novel 1D, 2D and 3D structures of boron-doped Q-carbon with higher Tc than current BCS record of 55K by increasing B-concentration and the density of states near the Fermi level.
Introduction
The phenomenon of superconductivity has intrigued the scientific community ever since the discovery of superconducting transition temperature of 4.2 K in mercury by Kamerlingh Onnes in 1911 [Citation1,Citation2]. It took a long time to develop a fundamental theory of superconductivity. In 1957, a rather complete theory of superconductivity was proposed by Bardeen, Cooper and Schrieffer to relate superconducting transition temperature Tc directly with Debye temperature, density of states near the Fermi level and electron–phonon interaction [Citation3]. Thus, the BCS theory provided a rather clear, albeit challenging, path for increasing Tc by enhancing Debye temperature, density of states near the Fermi level and electron–phonon interaction. It should be mentioned that oxide-based high-temperature superconductors are considered non-BCS, and detailed mechanisms of high-temperature superconductivity in these materials are still being debated [Citation4,Citation5].
The BCS theory directly relates superconducting transition temperature Tc with Debye temperature ΘD and density of states near the Fermi level (N(0)) and carrier (electron or hole) interaction potential V by Tc = ΘD exp [−1/N(0) V]. Here N(0) V = λ–μ*, where λ is electron–phonon coupling constant and μ* is a ‘renormalized’ Coulomb repulsion with a value of ∼0.10–0.12. Since the Debye temperature ΘD for diamond is by far the highest 2250 K, compared to 443 K for graphite and 276 K for niobium, the search for high-temperature superconductivity in diamond-related materials has generated a tremendous interest [Citation6,Citation7]. So far the highest Tc in B-doped diamond was 11 K [Citation8], which was limited by the equilibrium thermodynamic solubility limit of boron concentration of 2.0 at% B. Further enhancement in Tc is expected with increasing boron concentration into substitutional sites far beyond the thermodynamic solubility limit. To achieve higher dopant concentrations beyond the thermodynamic solubility limit, we need highly nonequilibrium methods to enhance the density of states and electron–phonon coupling. This challenge has been addressed by our discovery of melting of carbon by nanosecond lasers and quenching to form Q-carbon or diamond [Citation9–14], depending upon the degree of undercooling. Both Q-carbon and diamond can be doped far beyond the thermodynamic solubility limit by the phenomenon of solute trapping during rapid quenching. When as-deposited B-doped carbon layers are melted, carbon atoms are closely packed because of metallic bonding in molten carbon. During quenching, B-doped tetrahedra are packed randomly to form distinct polyamorphic phases [Citation12]. Higher B concentration in crystalline diamond produces internal strains which are not conducive to high-temperature superconductivity. The internal strains in B-doped amorphous Q-carbon do not affect adversely high-temperature superconductivity as they do in crystalline diamond [Citation7].
We have shown that distinct phases of B-doped Q-carbon can be formed when B-doped and undoped diamond tetrahedra are packed randomly. By changing the ratio of doped to undoped tetrahedra, distinct phases of B-doped Q-carbon with concentration varying from 5.0% to 50.0% can be synthesized [Citation12]. So far we have created experimentally three distinct phases of amorphous B-doped Q-carbon, which exhibit record BCS high-temperature superconductivity. The first phase has B-concentration ∼17% with superconducting transition temperature (Tc) =37 K (named QB1) [Citation9], the second phase has B-concentration ∼25% with Tc = 56 K (named QB2) [Citation10], and the third phase has B-concentration ∼50% with Tc expected over 100 K (named QB3) [Citation12,Citation13]. The previous BCS high-Tc record was held by MgB2 at 39 K [Citation15]. Our experimental results on high-temperature superconductivity in QB phases [Citation9,Citation10] have been verified theoretically by Cohen’s group [Citation11]. From geometrical modeling, we derived that the QB1 consists of randomly packed three-unit tetrahedra, where one out of every three tetrahedral contains B atom in the center and B is sp3 bonded to four carbon atoms. The QB2 consists of randomly packed two-unit tetrahedra, where one out of every two tetrahedra contains B atom in the center and B atom is sp3 bonded to four carbon atoms. The QB3 phase is formed when all of the tetrahedra contain B atoms in the center, and these B atoms are sp3 bonded to four carbon atoms. These tetrahedra can be packed randomly with a packing efficiency of about 80% [Citation16].
Here, our search for near RT superconductivity has focused on the following three (1D, 2D, and 3D) B-doped Q-carbon structures. These structures are formed by arranging diamond tetrahedra in one-dimension (1D nanorod) and in two-dimension (2D nanosheet), where both of these structures are crystalline. When diamond tetrahedra are packed randomly, we create the 3D amorphous structure (QB3 Phase). These novel B-doped Q-carbon structures have been formed by nanosecond laser melting of amorphous carbon on substrates like sapphire. The formation of Q-carbon as well as diamond requires quenching of molten carbon from a highly undercooled state. The optimization of thin film, substrate and laser variables is required to achieve the novel phase of Q-carbon or diamond. This optimization is carried out using laser–solid interaction simulation and controlling the bonding characteristics of as-deposited carbon films [Citation17]. We present detailed high-resolution TEM and EELS (electron energy loss spectroscopy) results in the QB3 phase related to dopant spatial distribution and bonding characteristics of B and C atoms. These results on structure, B concentration and sp3/sp2 bonding are correlated with high-temperature superconducting properties. The density of states near the Fermi level are mapped by EELS as a function of temperature below and above Tc. One of the critical aspects to achieve high-temperature superconductivity following BCS theory is to increase the density of states near the Fermi level which will enhance the Tc through strong electron–phonon coupling. This aspect was clearly demonstrated in our earlier reports for QB1 [Citation9] and QB2 [Citation10]. Our preliminary calculations of density of states and the Eliashberg function using Quantum Espresso indicate a much higher superconducting transition temperature in these B-doped one-dimensional and two-dimensional Q-diamond nanostructures, and the three-dimensional QB3 amorphous structure.
Results and discussion
Atomic structure of high Tc phases
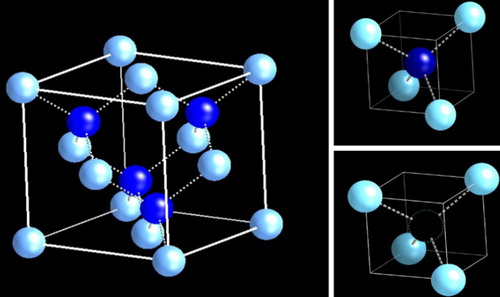
The standard diamond unit cell consists of two types tetrahedra D1 and D2 (as shown in Figure (a)), which are contained in one-eighth (a/2,a/2,a/2) of the diamond unit cell. The D1 with the central atom (Figure (b)) and D2 (Figure (c)) with missing central atom alternate, and four D1 and four D2 make the standard diamond unit cell. It is interesting to note that while the diamond cubic lattice (with two interpenetrating FCC lattices) has the highest number density of atoms (1.76 × 2023 cm−3), it has the lowest atomic packing fraction (APF = 34%) than conventional structures, such as simple cubic (SC 54%), body centered cubic (BCC 68%), and face-centered cubic (FCC 74%). This is primarily derived from smaller size carbon atoms. This leaves some exciting possibilities to enhance the number density of atoms and create new structures and materials with unique properties.
Figure 1. Standard diamond cubic unit cell consisting of two interpenetrating FCC lattices displaced by a/4, a/4, a/4 with D1 (tetrahedron with central atom) and D2 (tetrahedron with missing central atom) subunit cells.
Our experimental results on the atomic structure (through electron diffraction) and bonding characteristics have shown the formation of three distinct phases of amorphous B-doped Q-carbon with discrete boron concentration of 17%, 25% and 50%. These were named as QB1, QB2, and QB3, respectively. This provided the first direct evidence of polyamorphism in Q-carbon based materials, formed by nanosecond laser melting and rapid quenching of carbon layers. By repeating/arranging the D1 subunit cell with boron atom in the center of the tetrahedron, we created a new phase of B-doped Q-carbon. The tetrahedra can be packed with an efficiency exceeding 80–85%. This structure corresponds to B concentration, close to 50at% B, which has been named as the QB3 phase. Two D1 subunit cells can join with 90° rotation to form the D12 subunit cell (Figure (a)). When one of the tetrahedra in D12 contains a B atom in the center and these D12 units are packed randomly, we form the QB2 phase. Similarly, three D1 subunit cells can join in the x- and y-directions and create the D13 subunit cell (Figure (b)). When one of the tetrahedra in D13 contains a B atom in the center and these D13 units are packed randomly, we form the QB1 phase. By replacing B by C, it is possible to form Q1, Q2, and Q3 phases of pure and undoped Q-carbon, corresponding to QB1, QB2, and QB3 phases of B-doped Q-carbon.
Figure 2. (a) D12 subunit cell consisting of two D1 subunit cells rotated 900with respect to each other; (b) D13 subunit cell with three D1 subunit cells added both in x- and y- directions; and (c) formation Q-diamond crystalline nanorod by the addition of D1 into D12 in x- or y-direction.
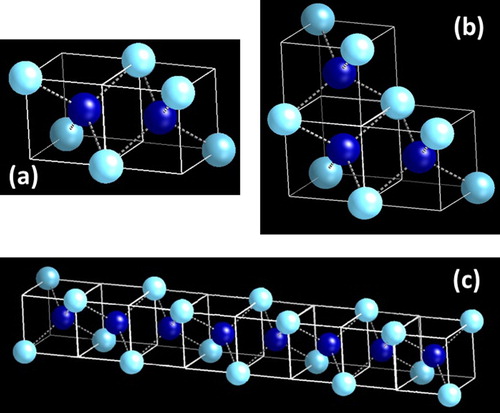
By adding D1 to the D12 subunit cell (shown in Figure (a)) in one-dimension, it is possible to form crystalline Q-diamond nanorod (Figure (c)), which can have very high density of states near the Fermi energy. These density of states can be filled by doping with boron. By replacing the central carbon atom with boron in each of these tetrahedra, these nanostructures can be doped to a concentration of 50 at%. By replacing the central carbon atom with boron in alternate tetrahedra, these nanostructures can be doped to a concentration of 25 at%.
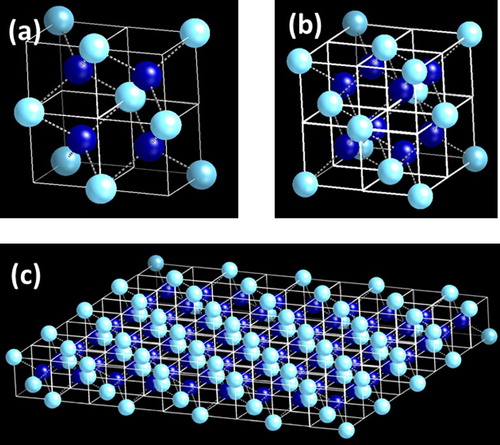
By adding D1 in D12 subunit cell in x-, y- and z-directions, the crystalline Q-diamond unit cell is formed, as shown in Figure (b). This unit cell cannot be repeated systematically as face atoms are already four-fold coordinated. However, it can be repeated along the diagonal edges (leaving periodic holes) or in a quasicrystalline way, where faces do not touch. When four of D1 subunit cells are put together through 90° rotation, we create the D14 sub unit cell (as shown in Figure (a)). When D14 subunit cells are grown by adding D1 in the x–y two-dimension plane, we create a nanosheet, as shown in Figure (c). The density of states in two-dimensional nanosheets is constant and independent of energy, but very high. These density of states can be filled by boron doping, where these nanosheets can be doped with boron by replacing one, two, three or all four central carbon atoms in the D14 sub unit cell. Our preliminary calculations of density of states and the Eliashberg function using Quantum Espresso indicate a much higher superconducting transition temperature in these B-doped one-dimensional and two-dimensional Q-diamond nanostructures.
Figure 3. (a) Formation of D14 by addition of four D1 subunit cells in x- and y-directions; (b) Q-diamond crystalline unit cell consisting of eight D1 subunit cells which are rotated 90° with respect to each other. This unit cell has eight atoms inside with eight corners and six face atoms; and (c) Formation Q-diamond crystalline nanosheet by the addition of D1 into D14 in both x- and y-directions.
High temperature superconductivity in QB3 (B-concentration ∼50% with Tc >100 K)
We have created the QB3 phase with 50% at B concentration in Q-carbon with expected superconducting transition over 100 K. The QB3 phase consists of randomly packed tetrahedra, where every tetrahedron contains B atom in the center which is sp3 bonded to four carbon atoms. We have carried out a quantitative study of the shallow electronic states in B-doped Q-carbon to understand the mechanism of high-temperature superconductivity. Detailed high-resolution TEM and EELS (electron energy loss spectroscopy) results on dopant spatial distribution, bonding characteristics, and density of states near the Fermi level are presented for the QB3 phase. These results on the structure, B concentration and sp3/sp2 bonding are correlated with high-temperature superconducting properties. One of the critical aspects to achieve high-temperature superconductivity following BCS theory is to increase the density of states near Fermi level which will enhance the Tc through strong electron–phonon coupling. Detailed imaging and EELS (electron energy loss spectroscopy) results on dopant distribution and bonding characteristics are presented for the QB3 phase in Figure . These results on the structure, B concentration and sp3/sp2 bonding are correlated with high-temperature superconducting properties.
Figure 4. (a) HAADF cross-section showing the formation of distinct phases of QB2, QB3 and B (at a lower magnification) on sapphire substrate: (b) HAADF cross-section image at a higher magnification showing atomically sharp interfaces between QB2, QB3 and B phases; and (c) B–K and C–K edges in the EELS spectrum, from which B and C concentrations are estimates as 45 ± 3 at% and 55 ± 3 at%, respectively.
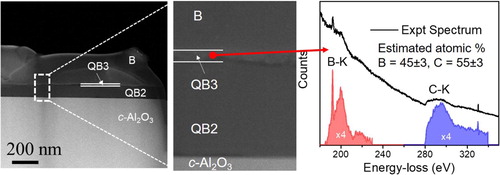
A high-angle annular dark field (HAADF) image of B-doped Q-carbon on the c-Al2O3 substrate is shown in Figure (a), which is formed by nanosecond pulsed laser melting and subsequent quenching of the B/C multilayered film in the superundercooled state. The nanostructure constitutes of B-doped Q-carbon (QB2 and QB3) phases along with an overlayer of B. As indicated in Figure (a), the QB3 phase is formed as an interposing layer between the QB2 phase and excess B that zone-refined during the formation of B-doped Q-carbon phases. A magnified image of the region is shown in Figure (b), which illustrates the formation of 5 nm thick distinct layer of the QB3 phase over the QB2 phase. It is noteworthy that this layer is distinct with atomically sharp interface, indicating a unique entropy and structure presumably with higher Tc. The representative EEL spectrum from QB3 phase are shown in Figure (c) along with the extracted B-K (188 eV) (in red) and C-K (284 eV) (in blue) edge spectra after background subtraction. From the EELS analysis, the concentration of B in the QB3 phase is determined to be ∼45 ± 3 at%, whereas it is ∼27 ± 3 at% in the QB2 phase. The quantification was performed after removing plural scattering effects from the spectra, introduced by specimen thickness.
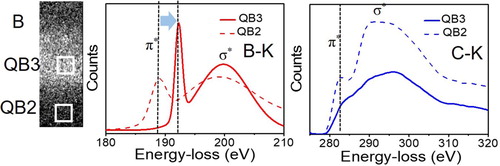
The energy loss near edge structure (ELNES) of B–K and C–K edge in QB3 (solid line) are shown in Figure , and are compared with that in the QB2 phase (dotted line). The sp3 fraction of C in QB3 is estimated to be ∼78% as compared to ∼71% in the QB2 phase. It is apparent that the ELNES characteristics of B-K (Figure (a)) and C–K (Figure (b)) are drastically different and energetically shifted in the QB3 phase. As shown in Figure (a), the EEL spectrum of B–K in QB3 exhibits a characteristic excited state of π* and σ* at 192.9 and 200 eV (peak maxima), respectively. While σ* energy position in Q-carbon phases (Figure (b)) remains almost unchanged, a significant energy-shift is observed in the π* energy peak from 188.6 eV in QB2 to 192.9 eV in QB3. Similarly, an overall intensity of π* and σ* peaks in C-K of the QB3 phase is distinctly decreased as compared to that of the QB2 phase, while having no peak energy-shift. This significant shift in the π* peak in B suggests that B is present only in the sp3 state in the QB3 phase, and it clearly reflects a cumulative change in the local environment of B atoms present at the center of C tetrahedra. Overall, this phase is expected to exhibit Tc above 100 K, due to the significant change in the local environment of B atoms in Q-carbon.
Figure 5. Energy loss near edge structure (ELNES) of B–K edge (Figure (a)) and C–K edge (Figure (b)) for QB2 and QB3 phases.
We further conducted cryo-EELS (∼90 K) to analyze the changes, if occurring, in the near-edge structures in B and C K-edges (B-K at 188 eV and C-K 284 eV) in the QB3 phase as compared to those at room-temperature (RT) EELS. The EELS experiments are performed in an STEM, equipped with a monochromatic electron probe (∼200 meV FWHM) and cryo-stage. The background subtracted EELS K-edges of B and C in the QB3 phase of B-doped Q-carbon at 90 K and RT are shown in Figure (a,b), respectively. The EELS data are denoised by fitting the overall spectrum with various Gaussian profiles and keeping the noise in the spectrum equivalent to that in the background. The figure clearly illustrates a sharp increase in the π* peak intensity at 192.9 eV in the B-K of the QB-3 phase, as well as an overall increase in the σ* peak intensity. Similar results were observed in the C–K edge where π* peak becomes sharper and well-distinguished at 90 K as compared to that at RT. These results show an enhancement in the density of states in the QB3 phase below Tc which is estimated to be over 100 K. The sharpening of the peaks below Tc in the QB3 takes place due to the superconductivity, where electron density is dramatically increased in the unoccupied energy states. Similar studies performed on the QB2 phase with Tc = 55 K, show no observable difference between the EELS spectra at 90 K and RT. This is expected as the temperature (∼90 K) at which EELS experimentation is performed in QB2 is well above its transition temperature. Detailed high-resolution low-loss EELS measurements clearly show enhanced density of states near the Fermi level [Citation18].
Figure 6. Cryo-EELS spectra of (a) B–K and (b) C–K for QB3 phase at 90K and RT.
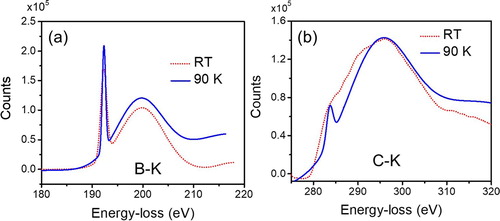
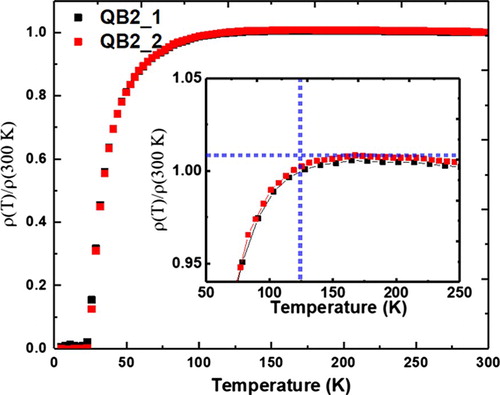
Figure shows the normalized ρ vs. T characteristics for the B-doped Q-carbon high-Tc samples. As it is evident from the figure there is a distinct drop in resistivity ∼125 K. This is a clear indication of high-temperature superconductivity in the QB3 phase. The zero-resistance condition in superconductors indicates a complete formation of Cooper pairs, whereas the onset of the drop in normalized ρ vs. T plots indicates critical fluctuations, a characteristic of superconductors. The nature of critical fluctuations (two- or three-dimensional) is a key consideration for practical applications of high-Tc superconductors [Citation19]. The results on the QB2 sample with Tc > 55 K have been verified experimentally by Chu’s group using M vs. T measurements [Citation20].
Figure 7. Resistivity vs. temperature results from QB3 sample with evidence of Tc > 100 K.
Theoretical considerations
The BCS theory [Citation3] directly relates superconducting transition temperature Tc with Debye temperature ΘD and density of states near the Fermi level and carrier (electron or hole) interaction potential V by
(1)
(1)
Since the Debye temperature ΘD for diamond is by far the highest 2240 K, the search for high-temperature superconductivity has focused on diamond-related, strongly bonded covalent materials. The electron–electron interaction V consists of attractive electron–phonon interaction minus the repulsive Coulomb interaction. Thus,
(2)
(2) where λ is electron–phonon interaction parameter and μ* is the normalized Coulomb repulsion.
Thus in the BCS formalism, Tc can be written as
(3)
(3)
The complex electron–phonon interactions have been worked out in Migdal-Eliashberg theory, which was solved numerically by McMillan to generalize the BCS result to give
(4)
(4)
This formula has been modified by Allen and Dynes to interpolate effectively between weak and strong coupling limits to give Tc as
(5)
(5) where h is the Planck constant and ωlog is the logarithmic frequency average [Citation21].
The λ = 1.02 was derived using Equation (5) from B-doped (25 at%) Q-carbon (QB2) with Tc = 55 K.[Citation10] Using this λ value for QB2, the λ for QB3 (50at% sample) is estimated to be 2.04. This is reasonable as all of B is found to be in substitutional sites from EELS data. Using this value for λ and μ* = 0.115, the Tc for QB3 is estimated to be 116 K from Equation (5), which is in agreement with EELS data and resistivity vs. temperature measurements [Citation18].
The Tc has been also estimated for the 2-D B-doped structure (as shown in Figure (b)) by calculating the Eliashberg function α2F(ω), electron–phonon coupling parameter λ, and the logarithmic frequency average ωlog by using the Quantum Espresso. Theoretical calculations using Quantum Espresso show a very high density of states near the Fermi level. Using Equation (5), the results of this calculation with μ* = 0.115 put Tc for the 2-D crystalline B-doped Q-carbon (50 at% B) at ∼200 K. Detailed magnetic field and magnetic moment in B-doped Q-carbon QB1 [Citation9] and QB2 [Citation10] phases have shown them to follow BCS formalism. In addition, Raman spectroscopy (vibrational modes) and low-loss EELS measurements clearly show enhanced density of states near the Fermi level consistent with BCS superconductivity models [Citation9,Citation10,Citation13,Citation18].
Summary discussions
Our search for near RT superconductivity has been narrowed to the following three (3D, 2D, and 1D) B-doped Q-carbon structures.
3D Structure: By repeating/arranging the D1 subunit cell with boron atom in the center of the tetrahedron, we have created the 3D amorphous structure about 5 nm thick so far. Using this sample we are able to perform detailed structural (HAADF STEM) characterization and bonding through π*and σ*peaks below and above Tc. The tetrahedra can be packed with an efficiency exceeding 80–85%. This structure corresponds to B concentration, close to 50at% B, which has been named as the QB3 phase. We have synthesized and characterized QB3 in great details in terms of atomic structure and bonding characteristics, and high Tc transport measurements are continuing from thicker samples to obtain sharper Tc. The EELS and preliminary transport measurements provide a clear evidence for Tc over 100 K. The EELS results on the changes of π*and σ*peaks at 300 and 90 K show a significant enhancement in the density of states at 90 K, indicating Tc to be considerably higher than 90 K. The resistivity as a function of temperature measurements shows the drop in resistivity starting at 125 K in these mixed phase samples which have a small volume fraction of the QB3 phase.
2D Structure: When four of D1 subunit cells are put together through 90-degree rotation, we create the D14 sub unit cell. When D14 subunit cells are repeated systematically in x–y two-dimension plane, we create a nanosheet. The density of states in two-dimensional nanosheets is constant and independent of energy, but very high. This density of states can be filled by boron doping, where these nanosheets can be doped with boron by replacing one, two, three or all four central carbon atoms in D14 sub unit cell.
1D Structure: Two D1 subunit cells can join with 90-degree rotation and form the QB2 phase when repeated randomly. Similarly, three D1 subunit cells can join in x- and y-directions and form the QB1 phase, when repeated randomly. By replacing B with C, it is possible to form Q1, Q2, and Q3 phases of pure and undoped Q-carbon, corresponding to QB1, QB2, and QB3 phases. The formation of distinct phases of amorphous QB1, QB2, and QB3 provides a direct evidence of polyamorphism in amorphous materials.
By repeating the D12 subunit cell in one-dimension, it is possible to form crystalline Q-diamond nanorod, which can have very high density of states near the Fermi energy. These density of states can be filled by doping with boron. By replacing the central carbon atom with boron in each of these tetrahedra, these nanostructures can be doped to a concentration of 50at%. By replacing the central carbon atom with boron in alternate tetrahedra, these nanostructures can be doped to a concentration of 25 at%.
Acknowledgements
We are grateful to Fan Family Foundation Distinguished Chair Endowment for Professor J. Narayan.. We are also very pleased to acknowledge the technical help of A. Moatti and useful discussions with Professors Marvin Cohen, John Prater, and Roger Narayan.
Disclosure statement
No potential conflict of interest was reported by the authors.
Additional information
Funding
References
- Gorter CJ. Superconductivity until 1940 in Leiden and as seen from there. Rev Mod Phys. [Internet]. 1964 [cited 2018 Nov 13];36:3–7. Available from: https://link.aps.org/doi/10.1103/RevModPhys.36.3.
- Cartlidge E. Superconductivity record sparks wave of follow-up physics. Nature [Internet]. 2015 [cited 2018 Nov 13];524:277–277. Available from: http://www.nature.com/doifinder/10.1038/nature.2015.18191.
- Bardeen J, Cooper LN, Schrieffer JR. Microscopic theory of superconductivity. Phys Rev. [Internet]. 1957 [cited 2018 Nov 13];106:162–164. Available from: https://link.aps.org/doi/10.1103/PhysRev.106.162.
- Anderson PW, Ren Y. Theory of the normal state of cuprate superconductors. MRS Proc. [Internet]. 1989 [cited 2019 Jan 7];169:3. Available from: http://journals.cambridge.org/abstract_S194642740055475X. doi: 10.1557/PROC-169-3
- Cohen ML. Some theories of high temperature superconductivity. MRS Proc. [Internet]. 1989 [cited 2019 Jan 7];169:13. Available from: http://journals.cambridge.org/abstract_S1946427400554761. doi: 10.1557/PROC-169-13
- Moussa JE, Cohen ML. Two bounds on the maximum phonon-mediated superconducting transition temperature. Phys Rev B [Internet]. 2006 [cited 2017 Aug 25];74:94520. Available from: https://link.aps.org/doi/10.1103/PhysRevB.74.094520.
- Moussa JE, Cohen ML. Constraints on Tc for superconductivity in heavily boron-doped diamond. Phys. Rev. B [Internet]. 2008 [cited 2017 Jan 23];77:64518. Available from: http://link.aps.org/doi/10.1103/PhysRevB.77.064518.
- Takano Y, Takenouchi T, Ishii S, et al. Superconducting properties of homoepitaxial CVD diamond. Diam Relat Mater. 2007;16:911–914. doi: 10.1016/j.diamond.2007.01.027
- Bhaumik A, Sachan R, Narayan J. High-temperature superconductivity in boron-doped Q-carbon. ACS Nano. 2017;11:5351–5357. doi: 10.1021/acsnano.7b01294
- Bhaumik A, Sachan R, Gupta S, et al. Discovery of high-temperature superconductivity (Tc=55 K) in B-doped Q-carbon. ACS Nano. 2017;11:11915–11922. doi: 10.1021/acsnano.7b06888
- Sakai Y, Chelikowsky JR, Cohen ML. Simulating the effect of boron doping in superconducting carbon. Phys Rev B [Internet]. 2018 [cited 2018 Jun 2];97:54501. Available from: https://link.aps.org/doi/10.1103/PhysRevB.97.054501.
- Narayan J, Bhaumik A, Sachan R. High temperature superconductivity in distinct phases of amorphous B-doped Q-carbon. J Appl Phys. [Internet]. 2018 [cited 2018 Apr 30];123:135304. Available from: http://aip.scitation.org/doi/10.1063/1.5016397.
- Narayan J, Bhaumik A, Gupta S, et al. Progress in Q-carbon and related materials with extraordinary properties. Mater Res Lett. [Internet]. 2018 [cited 2018 Apr 30];6:353–364. Available from: https://www.tandfonline.com/doi/full/10.1080/21663831.2018.1458753.
- Bhaumik A, Sachan R, Narayan J. A novel high-temperature carbon-based superconductor: B-doped Q-carbon. J Appl Phys. [Internet]. 2017 [cited 2017 Aug 11];122:45301. Available from: http://aip.scitation.org/doi/10.1063/1.4994787.
- Nagamatsu J, Nakagawa N, Muranaka T, et al. Superconductivity at 39 K in magnesium diboride. Nature [Internet]. 2001 [cited 2018 Nov 13];410:63–64. Available from: http://www.ncbi.nlm.nih.gov/pubmed/11242039. doi: 10.1038/35065039
- Jaoshvili A, Esakia A, Porrati M, et al. Experiments on the random packing of tetrahedral dice. Phys Rev Lett. [Internet]. 2010 [cited 2017 Oct 24];104:185501. Available from: https://link.aps.org/doi/10.1103/PhysRevLett.104.185501.
- Singh RK, Narayan J. A novel method for simulating laser-solid interactions in semiconductors and layered structures. Mater Sci Eng B [Internet]. 1989 [cited 2015 Apr 18];3:217–230. Available from: http://www.sciencedirect.com/science/article/pii/0921510789900147. doi: 10.1016/0921-5107(89)90014-7
- Sachan R, Hachtel JA, Bhaumik A, Prater J, Idrobo JC, Narayan J. Emergence of shallow energy levels in B-doped Q-carbon: a high temperature superconductor. Acta Mater (In Press).
- Bhaumik A, Sachan R, Narayan J. Magnetic relaxation and three-dimensional critical fluctuations in B-doped Q-carbon – a high-temperature superconductor. Nanoscale [Internet]. 2018 [cited 2018 Jul 16];10:12665–12673. Available from: http://xlink.rsc.org/?DOI=C8NR03406K. doi: 10.1039/C8NR03406K
- Bhaumik A, Narayan J. (To be published).
- Allen PB, Dynes RC. Transition temperature of strong-coupled superconductors reanalyzed. Phys Rev B [Internet]. 1975 [cited 2017 Apr 20];12:905–922. Available from: https://link.aps.org/doi/10.1103/PhysRevB.12.905.