
 ?Mathematical formulae have been encoded as MathML and are displayed in this HTML version using MathJax in order to improve their display. Uncheck the box to turn MathJax off. This feature requires Javascript. Click on a formula to zoom.
ABSTRACT
The thickness dependence and long-term stability of the magnetic properties of epitaxial (Cr0.5Mn0.5)2GaC MAX phase films on MgO (111) were investigated. For 12.5- to 156-nm-thick films, which corresponds to 10–125 c-axis unit cells, samples were found to be phase pure with negligible c-axis lattice strain of less than 10−4 nm even for the thinnest films. No influence of the interface layers on the magnetic anisotropy, the magnetization or the para- to ferromagnetic phase transition was observed. All samples remained stable for more than one year in ambient conditions.
GRAPHICAL ABSTRACT

IMPACT STATEMENT
The complex temperature- and magnetic field-dependent magnetism of electrically conducting (Cr0.5Mn0.5)2GaC MAX phase films is environmentally robust over one year and independent on interface effects.
1. Introduction
Surface magnetism has been a very fruitful and interesting research field for technological applications over the last five decades, providing the possibility of tuning and controlling magnetic properties at the nanoscale as well as giving rise to a plethora of new magnetic states (see for example [Citation1–3] and references therein). The break of translation symmetry and change of the electronic structure as well as the abrupt change of the crystal field in thin films has a strong influence on the magnetic ordering temperature, spin structure, magnetization and magnetocrystalline anisotropy at the interfaces. Other mechanisms include coherent strain due to mismatch of crystal lattice parameters between the material and substrate/buffer layer [Citation3,Citation4] as well as chemical hybridization of electronic structures between two materials [Citation4]. In particular, the last two contributions significantly influence the magnetocrystalline anisotropy energy density (MAE), which may change by orders of magnitude [Citation4–6]. Another extrinsic reason for magnetic modifications at the interface is the quality of the interface itself, that is roughness, interdiffusion and structural imperfections. Furthermore, surface oxidation is a crucial issue in exchange bias applications [Citation6] as well as in magnetic hardening [Citation7]. On the other hand, the protection of a magnetic film against oxidation by capping layers causes different magnetic properties at the interface. For many applications such as spintronic devices and magnetic sensors, it is important to have magnetic ultrathin films, which are environmentally stable and whose magnetism does not depend on the film thickness. While oxides naturally provide this stability, many conducting—especially 3d element based—materials do not. Here, we demonstrate that the electrically conducting magnetic (Cr0.5Mn0.5)2GaC MAX phase films can satisfy the above-mentioned requirements.
Mn+1AXn (n = 1, 2, 3) compounds, known as MAX phases, are hexagonal carbides and nitrides (denoted as X) with atomic monolayers stacked along the c-axis [Citation8]. These materials mechanically behave like ceramics, are high-temperature oxidation resistant and electrically conductive like metals with room temperature resistivities from 0.07 µΩm to 2.7 µΩm [Citation8–11]. The d orbitals of the transition metal M-element are strongly hybridized with 2p states of C or N, resulting in a strong covalent bonding along M-X-M sheets in the basal plane. The M-X-M sheets are interleaved by ‘A’ atomic layers, which are usually elements of the III–V groups in the periodic table of elements (Al, Si, Ga, Ge, etc.) [Citation8–11]. The electrical conductivity of these materials originates from overlapping d states of the M-element. These states dominate the density of states at the Fermi level [Citation8–10]. Partial or complete substitution of the M-elements by Mn in Mn+1AXn compounds resulted in the discovery of a new class of magnetic materials: magnetic MAX phases, see e.g. Refs. [Citation12–14]. Recent studies revealed a high magnetic ordering temperature (above 200 K) which is strongly influenced by the Mn concentration at the M-site and by the choice of the A-element [Citation15–22]. The highest phase purity and structural quality has been achieved in (Cr0.5Mn0.5)2GaC films epitaxially grown on MgO (111) substrates [Citation23]. These films exhibit magnetic phase transition to a magnetically ordered state below T = 220 K [Citation21,Citation22] with the characteristics of a soft ferromagnet [Citation22].
In order to study the surface effects in magnetic (Cr0.5Mn0.5)2GaC films, we have grown 12.5- to 156-nm-thick films on MgO (111) substrates, corresponding to approximately 10 and 125 c-axis unit cells, respectively. Using ferromagnetic resonance (FMR), we studied the behavior of the magnetic phase transition, magnetization and magnetocrystalline anisotropy energy density (MAE) as a function of film thickness. In this letter, we show that the magnetic properties of the (Cr0.5Mn0.5)2GaC films are not influenced by their interfaces. Furthermore, the (Cr0.5Mn0.5)2GaC films do not show any signs of chemical or structural degradation like corrosion and interdiffusion for more than one year in ambient conditions.
2. Experimental details
(Cr0.5Mn0.5)2GaC thin films of thickness 12.5, 20.8, 40.3, 77.5 and 156 nm were epitaxially grown by magnetron sputtering on MgO (111) substrates, as reported previously [Citation23]. The structural quality, surface morphology and thickness of all films were investigated using X-ray diffraction (XRD), scanning electron microscopy (SEM) and X-ray reflectivity (XRR), respectively. XRD and XRR were performed using standard θ–2θ geometry in a Panalytical Empyrean MRD with Cu-Kα radiation (λ = 1.54 Å). The scans were obtained with the tube in line focus using a Ge (220) hybrid monochromator on the incident side and a 0.27° collimator on the diffracted side, with or without a collimator slit depending on the measurement. SEM images were obtained using Zeiss LEO 1530 with a standard Schottky emitter module operated at 10 kV acceleration voltage. The ‘Fiji open-source Java package’ in the ImageJ software was used for SEM image analysis [Citation24]. Magnetic properties were studied using Superconducting Quantum Interference Device (SQUID) magnetometry between 50 K < T < 300 K. The FMR spectra were recorded using a conventional Bruker X-band spectrometer and a cylindrical mode cavity at temperatures down to 100 K.
3. Results and discussion
X-ray diffractograms of 40.3- and 156-nm-thick samples are shown in Figure (a). Only Bragg peaks of the (000l) basal planes of the (Cr0.5Mn0.5)2GaC MAX phase and MgO (111) and (222) substrate planes can be identified, suggesting a high crystalline quality of both samples. Trace amounts of a cubic CrGa4 phase (at most 0.1% of the total volume) yielding the noisy peaks at 22° and 45° (CrGa4 (110) and (220) Bragg reflections) cannot be fully excluded in the 156-nm-thick sample. The basal plane peak positions are identical in both samples with the same c-axis lattice parameter of 1.258 nm [Citation23]. The (000l) basal plane peak intensities of 12.5- and 20.8-nm-thick films are presented in Figure S1(a, b). The (0006) diffraction peaks of the (Cr0.5Mn0.5)2GaC phase can be clearly identified for both samples. This suggests the same sample quality as in thicker films. The (0006) peak position of all films does not show a shift (Figure S1(c)) indicating that the coherent c-axis lattice strain due to the lattice mismatch of the film to MgO (111) is smaller than 10−4 nm.
Figure 1. (a) θ–2θ X-ray diffractograms of 40.3 nm (red) and 156 nm (black) thick (Cr0.5Mn0.5)2GaC films. (b–e) Scanning electron microscopy images of (Cr0.5Mn0.5)2GaC film surfaces for film thickness d = 12.5, 20.8, 40.3 and 156 nm.
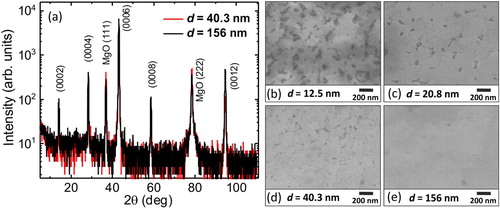
The analysis of X-ray reflectivity revealed an almost identical mass density of 6.4(2) g/cm3 for all samples, except for the one of 12.5 nm thickness. The reflectivity data of the latter could only be fitted by assuming a 20% smaller effective mass density, of about 5.1(1) g/cm3. The film morphologies are presented in Figure (b–e). The 12.5 nm film is inhomogeneous and has a porous microstructure, indicating the 10-unit cell thick layer (12.5 nm) as the lower limit for the formation of homogeneous and continuous (Cr0.5Mn0.5)2GaC films. The average filling factor of 80% correlates well with the 20% apparent reduction of the mass density deduced from XRR. The films most likely form through a step-flow growth mode with heterogeneous nucleation, a typical growth mode for many layered MAX phases [Citation10].
Magnetic hysteresis loops measured by SQUID magnetometry for the 20.8 and 156 nm samples are presented in Figure S2. Тhe saturation magnetization = 230 ± 30 kA/m measured at T = 100 K does not change as a function of the thickness within the error bar. The large diamagnetic contribution of the MgO substrate which at 9 T is one order of magnitude larger than the signal from the 20.8-nm-thick (Cr0.5Mn0.5)2GaC film was subtracted.
FMR is a very sensitive method for the characterization of thin ferromagnetic films [Citation2], i.e. in determining the effective magnetization, , which includes the demagnetizing and magnetocrystalline anisotropy fields. Furthermore, the FMR spectra of ferromagnetic films are not affected by the substrate’s diamagnetic signal. For the (Cr0.5Mn0.5)2GaC films, the effective magnetization is given by the shape and uniaxial perpendicular magnetocrystalline anisotropy field [Citation22]:
(1)
(1) where
is the uniaxial perpendicular magnetocrystalline anisotropy energy density. In general,
has two contributions, the volume (
) and the surface/interface (
) anisotropy [Citation3]:
(2)
(2) where
is the film thickness and the factor 2 accounts for the contributions of the surface and the interface. Equation (2) represents the fact that with decreasing thickness of the film, the surface contribution to the total magnetic anisotropy increases.
Using the Kittel equation with the magnetic field applied parallel to the film plane, we evaluate
according to [Citation19, Citation22]:
(3)
(3) where ω = 2πf, f = 9.47 GHz is the microwave frequency of the experiment, γ = gµB/ħ is the electron gyromagnetic ratio and g = 2 is the spectroscopic splitting factor for the (Cr0.5Mn0.5)2GaC compound [Citation22]. Combining Equations (1), (2) and (3), one expects that the surface-induced magnetic anisotropy
will manifest itself by a thickness-dependent shift of the resonance field
[Citation3].
The FMR spectra for the (Cr0.5Mn0.5)2GaC magnetic films with different thicknesses are presented in Figure (a). It is evident that the resonance fields of all spectra, except the one of the 12.5-nm-thick film, are nearly identical at 110 K. This implies that
= 140 ± 4 mT in (Cr0.5Mn0.5)2GaC is constant for
= 20.8, 40.3, 77.5 and 156 nm and that interface/surface effects do not have a significant influence. The thinnest (
= 12.5 nm) sample has a smaller
= 120 ± 4 mT. This value is approximately 85% of
of thicker samples and very close to the volumetric filling factor obtained from the SEM image analysis. The volumetric filling factor is commonly used as a scaling factor in order to take into account an effective anisotropy in non-continuous or granular films [Citation25]. Accordingly, we assume that the reduced
of the 12.5 nm sample is the result of an inhomogeneous, porous thin film morphology.
Figure 2. (a) FMR spectra of (Cr0.5Mn0.5)2GaC films with different thickness measured at the temperature of T = 110 K. The ‘noisy’ features from 0.31 to 0.37 T are electron paramagnetic resonance (EPR) signals from impurities in the MgO substrate. (b) Temperature dependence of the FMR field for different thicknesses of (Cr0.5Mn0.5)2GaC films, solid lines are a guide to the eye.
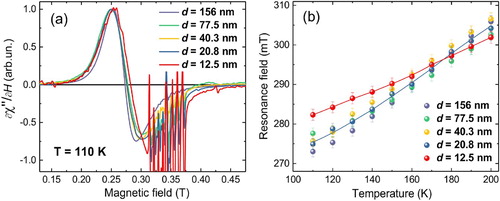
The temperature dependence of the resonance field for all samples is shown in Figure (b). Approaching the phase transition temperature to a paramagnetic state (T = 220 ± 15 K [Citation21, Citation22]) from low temperatures, the resonance field increases for all samples, which is in line with the previous study [Citation22]. All data points for different thicknesses in Figure (b) show a similar temperature dependence, except the data of the 12.5-nm-thin sample. The saturation magnetization as well as transition temperature does not depend on the film thickness for d > 13 nm and magnetic surface effects are not detectable. The weaker temperature dependence of the 12.5-nm-thin sample (Figure b) is the result of the reduced effective magnetization at low temperatures due to the porosity of the film.
decreases with increasing temperature as expected due to reduced saturation magnetization (see Equation 1) near the magnetic phase transition [Citation3]. At temperatures of about 160–190 K, the resonance fields of the 12.5 nm sample and thicker samples are not distinguishable within the experimental resolution.
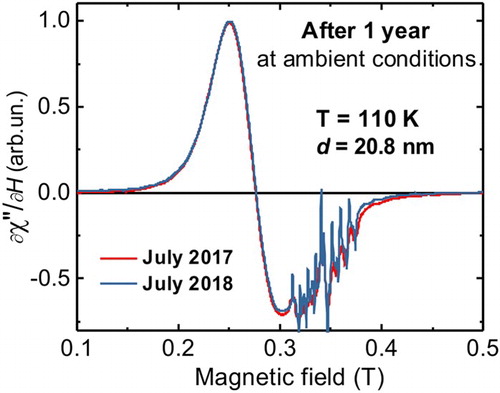
The long-term stability of the magnetic MAX phase (Cr0.5Mn0.5)2GaC has not yet been addressed in the literature. On the other hand, it is well known that metallic, nanometer-thin, soft magnetic films are magnetically and chemically unstable under environmental conditions [Citation3]. In order to verify the influence of environmental conditions on the magnetic properties of the (Cr0.5Mn0.5)2GaC films, we exposed the unprotected 20.8-nm-thin sample with its surface to ambient air for 1 year and repeated the FMR measurements. Comparison of the FMR spectra recorded at 110 K with the initially measured one (Figure ) shows neither a change of the resonance field nor a change of the FMR line shape and linewidth. This confirms that the magnetic properties do not change due to corrosion or deterioration of the surface or interface, indicating the high environmental stability of an even 20.8-nm-thin (Cr0.5Mn0.5)2GaC film at ambient conditions over one year. On the contrary, for (Cr,Mn)2GeC MAX phase films we find a significant change of magnetic properties within 6 months.
Figure 3. FMR spectra of the (Cr0.5Mn0.5)2GaC film with the thickness of d = 20.8 nm recorded in the time interval of 1 year.
4. Conclusion
The thickness dependence of the magnetic properties of epitaxial 12.5–156 nm-thick (Cr0.5Mn0.5)2GaC MAX phase films was studied. All films exhibit good quality without a significant c-axis lattice coherent strain or strain relaxation. Below the thickness of 20.8 nm, the films are porous and do not form complete layers. The magnetocrystalline anisotropy, magnetization and phase transition temperature to the paramagnetic state are thickness independent, suggesting that interface effects are insignificant. Films do not show any aging effects for at least one year.
Supplemental Material
Download MS Word (271.7 KB)Acknowledgements
We thank Dr. Marina Spasova for fruitful discussions. We acknowledge support by the Open Access Publication Fund of the University of Duisburg-Essen.
Disclosure statement
No potential conflict of interest was reported by the authors.
Additional information
Funding
Related Research Data
References
- Gradmann U. Surface magnetism. J Magn Magn Mat. 1991;100:481–496. doi: 10.1016/0304-8853(91)90836-Y
- Hellman F, Hoffmann A, Tserkovnyak Y, et al. Interface-induced phenomena in magnetism. Rev Mod Phys. 2017;89(2):1293. doi: 10.1103/RevModPhys.89.025006
- Farle M. Ferromagnetic resonance of ultrathin metallic layers. Rep Prog Phys. 1998;61:755–826. doi: 10.1088/0034-4885/61/7/001
- Johnson MT, Bloemen PJH, den Broeder FJA, et al. Magnetic anisotropy in metallic multilayers. Rep Prog Phys. 1996;59:1409–1458. doi: 10.1088/0034-4885/59/11/002
- Giannopolous G, Salikhov R, Zingsem B, et al. Large magnetic anisotropy in strained Fe/Co multilayers on AuCu and the effect of carbon doping. APL Mater. 2015;3:041103. doi: 10.1063/1.4919058
- Nogués J, Schuller I K. Exchange bias. J Magn Magn Mat. 1999;192:203–232. doi: 10.1016/S0304-8853(98)00266-2
- Liébana Viñas S, Salikhov R, Bran C, et al. Magnetic hardening of Fe30Co70 nanowires. Nanotechnology. 2015;26:415704. doi: 10.1088/0957-4484/26/41/415704
- Barsoum MW. MAX phases, properties of machinable ternary carbides and nitrides. New York: Wiley; 2013.
- Magnuson M, Mattesini M. Chemical bonding and electronic-structure in MAX phases as viewed by X-ray spectroscopy and density functional theory. Thin Solid Films. 2017;621:108–130. doi: 10.1016/j.tsf.2016.11.005
- Eklund P, Beckers M, Jansson U, et al. The Mn+1AXn phases: materials science and thin-film processing. Thin Solid Films. 2010;518:1851–1878. doi: 10.1016/j.tsf.2009.07.184
- Ouisse T, Barsoum MW. Magnetotransport in the MAX phases and their 2D derivatives: MXenes. Mater Res Lett. 2017;5:365–378. doi: 10.1080/21663831.2017.1333537
- Ingason AS, Dahlqvist M, Rosen J. Magnetic MAX phases from theory and experiments; a review. J Phys.:Condens Matter. 2016;28:433003.
- Ingason AS, Mockute A, Dahlqvist M, et al. Magnetic self-organized atomic laminate from first principles and thin film synthesis. Phys Rev Lett. 2013;110:195502. doi: 10.1103/PhysRevLett.110.195502
- Ingason AS, Petruhins A, Dahlqvist M, et al. A Nanolaminated magnetic phase: Mn2GaC. Mater Res Lett. 2014;2:89–93. doi: 10.1080/21663831.2013.865105
- Novoselova I P, Petruhins A, Wiedwald U, et al. Large uniaxial magnetostriction with sign inversion at the first order phase transition in the nanolaminated Mn2GaC MAX phase. Sci Rep. 2018;8:2637. doi: 10.1038/s41598-018-20903-2
- Ingason AS, Palsson GK, Dahlqvist M, et al. Long-range antiferromagnetic order in epitaxial Mn2GaC thin films from neutron reflectometry. Phys Rev B. 2016;94:024416. doi: 10.1103/PhysRevB.94.024416
- Rivin O, Caspi EN, Pesach A, et al. Evidence for ferromagnetic ordering in the MAX phase (Cr0.96Mn0.04)2GeC. Mater Res Lett. 2017;5:465–471. doi: 10.1080/21663831.2017.1317295
- Liu Z, Waki T, Tabata Y, et al. Mn-doping-induced itinerant-electron ferromagnetism in Cr2GeC. Phys Rev B. 2014;89:054435. doi: 10.1103/PhysRevB.89.054435
- Salikhov R, Meshkian R, Weller D, et al. Magnetic properties of nanolaminated (Mo0.5Mn0.5)2GaC MAX phase. J Appl Phys. 2017;121:163904. doi: 10.1063/1.4982197
- Tao Q, Salikhov R, Mockute A, et al. Thin film synthesis and characterization of a chemically ordered magnetic nanolaminate (V,Mn)3GaC2. APL Mater. 2016;4:086109. doi: 10.1063/1.4961502
- Lai CC, Tao Q, Fashandi H, et al. Magnetic properties and structural characterization of layered (Cr0.5Mn0.5)2AuC synthesized by thermally induced substitutional reaction in (Cr0.5Mn0.5)2GaC. APL Mater. 2018;6:026104. doi: 10.1063/1.5006304
- Salikhov R, Semisalova SA, Petruhins A, et al. Magnetic anisotropy in the (Cr0.5Mn0.5)2GaC MAX phase. Mater Res Lett. 2015;3:156–160. doi: 10.1080/21663831.2015.1036324
- Petruhins A, Ingason AS, Lu J, et al. Synthesis and characterization of magnetic (Cr0.5Mn0.5)2GaC thin films. J Mater Sci. 2015;50:4495–4502. doi: 10.1007/s10853-015-8999-8
- Schindelin J, Arganda-Carreras I, Frise E, et al. Fiji: an open-source platform for biological-image analysis. Nat Methods. 2012;9(7):676–682. doi: 10.1038/nmeth.2019
- Spasova M, Wiedwald U, Ramchal R, et al. Magnetic properties of arrays of interacting Co nanocrystals. J Magn Magn Mater. 2002;240:40–43. doi: 10.1016/S0304-8853(01)00723-5