
 ?Mathematical formulae have been encoded as MathML and are displayed in this HTML version using MathJax in order to improve their display. Uncheck the box to turn MathJax off. This feature requires Javascript. Click on a formula to zoom.
ABSTRACT
Tetratitanium heptoxide, Ti4O7, is known to exhibit a two-step phase transition from the charge-delocalized to charge-localized phase and the charge-disordered to charge-ordered phase around 150 K and 130 K, respectively. Herein, a nanoscopic effect of the Ti4O7 phase transition is studied. A one-step phase transition from the charge-delocalized to charge-localized phase is realized in Ti4O7 nanocrystals where the transition from the charge-disordered to charge-ordered phase is suppressed. Perturbation to the free energy by the surface energy can explain this anomalous phase transition. The present nanoscopic effect, which can control cooperativity in phase transitions, should contribute to develop advanced switching materials.
GRAPHICAL ABSTRACT
IMPACT STATEMENT
Ti4O7 nanocrystal exhibits a one-step phase transition from a charge-delocalized to a charge-localized phase. This anomalous phase transition can be understood by the nanoscopic effect contributed by the surface energy.
Introduction
Phase transition phenomena are attracting widespread attention from the viewpoints of fundamental sciences and practical applications. For example, spin-crossover, charge-transfer, metal–semiconductor, and crystal–amorphous transitions have been aggressively studied [Citation1–17]. Controlling the cooperative behavior of a phase transition is an important topic. To date, several approaches have been reported, including metal doping and crystal size control [Citation18–31]. For example, the cooperative effect on phase transition of spin-crossover complexes, charge-transfer cyano complexes, and metal–semiconductor transition materials can be altered by controlling the crystal size [Citation18–26].
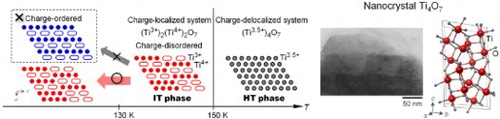
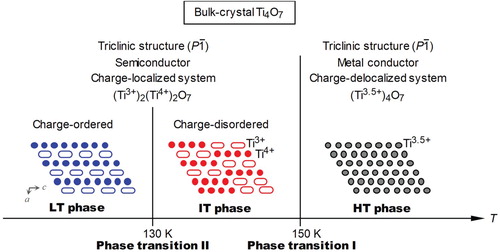
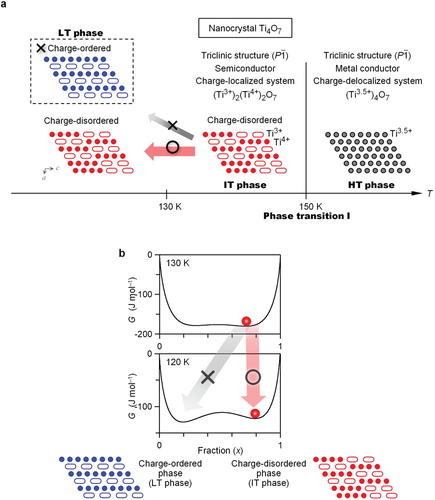
Titanium oxides, which are called the Magneli phase and have a composition of TinO2n−1 (n = 3–9), exhibit metal–semiconductor (metal–insulator) transitions. Especially, Ti3O5 and Ti4O7 possess a high electric conductivity and exhibit a metal–semiconductor transition as the temperature changes [Citation32–38]. In 2010, a nanoscopic effect on the phase transition in Ti3O5 was reported, where a Ti3O5 nanocrystal realized a new phase of λ-Ti3O5. λ-Ti3O5 exhibits a reversible photo-induced metal–semiconductor phase transition at room temperature [Citation23]. On the other hand, a nanoscopic effect on the phase transition in Ti4O7 has yet to be reported. In a Ti4O7 bulk crystal, a phase transition from the high-temperature (HT) metallic phase to the intermediate-temperature (IT) semiconductor phase occurs at 150 K (Figure ). The IT phase transits to the low-temperature (LT) semiconductor phase around 130 K. The Ti ions in the HT phase have a uniform valence state of +3.5, whereas the Ti ions in the IT and LT phases take different valence states of Ti3+ and Ti4+ [Citation34–37]. Due to the phase transition from the IT phase to the LT phase, the arrangement of Ti3+ and Ti4+ changes from a disordered to ordered state. Hereafter, the phase transition between the HT and IT phase due to a charge-delocalized and charge-localized phase is called phase transition I, while that between the IT and LT phase due to charge-disordered and charge-ordered phase is called phase transition II (Figure ).
Figure 1. Schematic of the two-step phase transition in a Ti4O7 conventional bulk crystal. High-temperature (HT) metallic phase transits to intermediate-temperature (IT) semiconductor phase at 150 K (phase transition I). IT phase transits to low-temperature (LT) semiconductor phase around 130 K (phase transition II). Valence state of Ti ions in the HT phase is Ti3.5+ (gray circles), whereas Ti ions in the IT and LT phases take different valence states of Ti3+ (white ellipses) and Ti4+ (colored circles). In the schematic structure of Ti4O7 viewed from the b-axis, oxygen is omitted for clarity and the covalently bonded pair of Ti3+ is expressed as a white elongated ellipse.
In this work, we synthesize a nanosize Ti4O7 crystal by sintering TiO2 nanoparticles under a hydrogen flow. The temperature dependences of the magnetic susceptibility, crystal structure, and heat capacity are measured. An anomalous phase transition, where only phase transition I occurs, is observed. This anomalous phase transition originates from a nanoscopic effect contributed by the surface energy. Theoretical calculations using a mean-field thermodynamic model suggest that the nanoscopic effect perturbs the Gibbs free energy, leading to an anomalous phase transition.
Methods
Material
The anatase form of TiO2 nanoparticles with a 7-nm particle size (commercial, Ishihara Sangyo Kaishia, ST-01) was sintered under hydrogen at a flow speed of 0.3 dm-3 min-1 and 1000°C for 5 h to obtain Ti4O7 as a powder.
Measurements
Elemental analysis was performed by X-ray fluorescence (XRF) using a RIGAKU ZSX Primus IV. The morphologies of the sample were measured with a scanning electron microscope (SEM) using a JEOL JSM-7000F and a transmission electron microscope (TEM) using a JEOL JEM 2000EX. X-ray powder diffraction (XRPD) patterns were measured using a Rigaku Ultima IV with Cu Kα (λ = 1.5418 Å). Rietveld analyses for the XRPD patterns were performed using Rigaku PDXL software. The XRPD patterns were calibrated using Si powder [Citation39]. The temperature during the XRPD measurements was controlled by a RIGAKU R-CRT-105 cryostat. Apiezon L was used as a thermal medium to maintain thermal contact between the sample and the Cu holder. X-ray photoelectron spectra (XPS) were measured at room temperature using a JPS 9010 TR (JEOL, Japan) with an ultrahigh vacuum chamber and an Al Kα X-ray source (1486.6 eV). Magnetic measurements were performed using a Quantum Design MPMS superconducting quantum interference device (SQUID) magnetometer. The heat capacity was measured by using the Quantum Design physical properties measurement system (PPMS). The equation based on the two-Debye model was fitted to the observed plotsFootnote1 [Citation40].
Results and discussion
Material and morphology
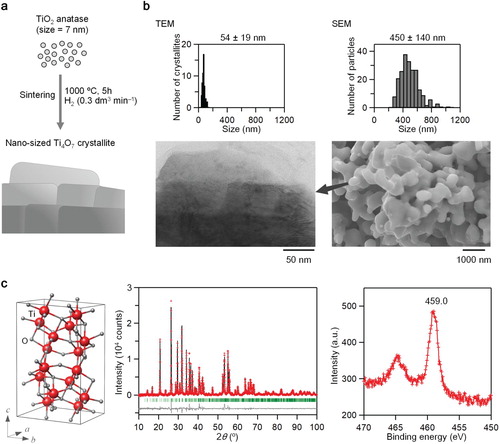
The target material was obtained by sintering anatase-TiO2 nanoparticles under hydrogen flow (Figure (a)). A dark blue powder sample was obtained. XRF measurements suggest that the formula is Ti4.00(2)O7.00(2): Calc., Ti 63.1 wt%; Found, Ti 63.1(2) wt%. Figure (b) shows the SEM (right) and TEM (left) images of the synthesized sample along with the size distributions. The sample has a flake-like morphology with an apparent particle size of 450 ± 140 nm and is composed of aggregates of square-shaped nanocrystals, where the majority is 54 ± 19 nm. The XRPD pattern and Rietveld analysis at room temperature indicate that the synthesized sample is pure Ti4O7 with a triclinic crystal structure (space group; ) with the lattice constants of a = 5.5966 (1) Å, b = 7.1238 (2) Å, c = 12.4622 (7) Å, α = 95.051 (1)°, β = 95.172 (1)°, and γ = 108.753(1)° (Figure (c), left and middle). The crystallite size estimated by Rietveld analysis is 58.1 ± 0.4 nm. This value agrees well with the estimated size by the TEM images. The XPS spectra at room temperature are shown in Figure (c) (right), and Figures S1 and S2. The observed peaks at 459.0 eV and 530.4 eV are assigned to the binding energies of Ti 2p and O 1s, respectively. These are similar to those of the HT phase in Ti4O7 bulk crystal, indicating that the valence state of Ti in the synthesized sample is 3.5+ [Citation41].
Figure 2. Synthesis, morphology, crystal structure, and valence state of nanocrystal Ti4O7. (a) Schematic of the synthetic procedure. (b) TEM image and size distribution (left) and SEM image and size distribution (right) of nanocrystal Ti4O7. (c) Crystal structure (left) and Rietveld analysis (middle). Red dots, black line, and gray dots are the observed pattern, calculated pattern, and their difference, respectively. Green bars represent the calculated positions of the Bragg reflections of Ti4O7. XPS spectrum (right) for the Ti 2p peak.
Temperature dependence of the magnetic susceptibility and crystal structure
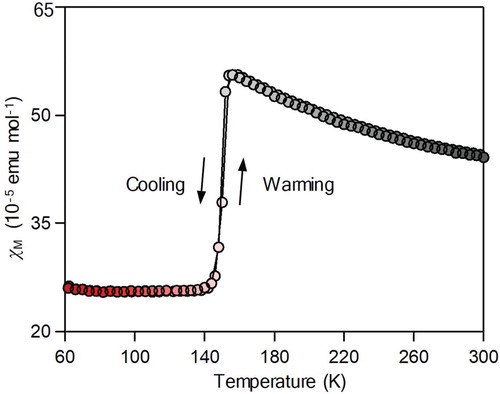
Figure shows the product of the molar magnetic susceptibility (χM) vs. temperature plots of the present sample. As the temperature decreases from room temperature, the χM value gradually increases, but the χM value suddenly decreases at 150 K. The decreased value is maintained at a low temperature. As the temperature increases from 60 K, the χM value returns to the initial value around 150 K. The observed transition at 150 K is consistent with a transition due to the valence change between Ti3.5+ (HT phase) and Ti3+ and Ti4+ (IT phase) [Citation36].
Figure 3. χM vs. temperature plot of the sample with a temperature sweeping rate of ±1.0 K min-1 under an external field of 5000 Oe.
To investigate the crystal structures before and after the transition at 150 K, the XRPD patterns were measured at 200 K and 100 K (Figures S3 and S4). From the Rietveld analyses, the crystal structure at 200 K is triclinic (space group; ) with lattice constants of a = 5.5866(3) Å, b = 7.1155(4) Å, c = 12.4443(7) Å, α = 95.073(2)°, β = 95.195(2)°, γ = 108.760 (2)°, and V = 462.83(5) Å3 (Table S1), whereas the crystal structure at 100 K is triclinic (
) with lattice constants of a = 5.5863(4) Å, b = 7.1197(5) Å, c = 12.4720(8) Å, α = 95.031(2)°, β = 95.337(2)°, γ = 108.907(2)°, and V = 463.58(5) Å3 (Table S2). The lattice constant of a at 100 K contracts slightly compared to that at 200 K. By contrast, the lattice constants of b and c at 100 K expand compared to those at 200 K. The volume at 100 K expands slightly compared to that at 200 K. The difference in the lattice constants and volume between 200 K and 100 K are consistent with those of the HT and IT phases reported in a bulk Ti4O7 crystal [Citation34,Citation35].
Temperature dependence of the heat capacity
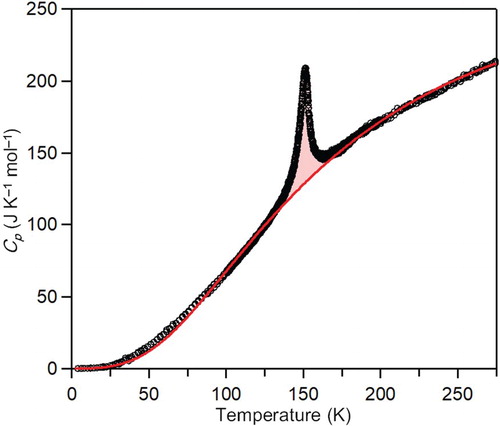
The molar heat capacity (Cp) of the present sample was measured between 5 K and 275 K (Figure ). A sharp peak is observed at 150 K. Cp can be expressed by the sum of the heat capacity due to the lattice vibration (Clat) and the phase transition (Ctrans) as Cp = Clat + Ctrans. Hence, by estimating Clat, the anomalous heat capacity due to the Ctrans is extracted (see note 1). Then the values of the thermodynamic parameters of the transition enthalpy (ΔHtrans) and the transition entropy (ΔStrans) are estimated based on the relationship of ΔHtrans = and ΔStrans =
, i.e. ΔHtrans = 941.4 J mol-1 and ΔStrans = 6.4 J K-1 mol-1. These values are approximately half of the reported ΔHtrans and ΔStrans values of the first-order transition at 150 K in the bulk crystal, respectively [Citation36]. The ratio of ΔHtrans of the nanocrystal to that of bulk crystal is 48%, and the ratio of ΔStrans of the nanocrystal to that of bulk crystal is 50%. Below 150 K, a peak is not observed in the present sample, although a second peak characteristic of the first-order transition has been reported in the bulk crystal around 130 K [Citation36].
Figure 4. Molar heat capacity (Cp) of the sample as a function of temperature. A Debye model (red line) was fitted to the experimental data (circle).
Thermodynamic calculations of the phase transition in nanocrystal Ti4O7
The nanocrystal sample exhibits a phase transition at 150 K according to the temperature dependence of χM and Cp. The XRPD patterns indicate that the lattice constant changes due to a phase transition. From these results, the observed phase transition is regarded as phase transition I. In the nanocrystal, phase transition II is not observed. That is, nanocrystal Ti4O7 exhibits a one-step phase transition of phase transition I.
Next, to understand the suppression of phase transition II in nanocrystal Ti4O7, the Gibbs free energy (G) was calculated using the Slichter and Drickamer mean-field thermodynamic model [Citation42]. In this model, G is expressed as G = x ΔHtrans + γ x(1 − x) + T{R[x ln x + (1 − x)ln(1 − x)] − x ΔStrans}, where ΔHtrans, ΔStrans, γ, and R are the transition enthalpy, transition entropy, interaction parameter between two phases, and gas constant, respectively. Phase transition II, which is the transition between the IT and LT phase, is regarded as a semiconductor-to-semiconductor transition from the charge-disordered to charge-ordered phase (Figure ). In this case, x denotes the fraction of the charge-disordered unit, (Ti3+,Ti4+)2O7, when G of the charge-ordered phase is taken as the origin of the energies. Using the reported ΔHtrans and ΔStrans values of the bulk-crystal Ti4O7 [Citation36], the phase transition II is reproduced, the stable phase turns the charge-ordered phase as temperature decrease (Figure S5). For the nanocrystal calculation, when the values of ΔHtrans and ΔStrans are set to 48% and 50% of those in the bulk crystal,Footnote2 phase transition II does not occur (Figure ). In the temperature dependence of the G vs. x curve, the existence of energy barriers prevents the transition to the charge-ordered phase (Figure (b)). Therefore, the charge-disordered phase is maintained at a low temperature.
Figure 5. One-step phase transition in a nanocrystal Ti4O7. (a) Schematic of the one-step phase transition. Charge-delocalized HT phase transits to the charge-localized IT phase at 150 K (phase transition I). Charge-disordered IT phase does not transit to the charge-ordered phase (i.e. charge-disordered IT phase is maintained at low temperature). In the schematic structure of Ti4O7 viewed from b-axis, oxygen is omitted for clarity. Gray and red (or blue) circles indicate Ti3.5+ and Ti4+, respectively, and the covalently bonded pair of Ti3+ is expressed as a white–elongated ellipse. (b) Calculated Gibbs free energy (G) vs. fraction (x) curves between the charge-disordered and charge-ordered phase at 130 K and 120 K. Phase transition II from the charge-disordered to charge-ordered phase does not occur using values of ΔHtrans = 191 J mol-1, ΔStrans = 1.5 J K-1 mol-1, and γ = 2.3 kJ mol-1. Red circles indicate the thermal populations.
Conclusion
Herein we report the nanoscopic effect on the phase transition of Ti4O7. Nanocrystal Ti4O7 shows a one-step phase transition behavior from a charge-delocalized to charge-localized phase (i.e. from HT to IT phase) since the transition from the charge-disordered to the charge-ordered phase is suppressed. This one-step phase transition can be understood by the nanoscopic effect contributed by the surface energy. Controlling the cooperativity in a phase transition is important from the viewpoints of scientific knowledge and the development of sensor- and switching-material applications. The present results may inspire additional advances in the field of nanoelectronic devices.
Acknowledgments
We acknowledge the Cryogenic Research Center, The University of Tokyo, and Nanotechnology Platform, which are supported by MEXT.
Disclosure statement
No potential conflict of interest was reported by the author(s).
ORCID
Hiroko Tokoro http://orcid.org/0000-0002-3431-0643
Takahiro Kondo http://orcid.org/0000-0001-8457-9387
Shin-ichi Ohkoshi http://orcid.org/0000-0001-9359-5928
Additional information
Funding
Notes
1 To investigate the temperature dependence of the Clat, we used two-Debye model, expressed by , where R is gas constant, ci is coefficient, θi is Debye temperature, x is
, ħ is the reduced Planck constant, ω is phonon frequency, and kB is Boltzmann constant, with the fit parameters of c1 = 4.1, c2 = 7.2, θ1 = 8.9(2) × 102 K, and θ2 = 5.5(2) ×102 K [Citation40].
2 From the heat capacity measurement, the ΔHtrans and ΔStrans of phase transition I in nanocrystal were estimated as ca. 48% and 50% of those in the bulk crystal. Such a nanoscopic effect on the thermodynamic parameters was observed in Al2O3, Fe2O3, and Ti3O5 [Citation23,Citation24,Citation43,Citation44].
References
- Kolobov AV, Fons P, Frenkel AI, et al. Understanding the phase-change mechanism of rewritable optical media. Nat Mater. 2004;3:703–708. doi: 10.1038/nmat1215
- Wuttig M, Yamada N. Phase-change materials for rewriteable data storage. Nat Mater. 2007;6:824–832. doi: 10.1038/nmat2009
- Kahn O, Martinez CJ. Spin-transition polymers: from molecular materials toward memory devices. Science. 1998;279:44–48. doi: 10.1126/science.279.5347.44
- Renz F, Oshio H, Ksenofontov V, et al. Strong field iron (II) complex converted by light into a long-lived high-spin state. Angew Chem Int Ed. 2000;39:3699–3700. doi: 10.1002/1521-3773(20001016)39:20<3699::AID-ANIE3699>3.0.CO;2-Z
- Moussa NO, Molnar G, Bonhommeau S, et al. Selective photoswitching of the binuclear spin crossover compound {[Fe(bt)(NCS)2]2(bpm)} into two distinct macroscopic phases. Phys Rev Lett. 2005;94:107205. doi: 10.1103/PhysRevLett.94.107205
- Ohkoshi S, Imoto K, Tsunobuchi Y, et al. Light-induced spin-crossover magnet. Nat Chem. 2011;3:564–569. doi: 10.1038/nchem.1067
- Ohkoshi S, Takano S, Imoto K, et al. 90-degree optical switching of output second-harmonic light in chiral photomagnet. Nat Photon. 2014;8:65–71. doi: 10.1038/nphoton.2013.310
- Bertoni R, Lorenc M, Cailleau H, et al. Elastically driven cooperative response of a molecular material impacted by a laser pulse. Nat Mater. 2016;15:606–610. doi: 10.1038/nmat4606
- Tokoro H, Matsuda T, Nuida T, et al. Visible-light-induced reversible photomagnetism in rubidium manganese hexacyanoferrate. Chem Mater. 2008;20:423. doi: 10.1021/cm701873s
- Bleuzen A, Marvaud V, Mathonière C, et al. Photomagnetism in clusters and extended molecule-based magnets. Inorg Chem. 2009;48:3453–3466. doi: 10.1021/ic802007g
- Gütlich P, Garcia Y, Woike T. Photoswitchable coordination compounds. Coord Chem Rev. 2001;219:839–879. doi: 10.1016/S0010-8545(01)00381-2
- Tokoro H, Namai A, Yoshikiyo M, et al. Theoretical prediction of a charge-transfer phase transition. Sci Rep. 2018;8:63. doi: 10.1038/s41598-017-18213-0
- Miyashita S, Konishi Y, Nishino M, et al. Realization of the mean-field universality class in spin-crossover materials. Phys Rev B. 2008;77:014105. doi: 10.1103/PhysRevB.77.014105
- Slimani A, Varret F, Boukheddaden K, et al. Visualization and quantitative analysis of spatiotemporal behavior in a first-order thermal spin transition: a stress-driven multiscale process. Phys Rev B. 2011;84:094442. doi: 10.1103/PhysRevB.84.094442
- Gudyma I, Maksymov A, Enachescu C. Phase transition in spin-crossover compounds in the breathing crystal field model. Phys Rev B. 2014;89:224412. doi: 10.1103/PhysRevB.89.224412
- Fiebig M, Miyano K, Tomioka Y, et al. Visualization of the local insulator–metal transition in Pr0.7Ca0.3MnO3. Science. 1998;280:1925–1928. doi: 10.1126/science.280.5371.1925
- Moya X, Kar-Narayan S, Mathur ND. Caloric materials near ferroic phase transitions. Nat Mater. 2014;13:439–450. doi: 10.1038/nmat3951
- Galán-Mascarós AR, Coronado E, Forment-Aliaga A, et al. Tuning size and thermal hysteresis in bistable spin crossover nanoparticles. Inorg Chem. 2010;49:5706–5714. doi: 10.1021/ic100751a
- Coronado E, Galán-Mascarós AR, Monrabal-Capilla M, et al. Bistable spin-crossover nanoparticles showing magnetic thermal hysteresis near room temperature. Adv Mater. 2007;19:1359–1361. doi: 10.1002/adma.200700559
- Nishino M, Enachescu C, Miyashita S, et al. Macroscopic nucleation phenomena in continuum media with long-range interactions. Sci Rep. 2011;1:162. doi: 10.1038/srep00162
- Larionova J, Salmon L, Guari Y, et al. Towards the ultimate size limit of the memory effect in spin-crossover solids. Angew Chem Int Ed. 2008;47:8236–8240. doi: 10.1002/anie.200802906
- Lopez R, Haynes TE, Boatner LA, et al. Size effects in the structural phase transition of VO2 nanoparticles. Phys Rev B. 2002;65:224113. doi: 10.1103/PhysRevB.65.224113
- Ohkoshi S, Tsunobuchi Y, Matsuda T, et al. Synthesis of a metal oxide with a room-temperature photoreversible phase transition. Nat Chem. 2010;2:539–545. doi: 10.1038/nchem.670
- Tokoro H, Yoshikiyo M, Imoto K, et al. External stimulation-controllable heat-storage ceramics. Nat Commun. 2015;6:7037. doi: 10.1038/ncomms8037
- Szwarcman D, Vestler D, Markovich G. The size-dependent ferroelectric phase transition in BaTiO3 nanocrystals probed by surface plasmons. ACS Nano. 2011;5:507–515. doi: 10.1021/nn102385e
- Chen Y, Schuh CA. Size effects in shape memory alloy microwires. Acta Mater. 2011;59:537–553. doi: 10.1016/j.actamat.2010.09.057
- Tokoro H, Miyashita S, Hashimoto K, et al. Huge thermal hysteresis loop and a hidden substable phase in a charge-transfer phase transition of Rb0.64Mn[Fe(CN)6]0.88·1.7H2O. Phys Rev B. 2006;73:172415. doi: 10.1103/PhysRevB.73.172415
- Yoshimatsu K, Sakata O, Ohtomo A. Superconductivity in Ti4O7 and γ-Ti3O5 films. Sci Rep. 2017;7:12544. doi: 10.1038/s41598-017-12815-4
- Théry V, Boulle A, Crunteanu A, et al. Role of thermal strain in the metal-insulator and structural phase transition of epitaxial VO2 films. Phys Rev B. 2016;93:184106. doi: 10.1103/PhysRevB.93.184106
- Gütlich P, Hauser A, Spiering H. Thermal and optical switching of iron(II) complexes. Angew Chem Int Ed Engl. 1994;33:2024–2054. doi: 10.1002/anie.199420241
- Pershin YV, Di Ventra M. Memory effects in complex materials and nanoscale systems. Adv Phys. 2011;60:145–227. doi: 10.1080/00018732.2010.544961
- Åsbrink S, Magnéli A. Crystal structure studies on trititanium pentoxide, Ti3O5. Acta Cryst. 1959;12:575–581. doi: 10.1107/S0365110X59001694
- Onoda M. Phase transitions of Ti3O5. J Solid State Chem. 1998;136:67–73. doi: 10.1006/jssc.1997.7657
- Marezio M, Dernier PD, McWhan DB, et al. X-ray diffraction studies of the metal insulator transition in Ti4O7, V4O7 and VO2. Mat Res Bull. 1970;5:1015–1024. doi: 10.1016/0025-5408(70)90050-4
- Marezio M, McWhan DB, Dernier PD, et al. Structural aspects of the metal-insulator transitions in Ti4O7. J Sol State Chem. 1973;6:213. doi: 10.1016/0022-4596(73)90184-9
- Lakkis S, Schlenkcr C, Chakravcrty BK, et al. Metal-insulator transitions in Ti4O7 single crystals: crystal characterization, specific heat, and electron paramagnetic resonances. Phys Rev B. 1976;14:1429–1440. doi: 10.1103/PhysRevB.14.1429
- Schlenker C, Marezio M. The order–disorder transition of Ti3+–Ti3+ pairs in Ti4O7 and (Ti1–xVx)4O7. Phil Mag B. 1980;42:453–472. doi: 10.1080/01418638008221887
- Schlenker S, Ahmed S, Buder R, et al. Metal-insulator transitions and phase diagram of (Ti1-xVx)4O7 : electrical, calorimetric, magnetic and EPR studies. J Phys C: Solid State Phys. 1979;12:3503–3521. doi: 10.1088/0022-3719/12/17/021
- Touloukian YS, Kirby RK, Taylor RE, et al. Thermal expansion: nonmetallic solids. New York: IFI/Plenu; 1977.
- Tomuta DG, Ramakrishnan S, Nieuwenhuys GJ, et al. The magnetic susceptibility, specific heat and dielectric constant of hexagonal YMnO3, LuMnO3 and ScMnO3. J Phys: Condens Matter. 2001;13:4543–4552.
- Taguchi M, Chainani A, Matsunami M, et al. Anomalous state sandwiched between Fermi liquid and charge ordered Mott-insulating phases of Ti4O7. Phys Rev Lett. 2010;104:106401. doi: 10.1103/PhysRevLett.104.106401
- Slichter CP, Drickamer HG. Pressure-induced electronic changes in compounds of iron. J Chem Phys. 1972;56:2142–2160. doi: 10.1063/1.1677511
- McHale JM, Auroux A, Perrotta A, et al. Surface energies and thermodynamic phase stability in nanocrystalline aluminas. Science. 1997;277:788–791. doi: 10.1126/science.277.5327.788
- Sakurai S, Namai A, Hashimoto K, et al. First observation of phase transformation of all four Fe2O3 phases (γ → ε → β → α-phase). J Am Chem Soc. 2009;131:18299–18303. doi: 10.1021/ja9046069