
 ?Mathematical formulae have been encoded as MathML and are displayed in this HTML version using MathJax in order to improve their display. Uncheck the box to turn MathJax off. This feature requires Javascript. Click on a formula to zoom.
Abstract
Titanium alloys can experience a cooling-induced phase transformation from a body-centred cubic phase into a hexagonal close-packed phase which occurs in 12 crystallographically equivalent variants. Among them, variant selection II, 60°/, is very close to the orientation of
twins (57.42°/
). We propose that the cyclic thermal loading during additive manufacturing introduces large thermal stresses at high temperature, enabling grain reorientation that transforms the 60°/
variant boundaries into the more energetically stable 57.42°/
twin boundaries. This transformation twinning phenomenon follows a strain accommodation mechanism and the resulting boundary structure benefits the mechanical properties and thermal stability of titanium alloys.
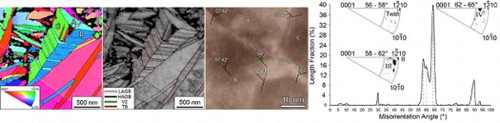
GRAPHICAL ABSTRACT
IMPACT STATEMENT
A new twinning mechanism, transformation twinning, was discovered in a Ti–6Al–4V alloy fabricated by selective laser melting. The resulting high density of transformation twins impact the global mechanical properties significantly.
1. Introduction
Most structural alloys are polycrystalline materials with different types of grain boundaries (GBs). The structures of GBs have an undisputable effect on the mechanical properties of materials. A special type of GBs is twin boundaries (TBs) that separate twins and their matrix. While conventional GBs with random orientation relationships between neighbouring grains hamper the motion of dislocations and therefore strengthen materials, they usually deteriorate the ductility and thermal stability of materials. In contrast, TBs can simultaneously enhance the strength and ductility and do not deteriorate the thermal stability of materials [Citation1–9]. As such, TBs are preferred over random GBs. Depending on their formation mechanism, twins can be classified as growth twins, annealing twins, or deformation twins.
Titanium (Ti) alloys have received significant attention due to their broad applications [Citation10]. Most Ti alloys undergo a phase transformation from the high-temperature body-centred cubic (BCC) β phase to the low temperature hexagonal close-packed (HCP) α (or α’) phase during cooling. The orientations of the resulting HCP grains relative to the BCC parent grains are governed by the Burgers orientation relationship [Citation11], which comprise 12 crystallographic α/α’ variants. The relative fractions of these variants, which are determined by materials processing conditions, affect the overall texture of Ti alloys and therefore their mechanical properties [Citation12,Citation13]. A special type of HCP variant cluster arrangements can easily form to accommodate transformation strain [Citation12,Citation14–16]. The boundaries between adjacent variants within each cluster are variant selection II (V2) boundaries [Citation14] or 60°/ boundaries, i.e. the crystal lattice of one grain coincides with the lattice of the other grain by rotating 60° around their common
axis. The V2 orientation is close to the
(57.42°/
) twin orientation, which share the same rotation axis with only 2.58° misorientation difference. The formation of 57.42°/
twins is known to be associated with the activation of
/
(i.e.
/
in bcc notation) shear systems in titanium alloys and commonly seen inside the primary α’ laths as a result of the β→α’ martensitic phase transformation induced stress [Citation17,Citation18].
There have been significant interests in building Ti alloy components using additive manufacturing (AM) [Citation19–22] because traditional manufacturing methods for Ti alloys suffer from associated high cost of manufacturing, long lead time, and inefficient use of materials [Citation23]. Various features inherent to the AM processes including high thermal stress and annealing effect tend to alter the microstructures of the as-built parts significantly [Citation10,Citation19,Citation24,Citation25]. This provides kinetic conditions that potentially drive structural evolutions to a low energy state. Here, we report that the 57.42°/ twin boundaries can also form via the transformation from the V2 variant boundaries in a martensitic Ti–6Al–4V fabricated by selective laser melting (SLM) [Citation22]. Our discovery reveals a new twinning mechanism, transformation twinning, applicable to other HCP materials that experience a similar BCC to HCP phase transformation. The resulting nano-twinning structure would be beneficial for strain accommodation in additive manufacturing of martensitic Ti alloys and have significant impact on the global mechanical properties of the materials.
2. Experimental procedures
Gas atomized Ti–6Al–4 V powder in the size range of 25–45 µm was used as the feedstock material. A cylindrical bar sample with a diameter of 12 mm and a height of 30 mm was fabricated vertically onto a support structure using an SLM facility (SLM Solutions GmbH, SLM 250 HL) [Citation26]. The powder bed was pre-heated to 200°C and purged with argon until the oxygen level in the chamber was reduced to 100 ppm. The following printing parameters were used: layer thickness 30 µm, hatching space 120 µm, laser power 100 W, scanning speed 375 mm/s, and focal offset distance 0 mm, resulting in a volumetric energy density 74.07 J mm−3. The as-built sample presented carbon and nitrogen contents of 0.012 wt.% and 0.011 wt.%, respectively, which were slightly higher than those in the powder. This could result from the reactions between molten Ti and traces of N2 and CO2 left in the build chamber [Citation22]. To compare the microstructures between the as-printed sample and a conventional cast sample, part of the as-printed sample was kept at 1050°C for 5 min and then water quenched to achieve a complete β to α’ phase transformation.
Specimens with dimensions of 6 × 30 mm2 for scanning electron microscopy (SEM) characterization were cut using a Struers Acctom-50 diamond saw along the build direction, ground using diamond lapping films with diamond grain sizes of 30, 15, 6, 3, and 1 µm and then polished using 0.05 µm oxide dispersion suspension. Disc-shape specimens with a diameter of 3 mm for transmission electron microscopy (TEM) and transmission Kikuchi diffraction (TKD) were sliced perpendicular to the build direction from a bottom layer of the cylinder, ground to a thickness of ∼30 µm followed by ion milling using a Gatan model 691 precision ion polishing system at a temperature of −50°C, beam voltage of 4 kV and milling angle of ±6°. Electron backscatter diffraction (EBSD) and TKD experiments were conducted using a Zeiss Ultra SEM equipped with an EBSD detector working at an acceleration voltage of 20 kV. The step size used for EBSD and TDK experiments are 25 and 5 nm, respectively. Scanning transmission electron microscopy (STEM) experiments were performed using a Thermofisher Scientific Themis-Z double-corrected microscope operating at an acceleration voltage of 300 kV.
3. Results and discussion
Figure (a) presents a TKD phase map, showing only the α’ martensitic phase. The black areas represent unindexed points, probably due to a high density of local defects and/or high strain. No β phase was detected in as-printed specimens due to the high cooling rate introduced during the fabrication process. Figure (b) presents a TKD inverse pole figure (IPF) map taken from a typical α’ variant cluster area in an SLM as-built Ti–6Al–4V alloy specimen. Three variant grains marked with A, B, and C, respectively, form a triangular shaped cluster. This is a typical morphology of variant clusters due to the accommodation of transformation strain [Citation12]. A few red grains are observed at the centre of the cluster, which are other α’ grains of a different orientation. Lamellar structures formed in both grains B and C with two colours presented alternatively in each of the grains and the boundaries of the lamellae are parallel to each other within each grain, exhibiting a typical twin morphology. Part of the GBs between grains A and B, and grains A and C were parallel to the TBs in grains B and C, respectively, indicating that these GB portions could also be TBs. It should be noted that the GBs close to the centre of the variant cluster are no longer parallel to the TBs, indicating this part of the GBs might not be TBs. This hypothesis was confirmed by the GB map in Figure (c) showing three types of GBs in the samples: low-angle GBs (LAGBs) with misorientation angles 2°–10°, high-angle GBs (HAGBs) with misorientation angles > 10° including 60°/ V2 boundaries, and 57.42°/
TBs. LAGBs, HAGBs, V2 boundaries, and TBs are marked with white, black, green, and red lines, respectively. All the parallel lines, marked with red lines, are
TBs with a misorientation of 57.42° and a rotation axis of
. In the boundaries close to the triple junction of the variant cluster, the GBs are marked by green lines and the misorientation between the adjacent grains remains 60°, representing V2 boundaries.
Figure 1. A typical microstructure in the Ti–6Al–4V alloy sample. (a) TKD phase map showing only the α’ phase. (b) TKD IPF map of three differently oriented variants clustered in a triangular shape. The three grains are marked with letters A, B, and C, respectively. A white arrow points to the central area of the clusters. (c) The corresponding GB map showing GB types, in which white, black, green, and red lines indicate low-angle GBs, high-angle GBs, V2 boundaries, and TBs, respectively. (d) and (e) pole figures from the areas marked with the green and blue squares in (c), respectively. The lower part of the
pole figures is further magnified and shown at the bottom of (d) and (e).
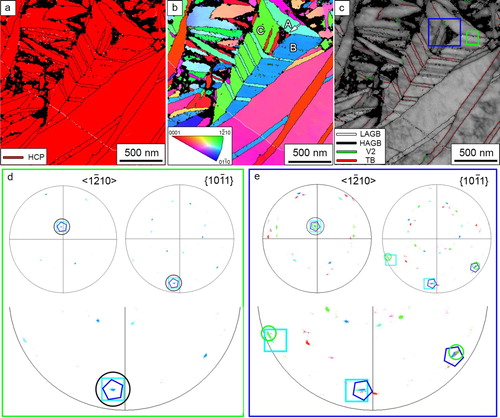
Figure (d) presents the pole figures of directions and
planes from grain A (lime colour) and grain B (blue colour) in the area marked with green square in Figure (c). The circled position indicates that grains A and B shared a common
direction. The lower part of the
pole figure is enlarged at the bottom of Figure (d), showing that a group of data points (circled) perfectly overlap, which indicates that the two grains share one group of
. The two pole figures in Figure (c) clearly demonstrate that grains A and B at the green squared area in Figure (c) formed a
twin relationship.
Figure (e) presents the and
pole figures of grains A (lime colour), B (blue colour) and C (green colour) in the triple junction area marked by the blue square in Figure (c). The lime, blue and green data points corresponds to the pole figures of grains A, B, and C, respectively. Special attention was paid to the points enclosed with lime squares, blue pentagons, and green circles. The circled position in the
pole figure indicates that the three grains share a common
direction. As shown in the enlarged half bottom part of the
plane pole figure, ‘tails’ are observed in the data points, indicating angle variations of some
orientations in the range of ∼ 2.5° between the adjacent grains in this area. Part of the data points shared the same position in
planes, which indicates that parts of the GBs are
TBs but the other parts deviate from the twin relationship.
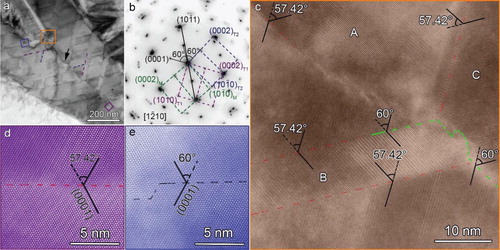
Figure (a) shows a STEM bright-field image taken from the same variant cluster shown in Figure . The boundaries between two adjacent grains are wavy (as pointed out by a black arrow), which could be caused by strain accommodation and atom reshuffling [Citation27]. Primary and secondary twins are observed in the image, in which the secondary TBs are constrained within the primary TBs. Two of the primary and secondary TBs are marked with purple and blue dashed lines, respectively. The average thickness of the primary twins and the spacing between neighbouring twins are ∼30 and ∼63 nm, respectively. The average thickness of the secondary twins and the spacing between neighbouring twins are ∼20 and ∼47 nm, respectively. The secondary twins were not seen in the TKD from Figure (b), owning to their small twin dimensions that were beyond the spatial resolution limit of TKD. A corresponding selected area electron diffraction (SAED) pattern is shown in Figure (b), which provides clear crystallographic evidence of the twined structure. The green, purple, and blue rectangles mark the reciprocal lattices from the matrix (M), primary twins (T1), and secondary twins (T2), respectively. Besides twined diffraction spots, three sets of {0001} planes are observed with a misorientation of 60°, indicating the existence of three V2 boundaries. Figure (c) presents an STEM high-angle annular dark-field (HAADF) image taken from the orange square (centre) area in Figure (a). Conventional (60°/) HAGBs and
(57.42°/
TBs) are marked by green dashed lines and red dashed lines, respectively. In the centre of the variant cluster, the GBs are V2 boundaries. The misorientation of GBs changed gradually from 60° in around the triple junction to 57.42° away from the triple junction, resulting in the transition from 60° conventional HAGBs to 57.42° TBs. Figure (d,e) presents STEM-HAADF images taken from the purple and blue square areas in Figure (a), showing the feature of TBs and V2 boundaries, respectively. Energy-dispersive X-ray spectroscopy mapping conducted in twinned areas presented homogeneous elemental distribution.
Figure 2. TEM analysis of a variant cluster area. (a) A STEM bright-field image taken from the same area as in Figure . Purple dashed lines and blue dashed lines mark primary and secondaries TBs, respectively. A black arrow points to the curved GBs between two clusters. (b) A corresponding SAED pattern generated from (a). Reciprocal lattices from the matrix, primary twins and secondary twins are marked with green, purple, and black dash lines, respectively. STEM-HAADF images taken from the orange, red, and blue square areas in (a) are shown in (c), (d) and (e), respectively. Red and green dashed lines marked TBs and V2 boundaries, respectively, in (c).
The abovementioned transition from V2 inter-variant boundaries to TBs has never been reported before to our best knowledge. To confirm whether the microstructure is unique to AM Ti alloys, part of the SLM sample was heated to 1050°C, which is above the β transus temperature, followed by water quenching to room temperature, resulting in α’ martensitic phase fully. GBs analysis was then conducted on the water-quenched sample. Figure (a) shows an EBSD IPF map of a typical variant cluster area in the water-quenched sample. Three grains with blue, purple, and green colours and marked with A, B, and C, respectively, formed a commonly seen triangular morphology [Citation12]. Figure (b) presents the corresponding GB map of Figure (a). LAGBs, HAGBs, V2 boundaries, and TBs are marked with white, black, green, and red lines, respectively. Misorientation profile showed that the misorientation among the adjacent three variant grains A, B, and C were 60°. Figure (c,d) shows the and
pole figures of the three grains. The blue, purple and green data points are from grains A, B, and C, respectively. Special attention is paid to the data points marked enclosed with blue circles, purple pentagons, and green squares. The circled position in Figure (c) indicates that the three grains shared one common
direction. Figure (d) shows that none of the data points shares the same position in
planes, indicating the GBs are not TBs. The rotation axis of the three GBs is
, and the misorientation between the adjacent grains are measured to be 60° according to the misorientation profile. It is, therefore, concluded that the GBs in the three-variant cluster area are typical V2 inter-variant boundaries in the water-quenched sample.
Figure 3. Microstructure in the water-quenched sample. (a) An EBSD IPF map showing three differently oriented variants clustered in a triangle shape. The three grains are marked as A, B, and C, respectively. (b) The corresponding GB map. White, black, green, and red lines mark LAGBs, HAGBs, V2 boundaries, and TBs, respectively. (c) and (d) The and
pole figures, respectively, of grains A, B, and C revealing the three grains are separated by three 60°/
V2 inter-variant boundaries.
![Figure 3. Microstructure in the water-quenched sample. (a) An EBSD IPF map showing three differently oriented variants clustered in a triangle shape. The three grains are marked as A, B, and C, respectively. (b) The corresponding GB map. White, black, green, and red lines mark LAGBs, HAGBs, V2 boundaries, and TBs, respectively. (c) and (d) The 12¯10 and {101¯1} pole figures, respectively, of grains A, B, and C revealing the three grains are separated by three 60°/[12¯10] V2 inter-variant boundaries.](/cms/asset/65fd04cd-b358-44d1-a9d5-2b1269592d08/tmrl_a_1850536_f0003_oc.jpg)
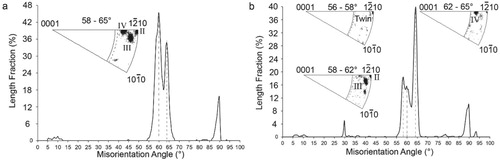
A structural survey from large areas indicates that the transition from V2 inter-variant boundaries to TBs is very common in the SLM fabricated sample. The data was extracted from EBSD experiments so that only inter-variant boundaries were counted. The thermal stress-induced deformation twins in a single α’ grain were effectively excluded from the statistics below because the low spatial resolution EBSD was not able to detect them. Figure (a,b) presents the misorientation distribution of GBs in the water-quenched and the SLM samples, respectively. Peaks at ∼10°, ∼60°, ∼64°, and ∼90° correspond to V1, V2 and V3, V4, and V5 GBs, respectively [Citation12,Citation14]. In Figure (a), the V2 and V3 boundaries present the highest peak, representing 45% of the total boundary length. This distribution matches in general very well with the literature reports on typical variant distributions in Ti–6Al–4V [Citation12,Citation14]. However, in the SLM sample, the V2 and V3 peaks at ∼60° dropped significantly to ∼15%, populations of V4 and V5 remained at same levels, while a new peak from
twins at ∼57° appeared now representing about 17% of length fraction, indicating the extensive transformation of 60° GBs to 57.42° TBs. Although the ∼60° peak comes from 60°/
V2 GBs and 60.83°/
V3 GBs, only V2 GBs can transform into the
TBs because they share the same rotation axis. Some extra peaks were observed in the SLM sample, i.e. ∼30° and ∼93°, which were picked up as small dots in GB maps. The sources of the peaks have not been clear and are not important for this study.
Figure 4. Misorientation profiles generated from EBSD data for (a) the water-quenched sample, and (b) the SLM sample.
The BCC to HCP phase transformation induced during the cooling process of Ti alloys is governed by the Burgers orientation relationship, which leads to the formation of 12 structural variants of the HCP phase. The impingement of the 12 variants results in only for 5 distinct grain boundary misorientations between the HCP grains transformed from an individual prior BCC grain. Table shows the rotation angle and rotation axis for these 5 inter-variant GBs and all the twinning systems in HCP Ti alloys [Citation28–30]. It is clear that only V2 boundaries share the same rotation axis and the misorientations are close to a twinning system, which is the twins. Therefore, transformation from variant GBs to TBs only occurs from V2 GBs to
TBs.
Table 1. Misorientation angle and rotation axis for each type of inter-variant boundaries and twinning systems in HCP Ti [Citation14,Citation28–30].
Theoretically, the thermal stability of a TB is superior to that of a conventional HAGB as the energy stored at TBs is an order of magnitude lower than at conventional HAGBs [Citation1]. However, the twins are not commonly seen in the annealed Ti alloys or those slowly cooled from high temperature beta phase region (i.e. transformed lamellar α+β structure). The development of
nano-twins was only reported in rapidly quenched Ti alloys, where the local strain might be high enough to trigger shear deformation of α/α’ laths [Citation18,Citation31]. Still, no direct transformation from the V2 GBs has been reported in literatures. The very small misorientation between V2 GBs and
TBs (only 2.58°) around a
rotational axis and the higher energy of V2 GBs indicate that V2 inter-variant GBs could transform into
TBs if kinetic conditions allow.
Comparison of GB structures in variant clusters in the as-quenched and SLM samples clearly indicate that the BCC to HCP phase transformation and associated strain do not lead to the transformation of V2 GBs to TBs in a rapid cooling process. On the contrary, the SLM printing is a layer-by-layer melting process, which comprises a cyclic reheating and cooling thermal history and complex thermal stress profile. After rapid solidification and cooling resultant β→α’ transformation in a powder melting process, the solidified α’ layer can be reheated to high temperature during subsequent printing that allows easy atomic motion, while the thermal stress during cyclic thermal loading can provide the external force for atomic rearrangement, promoting the transformation from conventional GBs to TBs. The high thermal stress during the SLM process is evidenced by the observed high density of deformation twins (Figure (a)). While dislocations are sometimes observed in areas where V2 GBs gradually transformed to TBs, they were not enough to fully accommodate the 2.58° angle variation between the GBs and TBs. Therefore, it is believed that local lattice strain also contributes to the accommodation of misorientation between V2 GBs and
TBs. A similar phenomenon exists in five-fold twins in metals with face-centred cubic structures in which lattice strain is available to accommodate a 7.33° gap in the five-fold twins (70.53° × 5 = 352.67°, which is 7.33° away from 360°) [Citation27,Citation32]. As lattice distortion introduces large strain energy, this prevented complete V2 GBs conversion to
. TBs. Therefore, residual V2 GBs exist at triple junction areas as indicated in Figure (c).
As shown in Figure (c), it is quite common that some original V2 GBs that had been converted to TBs are parallel to the boundaries of
deformation twins. This indicates that atomic reshuffling at the original V2 GBs also occurred during the transformation from V2 GBs to
TBs and this requires thermal activation at high temperature.
Twins are usually classified as growth twins, annealing twins, or formation twins, depending on their formation mechanism. Growth twins form at the solidification process of materials. Annealing twins develop during the recrystallization process of deformed materials. Deformation twins are introduced inside individual grains by plastic deformation. The TBs transformed from the original V2 GBs via the reorientation of a small angle (2.58°) around their shared
axis during cyclic thermal loadings, which does not belong to any of the above categories. Therefore, it is termed transformation twins. The transformation twinning mechanism could occur not only in Ti alloys but also in other alloys, e.g. Zirconium29, that undergoes a BCC to HCP transformation during cooling. This twinning mechanism could be unique to processes in which high temperature and high enough (thermal) stress are available.
As a significant amount of V2 GBs had transformed into TBs, this transformation should have significant impact on the properties of the materials. While it is very difficult to quantitatively evaluate the effects of TBs on the properties of Ti–6Al–4V studied here because of the many variables in microstructures that are not controllable during SLM processing, it has been well accepted that, different from conventional GBs, TBs not only strengthen materials but also improve ductility and thermal stability of materials and therefore are preferred boundaries [Citation5–7].
4. Conclusions
A new type of twinning mechanism has been discovered in a Ti–6Al–4V produced by SLM. twins with the 57.42°/
orientation relationship form via the transformation from grains with the variant II orientation relationship of 60°/
. The 2.58° misorientation between V2 GBs and the TBs can be accommodated via dislocations and local lattice strains resulting from the complex thermal history and associated stress in SLM printing of a martensitic Ti–6Al–4V alloy. The combination of in-situ heating (via heat accumulation) and martensitic transformation/rapid cooling resultant stress is essential for atomic reshuffling at the original V2 GBs which facilitates the transformation process from V2 GBs to
TBs. We therefore refer to this twinning as transformation twinning. It is expected that the resulting high density of transformation twins can have significant impacts on the global mechanical properties of additively manufactured Ti alloys.
Acknowledgements
The authors acknowledge the scientific and technical input and support from the Microscopy Australia node at the University of Sydney (Sydney Microscopy & Microanalysis). This project is supported by the Australia–US Multidisciplinary University Research Initiative program. XZL is also supported by the Australian Research Council [DP190102243], WX by [DP150104719], and SP by [DE180100440].
Disclosure statement
No potential conflict of interest was reported by the author(s).
Additional information
Funding
References
- Zhang X, Misra A. Superior thermal stability of coherent twin boundaries in nanotwinned metals. Scr Mater. 2012;66:860–865.
- Zhu YT, Liao XZ, Wu XL. Deformation twinning in nanocrystalline materials. Prog Mater Sci. 2012;57:1–62.
- Wang J, Beyerlein IJ. Atomic structures of symmetric tilt grain boundaries in hexagonal close packed (hcp) crystals. Model Simul Mater Sci Eng. 2012;20:024002.
- Wang J, Liu L, Tomé CN, et al. Twinning and de-twinning via glide and climb of twinning dislocations along serrated coherent twin boundaries in hexagonal-close-packed metals. Mater Res Lett. 2013;1:81–88.
- Zhao YH, Bingert JF, Liao XZ, et al. Simultaneously increasing the ductility and strength of ultra-fine-grained pure copper. Adv Mater. 2006;18:2949–2953.
- Lu L, Chen X, Huang X, et al. Revealing the maximum strength in nanotwinned copper. Science. 2009;323:607–610.
- Lu K, Lu L, Suresh S. Strengthening materials by engineering coherent internal boundaries at the nanoscale. Science. 2009;324:349–352.
- Yu Q, Qi L, Chen K, et al. The nanostructured origin of deformation twinning. Nano Lett. 2012;12:887–892.
- Yu Q, Shan ZW, Li J, et al. Strong crystal size effect on deformation twinning. Nature. 2010;463:335–338.
- Herzog D, Seyda V, Wycisk E, et al. Additive manufacturing of metals. Acta Mater. 2016;117:371–392.
- Burgers WG. On the process of transition of the cubic-body-centered modification into the hexagonal-close-packed modification of zirconium. Physica. 1934;1:561–586.
- Farabi E, Hodgson PD, Rohrer GS, et al. Five-parameter intervariant boundary characterization of martensite in commercially pure titanium. Acta Mater. 2018;154:147–160.
- Guo Y, Britton TB, Wilkinson AJ. Slip band-grain boundary interactions in commercial-purity titanium. Acta Mater. 2014;76:1–12.
- Beladi H, Chao Q, Rohrer GS. Variant selection and intervariant crystallographic planes distribution in martensite in a Ti-6Al-4V alloy. Acta Mater. 2014;80:478–489.
- DeMott R, Collins P, Kong C, et al. 3D electron backscatter diffraction study of α lath morphology in additively manufactured Ti-6Al-4V. Ultramicroscopy. 2020;218:113073.
- Stephenson PL, Haghdadi N, DeMott R, et al. Effect of scanning strategy on variant selection in additively manufactured Ti-6Al-4V. Addit Manuf. 2020;36:101581.
- Lütjering G, Williams JC. Titanium. 2nd ed. Berlin: Springer-Verlag; 2005.
- Chao Q, Hodgson PD, Beladi H. Ultrafine grain formation in a Ti-6Al-4V alloy by thermomechanical processing of a martensitic microstructure. Metall Mater Trans A. 2014;45:2659–2671.
- Wang YM, Voisin T, McKeown JT, et al. Additively manufactured hierarchical stainless steels with high strength and ductility. Nat Mater. 2018;17:63–71.
- Liu L, Ding Q, Zhong Y, et al. Dislocation network in additive manufactured steel breaks strength–ductility trade-off. Mater Today. 2018;21:354–361.
- Wu J, Wang XQ, Wang W, et al. Microstructure and strength of selectively laser melted AlSi10Mg. Acta Mater. 2016;117:311–320.
- Xu W, Brandt M, Sun S, et al. Additive manufacturing of strong and ductile Ti-6Al-4V by selective laser melting via in situ martensite decomposition. Acta Mater. 2015;85:74–84.
- Thijs L, Verhaeghe F, Craeghs T, et al. A study of the microstructural evolution during selective laser melting of Ti-6Al-4V. Acta Mater. 2010;58:3303–3312.
- Gorsse S, Hutchinson C, Gouné M, et al. Additive manufacturing of metals: a brief review of the characteristic microstructures and properties of steels, Ti-6Al-4V and high-entropy alloys. Sci Technol Adv Mater. 2017;18:584–610.
- Wang H, Zhu ZG, Chen H, et al. Effect of cyclic rapid thermal loadings on the microstructural evolution of a CrMnFeCoNi high-entropy alloy manufactured by selective laser melting. Acta Mater. 2020;196:609–625.
- Xu W, Lui EW, Pateras A, et al. In situ tailoring microstructure in additively manufactured Ti-6Al-4V for superior mechanical performance. Acta Mater. 2017;125:390–400.
- Zhu YT, Liao XZ, Valiev RZ. Formation mechanism of fivefold deformation twins in nanocrystalline face-centered-cubic metals. Appl Phys Lett. 2005;86:1–3.
- Bozzolo N, Chan L, Rollett AD. Misorientations induced by deformation twinning in titanium. J Appl Crystallogr. 2010;43:596–602.
- Chen YJ, Li YJ, Walmsley JC, et al. Microstructural heterogeneity in hexagonal close-packed pure Ti processed by high-pressure torsion. J Mater Sci. 2012;47:4838–4844.
- Song SG, Gray GT. Structural interpretation of the nucleation and growth of deformation twins in Zr and Ti—I. Application of the coincidence site lattice (CSL) theory to twinning problems in h.c.p. structures. Acta Metall Mater. 1995;43:2325–2337.
- Williams JC, Tasggart R, Polonis DH. The morphology and substructure of Ti-Cu martensite. Met Trans. 1970;1:2265–2270.
- Hall CR, Fawzi SAH. On the occurrence of multiply twinned particles in electrodeposited nickel films. Philos Mag A. 1986;54:805–820.