
Abstract
The oxidation behavior of Cr2AlC MAX phase coatings with columnar and equiaxed morphologies is compared. After oxidation at 1100°C for 240 min the Cr2AlC MAX phase coatings with equiaxed grains showed a 20% lower scale thickness and a 52% larger scale grain size as the coatings with columnar grains. Transmission electron microscopy data suggests that this is primarily caused by nanopores (2–25 nm) present in the columnar grain boundaries. As their presence has previously been overlooked, a 20% improvement of the high temperature oxidation behavior of Cr2AlC coatings is obtained if the formation of nanopores is avoided.
GRAPHICAL ABSTRACT
IMPACT STATEMENT
This is the first report on the formation of nanopores at grain boundaries of Cr2AlC coatings and their implications for the oxidation behavior. Avoiding the previously overlooked presence of nanopores at the grain boundaries of the as grown coatings enables a significant improvement in high temperature oxidation behavior of Cr2AlC coatings.
KEYWORDS:
Introduction
MAX phases (Mn + 1AXn, where M is an early transition metal, A is a group A element, X is carbon or nitrogen) have attracted considerable attention as a potential candidate for high temperature structural applications [Citation1–3]. This can be ascribed to their performance when exposed to high temperature and extreme environments [Citation1]. In particular, Ti2AlC and Cr2AlC exhibit excellent high temperature oxidation resistance due to the formation of a dense, protective and spallation resistant alumina layer [Citation4–7]. While Lin et al. suggested a parabolic rate constant [Citation5], Tallmann et al. established that the high temperature oxidation kinetics of Cr2AlC is not parabolic [Citation4,Citation5,Citation8]. In fact, the oxidation behavior of Cr2AlC is complex and has been described as close to cubic rate law dependence at 1200°C while at 700, 900, and 1300°C significantly slower oxidation kinetics have been observed. Smialek et al. further revealed that diffusion of oxygen and/or aluminum along the alumina grain boundaries is the rate controlling mechanism and brings about cubic kinetics for Ti2AlC and Cr2AlC [Citation4,Citation9]. In addition, Li et al. have investigated the influence of initial grain sizes on the oxidation behavior of bulk Cr2AlC and reported that the oxidation rate of the fine grained sample (2 μm) is faster than that of the coarse grained sample (60 μm). The authors propose that the fine grained Cr2AlC with a larger number of grain boundaries per volume provides a larger number of diffusion pathways for oxygen and/or aluminum than the coarse grained sample with a lower number of grain boundaries per volume [Citation10]. Additionally, it was also widely reported that the intermediate Cr7C3 layer is formed beneath the scale layer, due to the oxidation-induced depletion of Al in Cr2AlC [Citation11,Citation12]. While the effect of macro-porosity on mechanical properties of MAX phase foams has been reported [Citation13,Citation14] the influence of morphology at the nanometer scale on the oxidation behavior of MAX phase coatings is so far unexplored. Here we report the nanoporosity-dependent oxidation behavior of Cr2AlC coatings for the first time.
Experimental details and methods
The Cr2AlC coatings were synthesized by DC magnetron sputtering in an industrial chamber (CC800/9, CemeCon AG, Wuerselen, Germany) where a compound target (supplied by Plansee Composite Materials GmbH) with a Cr:Al:C composition of 2:1:1 was used. All coatings were deposited at an Ar partial pressure of 190 mPa onto single crystalline MgO substrates (Crystal GmbH, Berlin, Germany) which were kept at floating potential. The applied target power density of 2.3 W/cm2 resulted in coating thicknesses of approximately 4 μm for a deposition time of 45 min. Two different approaches were employed: while the first batch of Cr2AlC was deposited at 580°C substrate temperature, the second batch was deposited without intentional substrate heating. This low temperature growth strategy resulted in the formation of X-ray amorphous coatings which were subsequently annealed at 600°C in a vacuum furnace evacuated to 0.15 mPa. According to Stelzer et al. [Citation15] this results in the formation of Cr2AlC MAX phase. Further deposition methodology related details can be found in [Citation15]. Energy dispersive X-ray spectroscopy (EDX) data were acquired using an Oxford system within FEI Quanta 250F scanning electron microscope at an acceleration voltage of 12 kV.
The local chemical composition at the nanometer scale was investigated for the as-deposited and as-annealed samples by 3D atom probe tomography (APT). Laser-assisted field evaporation was utilized within a local electrode atom probe (LEAP 4000X HR, CAMECA) and laser pulse energy, laser pulse frequency, base temperature and detection rate were 30 pJ, 250 kHz, 60 K and 0.5%, respectively. The tips were extracted along the growth direction. Data reconstruction and analysis were carried out using the IVAS 3.8.0 software.
Coatings deposited with the two different approaches were simultaneously oxidized in a furnace (F40–200/13, GERO) at 1100°C in air. The oxidation behavior was investigated for annealing times of 1, 3, 5, 10, 30, and 240 min. Each oxidation experiment was carried out using as deposited samples from the two batches.
Both, cross-section and plan-view transmission electron microscopy (TEM) foils were prepared in a focused ion beam/scanning electron dual beam microscope (Helios NanoLab 660 from FEI, Hillsborough, USA). A platinum layer was deposited on the film surface to protect against beam damage. Scanning transmission electron microscopy (STEM) images and high angle annular dark field (HAADF) images were taken with an acceleration voltage of 30 kV and a beam current of 100 pA in the above system. Moreover, transmission Kikuchi diffraction (TKD) scans were performed with an acceleration voltage of 30 kV in the above dual beam system and a beam current of 1.6 nA to acquire crystallographic orientation data. TKD analysis was carried out using EDAX OIMTM Analysis 8 software. Conventional and high-resolution TEM (HRTEM) were both conducted at an acceleration voltage of 300 kV with an FEI Titan 80–300 microscope equipped with an imaging spherical aberration corrector element.
Results and discussion
Figure shows the morphology, orientation distribution as well as oxygen impurity distribution at the nanometer scale of the as-deposited and the as-annealed coatings. For the as-deposited sample, which was grown at 580°C substrate temperature, the cross-section STEM image shows a typical columnar morphology with a grain size of approximately 180 nm and a length of about 2.5 μm (Figure a). Corresponding TKD measurements (Figure b) reveal that the columns exhibit a (0001) preferred orientation. Cr, Al, and C elemental maps (Figure S1a) measured by APT along the growth direction of the coating with columnar morphology appear to be randomly distributed. However, O-rich regions are observable along the growth direction of the columns and as the O concentration increases locally from < 0.5 at.% up to 6 at.%, the Al concentration also increases from 27 to 44 at.% (Figure e). It is reasonable to assume that these O impurities stem from residual gas incorporated during growth [Citation16] and/or from atmosphere exposure after growth [Citation17]. It is unclear if the oxygen segregates at grain boundaries and/or at other segregation sites.
Figure 1. (a-b) A typical STEM bright field image (a) and corresponding inverse pole figure map (b) of the cross-section of an as-deposited, columnar Cr2AlC MAX phase coating. The orientation is color coded according to the inset legend triangle in (b). Texture analysis is plotted on inverse pole figure in reference to the growth direction (indicated by the arrows). The corresponding color bar is given in terms of the multiple of uniform density. (c-d) Cross-section STEM image (c) and corresponding TKD orientation map (d) of the as-annealed, equiaxed coating. The inset legend triangle in (d) indicates the orientation color bar. (e) Atomic positions of O of the as-deposited sample with columnar morphology. O-rich regions with concentrations ≥ 2 at.% are highlighted by cyan regions and the proximity histogram. (f) Atomic positions of O in the as-annealed, equiaxed coating. O-rich regions with concentrations ≥ 20 at.% are highlighted by cyan regions and the proximity histogram.
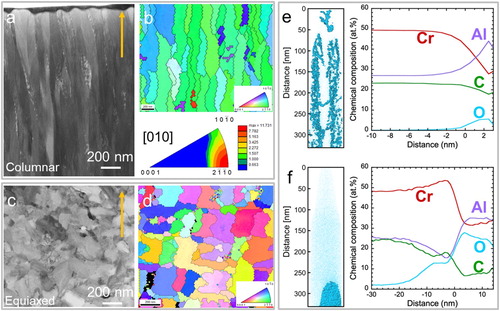
For the as-annealed sample, the cross-section image indicate equiaxed grains (Figure c). The average grain size is about 180 nm in the equiaxed sample, comparable to the column diameter of the columnar samples. The TKD mapping shows that the MAX phase grains are randomly oriented (Figure d). The measured local distribution of Cr, Al, and C in the equiaxed sample appears to be random, similar to the columnar sample (Figure S1b). However, spatially-confined O-rich regions with up to 28 at.% are observed with Al concentration of up to 35 at.% (Figure f). In addition, the O concentration of the matrix is with 2 at.% significantly higher than in the as-deposited sample with columnar morphology. Since the O impurities after thin film growth (without intentional substrate heating) are typically < 1 at.%, the larger O concentration within the matrix is expected to originate from residual gas in the vacuum furnace. However, the integral oxygen concentration, as determined by EDX, indicates no significant difference between the equiaxed (2.4 ± 0.9 at.%) and columnar samples (2.2 ± 0.7 at.%).
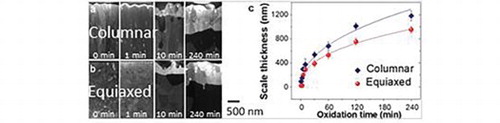
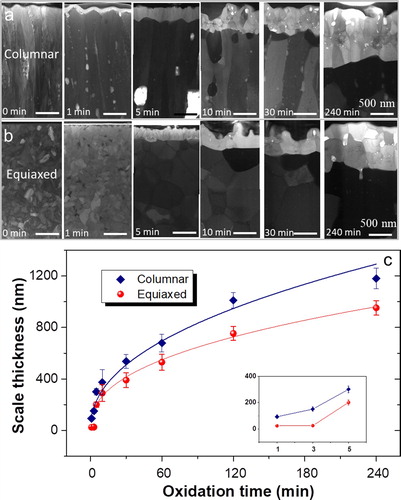
To systematically investigate similarities and differences in oxidation behavior between the columnar and the equiaxed coatings, FIB cross-sections were prepared before and after oxidation. After 1 min oxidation, an alumina layer with a thickness of about 90 nm is formed on the columnar coatings while a scale thickness of only about 25 nm is formed on the equiaxed grained coatings (Figure a and b). The scale thickness increases gradually with prolonged oxidation time for both samples (see Figure c). It is interesting to note that the measured scale thickness of the equiaxed coating is for all here investigated oxidation times smaller than that of the columnar. For instance, the equiaxed coating shows a 20% lower scale thickness than the columnar sample after 240 min of oxidation. A power fit to the data presented in Figure c yields a time exponent of 0.4 and 0.45 for the equiaxed and columnar samples, respectively. It is important to keep in mind that these data represent the onset of oxidation, while the data discussed by Tallman et al. [Citation4] reflects the long-term oxidation (up to one year) behavior with time exponents ranging from 0.18 at 1000°C to 0.46 at 800°C. These differences in time exponents may be rationalized by considering that the onset of oxidation is initially defined by nucleation and growth of the alumina layer and only at a later stage the long-term oxidation behavior is governed by grain boundary diffusion (Figure a and b).
Figure 2. (a-b) STEM bright field images (Helios) of the cross-sections of columnar (a) and equiaxed (b) grained Cr2AlC coatings before oxidation and after oxidation at 1100°C from 1 to 240 min. The measured scale thickness is plotted as a function of oxidation time for each sample. (c) Variation of the oxide scale thickness with oxidation time and corresponding power law fit in the equiaxed and columnar grained samples. The inset in (c) shows the initial scale thickness from 1 to 5 min.
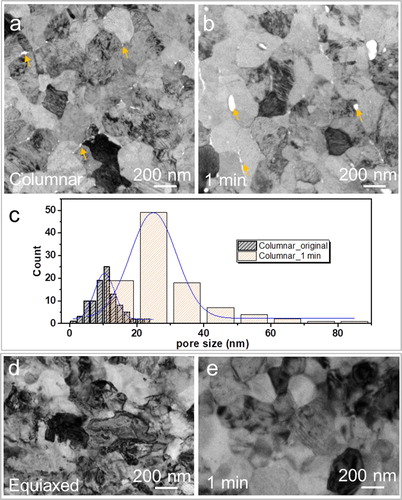
Plan-view TEM characterization was carried out to further examine the differences in oxidation behavior between the coatings with columnar and equiaxed morphologies. Interestingly, the images reveal the presence of nm-scale pores at the grain boundaries in the coating with columnar morphology (Figure a). The measured pore sizes span from 2 to 25 nm (Figure c). After 1 min oxidation, the average pore size increases from 10 nm in the as-deposited sample to 25 nm and the measured pore sizes span from 10 to 90 nm (Figure a-c). In contrast, no voids can be identified in the equiaxed grained coatings before and after oxidation for 1 min (Figure d and e). In addition, Figure S2 exhibits the cross-section features of Cr2AlC coatings before and after oxidation. It is evident that oxidation is accompanied by the formation of pores in the columnar sample and that prolonged oxidation results in the increased pore sizes. After 30 min oxidation the pores exhibit sizes of up to 500 nm, while after 240 min the pore size increases to maximum values of 720 nm. In sharp contrast to this behavior specific to the columnar morphology, no pore formation is detected in the equiaxed samples not even after oxidation for 240 min.
Figure 3. (a, b) Plan-view TEM images of the as-deposited, columnar Cr2AlC MAX phase coating before (a) and after 1 min (b) oxidation at 1100°C. (c) Statistical distributions of the pore size measured in (a) and (b). (d-e) Plan-view TEM images of the as-annealed, equiaxed coating before (c) and after 1 min (d) oxidation at 1100°C.
In an effort to identify the distinct difference in oxidation kinetics, STEM-HAADF and HRTEM imaging were performed on the equiaxed and columnar samples in the early stages of oxidation, as shown in Figure . Comparing the oxidation behavior after 1 min of the two samples with different morphologies, the contrast difference in the STEM-HAADF image of the columnar sample (Figure a) is consistent with diffusional transport along the grain boundaries, while in the equiaxed sample no such contrast changes are visible (Figure e). It may be speculated that this is due to the denser grain boundaries in the equiaxed coatings as compared to the columnar boundaries which are clearly susceptible to oxidation. The HRTEM image and corresponding Fast Fourier Transform (FFT) patterns (Figure b-d) show that a crystalline alumina layer with a thickness of about 90 nm is formed on the MAX phase grains in the columnar sample. Interestingly, in the equiaxed sample, the scale layer (about 25 nm in thickness) adjacent to the MAX phase is composed of a mixture of amorphous (Figure h) and crystalline phases (Figure i) as shown in the HRTEM and corresponding FFT patterns (Figure f-i). After 5 min oxidation, a fully crystalline layer forms in both, the columnar (Figure j) and the equiaxed sample (Figure l). HRTEM and corresponding FFT images in the oxide scale of the columnar (Figure k, 300 nm thick) and equiaxed (Figure m, 190 nm thick) indicate the formation of α-Al2O3.
Figure 4. STEM-HAADF images (Titan) of the columnar (a) and equiaxed (e) grained samples upon oxidation at 1100°C for 1 min. (b) HRTEM image of the columnar grained sample taken from the [0001] direction. (c-d) Corresponding FFT images in the dashed boxes as indicated in (b). (f) HRTEM image of the equiaxed grained sample taken from the [10-10] direction. (g-i) FFT images inside the boxes as indicated in (f). The dashed line outlines the interface between the MAX phase and the oxide scale. TEM images of the columnar (j) and equiaxed (l) grained samples upon oxidation at 1100°C for 5 min. HRTEM and corresponding FFT images in the oxide scale of the columnar (k) and equiaxed (m) samples.
![Figure 4. STEM-HAADF images (Titan) of the columnar (a) and equiaxed (e) grained samples upon oxidation at 1100°C for 1 min. (b) HRTEM image of the columnar grained sample taken from the [0001] direction. (c-d) Corresponding FFT images in the dashed boxes as indicated in (b). (f) HRTEM image of the equiaxed grained sample taken from the [10-10] direction. (g-i) FFT images inside the boxes as indicated in (f). The dashed line outlines the interface between the MAX phase and the oxide scale. TEM images of the columnar (j) and equiaxed (l) grained samples upon oxidation at 1100°C for 5 min. HRTEM and corresponding FFT images in the oxide scale of the columnar (k) and equiaxed (m) samples.](/cms/asset/e5e0e0b4-e1d7-4b13-90ea-0635166f7609/tmrl_a_1854358_f0004_oc.jpg)
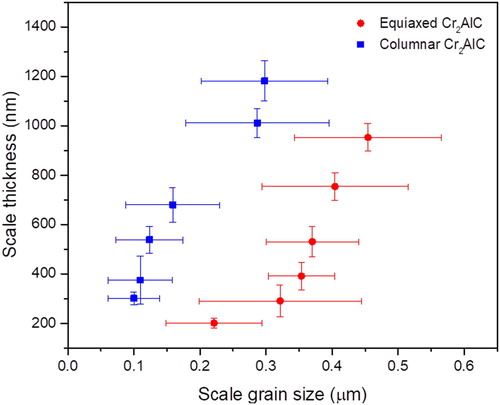
Furthermore, the averaged scale grain size increases with the increasing scale thickness upon prolonged oxidation time from 5 to 240 min for each sample, as measured in Figure . 52% coarser alumina grains are formed on the equiaxed sample compared to the columnar grained one upon prolonged oxidation at 1100°C for 240 min. It is reasonable to assume that the smaller number of scale grain boundaries per unit volume results in the larger scale thickness observed for the columnar grained sample. The formation of chromium carbides in the interfacial region between oxide scale and MAX phase is inferred based on the contrast difference in SEM imaging (Figure S2) for oxidation times > 10 min in equiaxed as well as in columnar samples. In addition, dark field images of the columnar (a) and equiaxed (b) Cr2AlC coatings after oxidation at 1100°C for 5 min are shown in Figure S3. The selected area electron diffraction patterns indicate the existence of the MAX phase grain beneath the scale layer at the onset of oxidation. As the oxidation time is increased to 10 min, the formation of Cr7C3 grains is inferred from the energy dispersive spectroscopy data indicating local Cr enrichment in the presence of C and concurrent Al depletion below the α-Al2O3 layer in the columnar coating (Figure S4), as. The here inferred chromium carbide formation during oxidation of Cr2AlC coatings is in agreement with previous reports [Citation11]. While it is reasonable to assume that the crystallographic orientation affects the oxidation behavior, it was shown by Li et al. [Citation10] that the oxidation kinetics is strongly affected by the grain size of the Cr2AlC MAX phase and hence by the number of grain boundaries per volume. As stated above, the average grain size is about 180 nm for the equiaxed sample which is comparable to the column diameter of the columnar samples.
Figure 5. Variation of scale thickness with scale grain size in the equiaxed and columnar grained Cr2AlC samples upon oxidation at 1100°C from 5 to 240 min.
From the discussion above it can be learned that the temporal evolution of the scale thickness and scale grain size data suggests that the presence of nanopores at the grain boundaries of Cr2AlC enhances the oxidation kinetics. This is also inferred from the oxidation time resolved local structure and local composition data. Hence, the present study demonstrates that the oxidation behavior of Cr2AlC MAX phase coatings can be improved by eliminating the nanoporosity in the grain boundaries.
Conclusion
In this study the oxidation behavior of Cr2AlC coatings with equiaxed and columnar morphologies was compared. The Cr2AlC coatings with equiaxed grains showed a 20% lower scale thickness and a 52% coarser scale grain size as the coating with columnar grains upon oxidation at 1100°C for 240 min. It was observed that the initial coating morphology specifically the nanopores present at the grain boundaries of the columnar coatings affect the oxide scale thickness and scale grain size. Hence, avoiding the previously overlooked presence of nanopores at the grain boundaries of the as grown coatings causes a 20% improvement of the high temperature oxidation behavior of Cr2AlC coatings. This study reveals untapped potential in improving the oxidation behavior of MAX phase coatings by affecting the morphology evolution at the nanometer scale of coatings identical in chemical composition and crystal structure.
Supplemental Material
Download MS Word (1.6 MB)Disclosure statement
No potential conflict of interest was reported by the author(s).
Additional information
Funding
References
- Barsoum MW. Mn+1AXn phases: a new class of solids; thermodynamically stable nanolaminates. Prog Solid State Chem. 2000;28(1-4):201–281.
- Eklund P, Beckers M, Jansson U, et al. The Mn+1AXn phases: Materials science and thin-film processing. Thin Solid Films. 2010;518(8):1851–1878.
- Music D, Schneider JM. The correlation between the electronic structure and elastic properties of nanolaminates. JOM. 2007;59(7):60–64.
- Tallman DJ, Anasori B, Barsoum MW. A critical review of the oxidation of Ti2AlC, Ti3AlC2 and Cr2AlC in Air. Mater Res Lett. 2013;1(3):115–125.
- Lin ZJ, Li MS, Wang JY, et al. High-temperature oxidation and hot corrosion of Cr2AlC. Acta Mater. 2007;55(18):6182–6191.
- Lee DB, Nguyen TD, Han JH, et al. Oxidation of Cr2AlC at 1300°C in air. Corros Sci. 2007;49(10):3926–3934.
- Lee DB, Park SW. Oxidation of Cr2AlC between 900 and 1200 °C in Air. Oxid Met. 2007;68(5):211–222.
- Lee DB, Nguyen TD, Park SW. Long-time oxidation of Cr2AlC between 700 and 1,000 °C in Air. Oxid Met. 2012;77(5):275–287.
- Smialek JL. Oxygen diffusivity in alumina scales grown on Al-MAX phases. Corros Sci. 2015;91:281–286.
- Li S, Chen X, Zhou Y, et al. Influence of grain size on high temperature oxidation behavior of Cr2AlC ceramics. Ceram Int. 2013;39(3):2715–2721.
- Hajas DE, to Baben M, Hallstedt B, et al. Oxidation of Cr2AlC coatings in the temperature range of 1230 to 1410°C. Surf Coat Technol. 2011;206:591–598.
- Wang Z, Ma G, Liu L, et al. High-performance Cr2AlC MAX phase coatings: oxidation mechanisms in the 900–1100°C temperature range. Corros Sci. 2020;167:108492.
- Gonzalez-Julian J, Onrubia S, Bram M, et al. High-temperature oxidation and compressive strength of Cr2AlC MAX phase foams with controlled porosity. J Am Ceram Soc. 2018;101(2):542–552.
- Velasco B, Gordo E, Hu L, et al. Influence of porosity on elastic properties of Ti2AlC and Ti3SiC2 MAX phase foams. J Alloys Compd. 2018;764:24–35.
- Stelzer B, Chen X, Bliem P, et al. Remote tracking of phase changes in Cr2AlC thin films by in-situ resistivity measurements. Sci Rep. 2019;9(1):8266.
- Rosen J, Persson POÅ, Ionescu M, et al. Oxygen incorporation in Ti2AlC thin films. Appl Phys Lett. 2008;92(6):064102.
- Greczynski G, Mráz S, Hultman L, et al. Venting temperature determines surface chemistry of magnetron sputtered TiN films. Appl Phys Lett. 2016;108(4):041603.