
 ?Mathematical formulae have been encoded as MathML and are displayed in this HTML version using MathJax in order to improve their display. Uncheck the box to turn MathJax off. This feature requires Javascript. Click on a formula to zoom.
ABSTRACT
A novel approach evolved from the classical Wilkens’ method has been developed to quantify the local dislocation density based on X-ray radial profiles obtained by 3D synchrotron monochromatic X-ray microdiffraction. A deformed Ni-based superalloy consisting of γ matrix and γ′ precipitates has been employed as model material. The quantitative results show that the local dislocation densities vary with the depths along the incident X-ray beam in both phases and are consistently higher in the γ matrix than in the γ′ precipitates. The results from X-ray microdiffraction are in general agreement with the transmission electron microscopic observations.
GRAPHICAL ABSTRACT
IMPACT STATEMENT
A new approach based on 3D synchrotron microdiffraction showing broad application potential in heterogeneous materials was developed and applied to quantify local dislocation densities in a fatigued two-phase Ni-based superalloy.
1. Introduction
Dislocations are present in all crystalline materials. A quantitative description of the dislocation content, including their type, density and spatial distribution, is essential for understanding their origin, dynamics and contribution to the materials physical and mechanical properties [Citation1,Citation2]. Transmission electron microscopy (TEM) is one of the most frequently employed characterization techniques for such studies [Citation3]. However, when the dislocation density exceeds 1014 m−2, it becomes challenging to count the dislocations precisely. Features of their spatial arrangement as mutual screening of their strain fields [Citation4] are hard to obtain in conventional TEM and only assessable using high-resolution mode [Citation5].
X-ray (and neutron) diffraction is able to provide useful information about the characteristics of dislocations. Based on the X-ray diffraction radial line profiles, Wilkens has developed a method to describe the screening of the strain field of dislocations by introducing two parameters, namely the effective outer cut-off radius Re and the dislocation screening factor M () [Citation6,Citation7]. A small or large M value implies a strong or weak screening of the strain field of dislocations, respectively. His method has been applied successfully to quantify the dislocation density in a number of material systems [Citation8–10].
The development of synchrotron sources enables measuring diffraction profiles with high accuracy. With monochromatic synchrotron X-ray, high-resolution reciprocal space mapping technique, for example, dislocation structures with dislocation-free regions separated by dislocation walls can be discerned in individual crystalline grains and the local dislocation density within individual subgrains revealed [Citation11,Citation12]. However, the spatial distribution of dislocations and their densities in real space cannot be obtained using this technique. Effects of local microstructural heterogeneities on the plastic deformation behavior are thus difficult to be studied. Another synchrotron technique, 3D Laue microdiffraction, utilizes focused polychromatic X-rays and differential aperture to resolve the diffraction signals from local micrometer-sized voxels [Citation13,Citation14]. Employing this technique, the dislocation contents have been linked with the shape of the Laue peaks [Citation15]. The method has been successfully used to identify the slip systems in deformed materials [Citation16,Citation17] and to quantify the local geometrically necessary dislocation density [Citation18–20]. Most properties such as strength are controlled by all dislocations including the redundant dislocation density (not causing any geometrical consequences). Determination of the total dislocation density by polychromatic X-rays is difficult, however [Citation21].
Alternatively, the 3D intensity distribution of a diffraction peak in reciprocal space from a certain volume within a specimen, can be obtained by tuning the monochromatic X-ray energy using a specially designed monochromator [Citation14,Citation22]. From the 3D intensity distribution, radial line profiles can be obtained. So far, such radial line profiles have not been utilized thoroughly for investigations of the dislocation content. The present study aims to accomplish such a quantitative characterization by extending the classical Wilkens’ method to the radial profiles obtained by microdiffraction tuning monochromatic X-ray energies.
2. Material and methods
A deformed directionally solidified two-phase Ni-based superalloy, DZ17G, was used as model material to demonstrate the broad usage of the method. During solidification, dendrites grow with one of their 〈001〉 directions along the temperature gradient. Perpendicular to the growth direction the dendrites are ∼200 µm in width. Boundaries between two adjacent dendrites may be either low- or high-angle boundaries depending on their mutual misorientation. The resulting grain width (defined by boundary misorientation angles of 15° and above) ranges from 200 µm to 2 mm. This alloy has a structure consisting of coherently oriented cuboidal precipitates of an ordered L12 γ′-Ni3(Al,Ti) phase in a matrix of face-centered cubic (FCC) γ-phase [Citation23,Citation24]. The cuboidal γ′ precipitates have an average size of ∼360 nm, with their edges aligned with the three crystallographic 〈001〉 directions. The cuboids are distributed uniformly in the γ matrix, which appears as interconnected 3D channels separating the cuboids. The average width of the γ channels is ∼35 nm. The volume fraction of the γ′ precipitates is about 70%. An as-cast sample was vibration fatigued using a D-300 vibrating machine of Suzhou SuShi Testing Group Co., Ltd. in China, following the standard of the Ministry of the Aviation Industry of the P.R.C. (HB5277-84). More specimen details were given in section A in the supplementary material.
Synchrotron microdiffraction was conducted at beamline 34-ID-E at Advanced Photon Source in the USA. A polychromatic X-ray beam was focused to a size of ∼0.3 µm using non-dispersive Kirkpatrick-Baez mirrors. The sample was mounted on a holder at an inclination of 45° to the incoming beam. Laue diffraction patterns were recorded using a panel detector mounted in a 90° reflection geometry 513.2 mm above the specimen. The detector position with respect to the incident beam was calibrated using a strain-free silicon single crystal. A sketch of the experimental set-up and an indexed Laue diffraction pattern from the investigated region can be found in section A in the supplementary material.
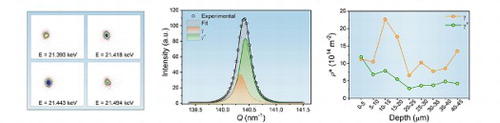
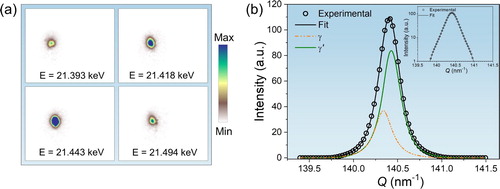
A monochromatic beam was used for mapping the 3D intensity distribution around the 800 diffraction spot in reciprocal space by scanning the X-ray energy with an energy step of 5 eV from 21.348 keV to 21.688 keV. For each energy step, a Pt knife-edge scanning along the sample surface at a distance of 250 µm was used as a differential aperture for resolving the diffraction signal from different depths illuminated by the microbeam with a resolution of 5 µm. The energy and depth step sizes were chosen to balance between accuracy of the resulting radial line profile and time consumption. Four examples of depth-resolved diffraction patterns obtained at different X-ray energies from a small volume along the beam at a depth of 5–10 µm below the sample surface are shown in Figure (a). Based on the diffraction geometry and the energy of the X-rays, the diffraction vector, Qi, for each pixel in the diffraction patterns was determined. The intensity distribution as a function of the length of the diffraction vector, Q = 4πsinθ/λ (λ is the wavelength of X-ray and θ is the Bragg angle), was determined for each energy and each depth. By collecting the intensity distributions of all individual energy steps for each voxel, an X-ray radial line profile from a local volume at each depth was determined.
Figure 1. (a) Examples of depth-resolved diffraction patterns obtained at different X-ray energies from a volume 5–10 µm below the sample surface. (b) Radial X-ray line profile based on scans with different monochromatic energy. For calculating the radial profile, the diffracted intensity was summed in an interval of 0.030 nm−1 of the diffraction vector Q. The black circles are the calculated data from experimental diffraction patterns, while the black line is a fit to the calculated data by multiple Gaussian functions. The orange and olive lines are two subprofiles decomposed from the black line. The inset in (b) shows the fit result on a logarithmic scale.
3. Results and discussion
An example of the radial line profile for a depth of 5–10 µm is shown as black circles in Figure (b). It is seen that the radial profile is asymmetrical, with a longer tail at the lower Q than at higher Q. This is mainly due to the presence of the γ and γ′ phases, which have slightly different lattice constants. To reveal the diffraction signal originating from each phase, the radial line profile is separated into two subprofiles using a mirroring method described in section B in the supplementary material. For this separation, the ratio of the integrated intensity between γ and γ′ subprofiles at each depth is assumed equal to the ratio of the macroscopic volume fraction between the γ and γ′ phases, i.e. 30:70. Considering the fact that the size of the probed volume is much larger than the sizes of the γ channels and γ′ cuboids, this is a reasonable assumption. Also, in section E in the supplementary material it is shown that the influence of different integrated intensity ratio is insignificant.
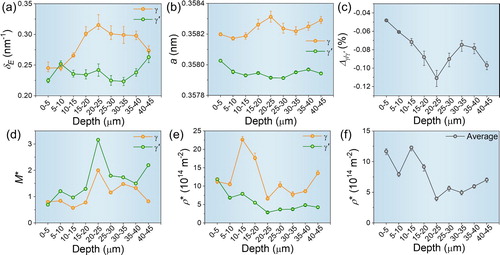
An example of separated subprofiles is shown in Figure (b), where the orange and olive curves are from the γ and γ′ phases, respectively. The full width at half maximum (FWHM) of the separated radial subprofiles, δE, for the local volumes at different depths is determined and shown in Figure (a). It is seen that δE for both phases is different along the depths and the values for the γ′ phase are in general smaller than those for the γ phase. The lattice constant a determined based on the maximum intensity of subprofile is smaller for the γ′ precipitate than the γ phase (Figure (b)), leading to negative γ/γ′ lattice misfit, , in a range between −0.05% and −0.11% (Figure (c)).
Figure 2. Quantitative results for the γ and γ′ phases at different depths determined based on the radial line profiles from tuning monochromatic energy. (a) FWHM of the radial profile δE. (b) Lattice constant a. (c) Lattice misfit Δγ/γ′ between two phases. (d) Apparent dislocation screening factor M*. (e) Apparent dislocation density ρ*. (f) The volume-weighted average apparent dislocation density ρ* over the two phases. The error bars in (a–c) are derived from profile separation using integrated intensity ratios of 25:75 and 35:65 between the γ and γ′ phases. Those of the dislocation densities (e–f) are based on the variations in FWHM in (a).
Based on the separated line profiles, the dislocation screening factor M and the dislocation density ρ are determined using the Wilkens’ method [Citation6,Citation7] for each phase. A brief summary of the Wilkens’ method of describing the X-ray line profile of restrictedly random distributed dislocations (with equal amount of dislocations having opposite signs of their Burgers vector) is given here, while more details can be seen in section C in the supplementary material. Series of radial profiles normalized by the dislocation density were determined numerically for different screening parameters M* in the range 0.5–10 based on Wilkens’ theory [Citation6,Citation7]. The asterisk indicates that the normalized profiles were calculated by taking into account restrictedly random distributions of solely screw dislocations. The series of calculated radial profiles was then compared to the experimental radial profile by comparing the ratios between full width at several different intensities and the FWHM. The calculated profile with best shape matching to the experimental one (in terms of these ratios) is identified and its apparent dislocation screening factor M* and its FWHM, denoted as δM*, determined. The apparent dislocation density ρ* is then given by:
(1)
(1) The actual dislocation density ρ can be determined using Equation (2), considering also edge dislocations:
(2)
(2) where
is a geometrical contrast factor depending on the angles between Q, b (Burgers vector) and l (line vector) of the involved dislocations. The contrast factor is 0.1667 for screw dislocations (i.e. C*) and 0.1889 for edge dislocations [Citation6], the average value
will be in the range between these two values. The small difference between C* and
will result only in small differences between the ρ* and ρ. For simplicity and avoiding further assumptions about the involved dislocations, the apparent parameters ρ* and M* are directly used in this article. Last but not least, for the present analysis, peak broadening from size and instrumental effects has little influence on the dislocation densities (about 10%, see section D in the supplementary material) and is therefore omitted in the calculations.
The apparent parameters M* and ρ* for each phase and each depth are displayed in Figure (d,e), respectively. The results show that the apparent dislocation screening factors M* for the γ channels are in general smaller than that for the γ′ precipitates (Figure (d)), which implies that δM* is also smaller for the γ phases (see Fig. S3b). According to Equation (1), smaller δM* and larger δE lead to larger ρ* for the γ phase (Figure (e)). ρ* in general decreases from the surface to the interior for the γ′ phase, while no clear pattern is seen for the γ phase. The volume-weighted average ρ* over the two phases, at different depths is shown in Figure (f). The average ρ* is generally higher in the region close to the surface (with depth below 20 µm) than that in the deeper region.
The average apparent dislocation density over the entire characterized volume is ∼12.1 × 10¹⁴ m−2 in the γ phase and ∼5.7 × 10¹⁴ m−2 in the γ′ phase. Considering the volume ratio between the two phases, this result suggests that the number of dislocations within the two phases is similar. The apparent effective outer cut-off radius of dislocations (not shown here), varies from 12 nm to 78 nm with an average of 35 nm in the γ phase, and from 53 nm to 141 nm with an average of 76 nm in the γ′ phase.
To confirm the quantitative results, the microstructure of the sample was characterized using TEM (see section F in the supplementary material). An example TEM micrograph is shown in Figure . The dislocations are heterogeneously distributed between both phases. Darker regions depict the majority of the γ channels, suggesting a high dislocation density there, while no dislocations are seen in some of the γ channels (see e.g. the one marked by the orange arrows in Figure ). The average dislocation density in the γ phase is determined to be about 8.5 × 10¹⁴ m−2 (for details see section F).
Figure 3. TEM image showing the dislocation structure of the Ni-based superalloy sample. In the upper part, γ and γ′ phases are labeled. A selected area electron diffraction pattern is inserted on the bottom right corner. Orange arrows mark a γ channel, where no dislocation is seen. The yellow arrow is parallel to the primary dendrite direction. The blue arrow indicates the direction of the microfocused X-ray beam.
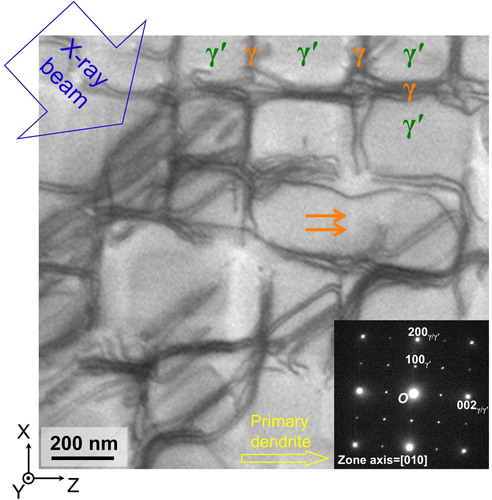
A large number of dislocations are also apparent in some γ′ cuboids, while no dislocation is seen in others. The majority of these dislocations are inclined approximately 45° to the cuboid axes and appear in pairs. It remains uncertain if these dislocations reside within the γ′ cuboids; they may actually lie in γ channels parallel to the TEM foil [Citation25]. The density of dislocation in the γ′ phase can therefore not be quantified, but is obviously much smaller than in the γ phase. Nevertheless, the level of the average dislocation density in the γ phase determined from TEM is comparable with that determined from the radial line profiles, suggesting that the calculation based on the local microdiffraction data is reliable.
The fact that dislocations in the γ phase are confined to the channels and the γ′ precipitates are isolated by the channels is likely to be the reason for the small values of Re* between 12 and 141 nm determined from the microdiffraction data.
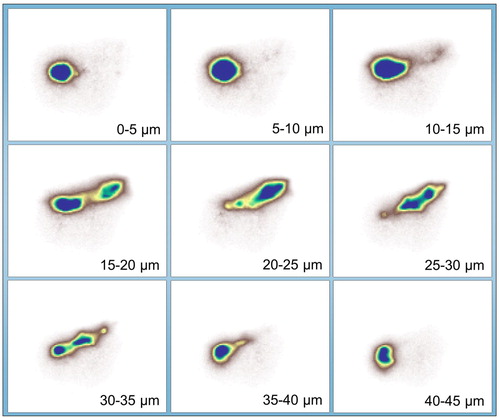
To understand the variation seen in Figure , pseudo white beam diffraction patterns are obtained by adding all diffraction patterns collected through the series of energies for each depth. The result is shown in Figure . Peak splitting is seen in several of the patterns, indicating the presence of a subgrain boundary in the corresponding local volume, i.e. between a depth of 15 and 35 µm. Hence, the region closer to the surface belongs to a different subgrain than the region probed in larger depth. The higher average ρ* (Figure (f)) for the subgrain close to the surface than that deeper in the volume, suggests that the crystallographic orientation of different subgrains plays a role for their plastic deformation and dislocation accumulation. (The presence of a subgrain boundary at a depth of 20–25 µm is likely to be also the reason for the small lattice misfit seen in Figure (c)). The misorientation angle between both subgrains is at maximum around 0.9° (seen at the depth between 15–20 µm and 20–25 µm). The (geometrically necessary) dislocation density estimated using the Read-Shockley formula [Citation26] based on the misorientation angle θ between subgrains is ∼2.5 × 10¹³ m−2, assuming a spacing x of 5 µm. This density is about one order of magnitude less than the total dislocation density determined based on the radial line profile. The overwhelming contribution to the dislocation density in the sample comes from redundant dislocations (with opposing sign of their Burgers vector) as a result of the fatigue deformation of the Ni-based superalloy [Citation27,Citation28].
Figure 4. Pseudo white beam diffraction patterns, calculated by summing the diffraction patterns collected through a series of energies. From left to right and top to bottom, the depth is increased from 0–5 µm to 40–45 µm.
4. Conclusions
In the present study, intragranular dislocation densities in a vibration-fatigued Ni-based superalloy, DZ17G, have been quantified based on 3D synchrotron monochromatic microdiffraction data using the classical Wilkens’ radial line profile method. In this manner, the redundant dislocation density is revealed locally on small length scale of 5 µm, which has not been accessed before by X-ray diffraction, neither by conventional line profile analysis, which cannot capture heterogeneities on micrometer length scales, nor by local polychromatic X-ray investigations, which solely revealed the geometrically necessary dislocation content.
Our results show that large amount of redundant dislocations (in the order of 1014 m−2) are generated during vibration fatigue test. The dislocation densities resolved in the γ channels of the superalloy are about twice that in the cuboidal γ′ precipitates. Local variations in dislocation density are seen for the γ and γ′ phases at different depth along the incident X-ray. Significant differences are detected between two subgrains with misorientation of ∼1°.
Upon continued upgrades and developments of synchrotron achieving orders of magnitude higher brilliance and smaller size, the powerful approach introduced in this article will allow resolving intragranular dislocation structures with a spatial resolution better than 100 nm in a broad range of materials.
Supplemental Material
Download MS Word (2.6 MB)Acknowledgements
This work is supported by the National Natural Science Foundation of China under Grant 91860109, 51671154 and 51927801, the National Key Research and Development Program of China under Grant 2016YFB0700404. G.Z. would like to acknowledge the financial support from the program of China Scholarship Council (No. 201806280355). K.C. appreciates the support from the International Joint Laboratory for Micro/Nano Manufacturing and Measurement Technologies and the Collaborative Innovation Center of High-End Manufacturing Equipment. Y.Z. acknowledges support from the Danish Council for Independent Research Fund (8022-00340B). Use of the Advanced Photon Source was supported by the U. S. Department of Energy, Office of Science, Office of Basic Energy Sciences, under Contract No. DE-AC02-06CH11357.
Disclosure statement
No potential conflict of interest was reported by the author(s).
Additional information
Funding
References
- Cottrell AH. Dislocations and the mechanical properties of crystals. Nature. 1956;178:1090–1092.
- Hull D, Bacon DJ. Introduction to dislocations. 5th ed Oxford: Butterworth-Heinemann; 2011.
- Hirsch P, Cockayne D, Spence J, et al. 50 Years of TEM of dislocations: past, present and future. Philos Mag. 2006;86:4519–4528.
- Ungár T, Borbély A. The effect of dislocation contrast on x-ray line broadening: a new approach to line profile analysis. Appl Phys Lett. 1996;69:3173–3175.
- Snoeck E, Warot B, Ardhuin H, et al. Quantitative analysis of strain field in thin films from HRTEM micrographs. Thin Solid Films. 1998;319:157–162.
- Wilkens M. The determination of density and distribution of dislocations in deformed single crystals from broadened X-ray diffraction profiles. Phys Status Solidi. 1970;2:359–370.
- Wilkens M. Theoretical aspects of kinematical X-ray diffraction profiles from crystals containing dislocation distributions (Fourier transform of X ray diffraction line profiles from crystals with dislocations). NBS Fundam Asp Dislocation Theory. 1970;2:1195–1221.
- Ungár T, Mughrabi H, Rönnpagel D, et al. X-ray line-broadening study of the dislocation cell structure in deformed [001]-orientated copper single crystals. Acta Metall. 1984;32:333–342.
- Yuming W, Shansan L, Yenchin L. X-ray line profile analysis of deformed Al. J Appl Crystallogr. 1982;15:35–38.
- Zwui S, Chen G, Wang Y. The X-ray diffraction effects of dislocations and stacking faults in hcp and bcc metals. J Mater Sci Lett. 1985;4:1434–1436.
- Jakobsen B, Poulsen HF, Lienert U, et al. Formation and subdivision of deformation structures during plastic deformation. Science. 2006;312:889–892.
- Jakobsen B, Poulsen HF, Lienert U, et al. Direct determination of elastic strains and dislocation densities in individual subgrains in deformation structures. Acta Mater. 2007;55:3421–3430.
- Larson BC, Yang W, Ice GE, et al. Three-dimensional X-ray structural microscopy with submicrometre resolution. Nature. 2002;415:887–890.
- Levine LE, Larson BC, Yang W, et al. X-ray microbeam measurements of individual dislocation cell elastic strains in deformed single-crystal copper. Nat Mater. 2006;5:619–622.
- Barabash RI, Ice GE, Larson BC, et al. White microbeam diffraction from distorted crystals. Appl Phys Lett. 2001;79:749–751.
- Barabash RI, Ice GE, Walker FJ. Quantitative microdiffraction from deformed crystals with unpaired dislocations and dislocation walls. J Appl Phys. 2003;93:1457–1464.
- Ohashi T, Barabash RI, Pang JWL, et al. X-ray microdiffraction and strain gradient crystal plasticity studies of geometrically necessary dislocations near a Ni bicrystal grain boundary. Int J Plast. 2009;25:920–941.
- Xue J, Zhang A, Li Y, et al. A synchrotron study of microstructure gradient in laser additively formed epitaxial Ni-based superalloy. Sci Rep. 2015;5:1–10.
- Li Y, Qian D, Xue J, et al. A synchrotron study of defect and strain inhomogeneity in laser-assisted three-dimensionally-printed Ni-based superalloy. Appl Phys Lett. 2015;107:181902-1–181902-5.
- Zhang YB, Andriollo T, Fæster S, et al. Microstructure and residual elastic strain at graphite nodules in ductile cast iron analyzed by synchrotron X-ray microdiffraction. Acta Mater. 2019;167:221–230.
- Ice GE, Barabash RI. Chapter 79 white beam microdiffraction and dislocations gradients. Dislocations Solids. 2007;13:499–601.
- Cornelius TW, Carbone D, Jacques VLR, et al. Three-dimensional diffraction mapping by tuning the X-ray energy. J Synchrotron Radiat. 2011;18:413–417.
- Pollock TM, Tin S. Nickel-based superalloys for advanced turbine engines: chemistry, microstructure and properties. J Propuls Power. 2006;22:361–374.
- Reed RC, Rae CMF. Physical metallurgy of the nickel-based superalloys. 5th ed. Oxford: Elsevier B.V.; 2014.
- Pollock TM, Argon AS. Creep resistance of CMSX-3 nickel base superalloy single crystals. Acta Metall Mater. 1992;40:1–30.
- Read WT, Shockley W. Dislocation models of crystal grain boundaries. Phys Rev. 1950;78(3):275–289.
- Suresh S. Fatigue of materials. 2nd ed Cambridge: Cambridge University Press; 1998.
- Petrenec M, Obrtlík K, Polák J. Inhomogeneous dislocation structure in fatigued INCONEL 713 LC superalloy at room and elevated temperatures. Mater Sci Eng A. 2005;400-401:485–488.