
 ?Mathematical formulae have been encoded as MathML and are displayed in this HTML version using MathJax in order to improve their display. Uncheck the box to turn MathJax off. This feature requires Javascript. Click on a formula to zoom.
Abstract
Transformation-induced plasticity is a fundamental solution for improving the ductility of bulk metallic glass composites (BMGCs). However, the underlying mechanism remains controversial. Here, by using in situ transmission electron microscopy, we present direct observation of the transformation dynamics from β/ω phase to α’ phase of the crystalline dendrites in a TiZrCuBe BMGC under uniaxial tensile deformation. The transformation redistributes the stress in the adjacent matrix, making interfacial regions potential preferential sites for shear band nucleation. The high density of nucleation sites is believed to promote the formation of shear band networks and enhance the ductility of BMGCs.
GRAPHICAL ABSTRACT
Introduction
Owing to their lack of long-range order, bulk metallic glasses (BMGs) don’t possess structural defects such as grain boundaries and dislocations, making them attractive materials with superior strength, high elasticity, and excellent corrosion resistance [Citation1,Citation2], but also very limited plasticity [Citation3]. One pathway towards enhanced plasticity is to multiply shear bands by lowering their nucleation energy barrier and to block their propagation [Citation4,Citation5]. Another way is to endow BMGs with extra plasticity by introducing a ductile crystalline phase [Citation6], creating so-called bulk metallic glass composites (BMGCs). When deformed, the embedded crystals can endure plastic deformation, work-hardening, or even phase transformation and compensate work-softening of the amorphous matrix, thus improving the global plasticity [Citation7–10]. This additional plasticity is named transformation-induced-plasticity (TRIP). Up till now, huge improvements in enhancing the plasticity of BMGCs have been achieved utilizing TRIP [Citation7,Citation9–12]. Efforts have also been made to investigate the phase transformation using diffraction techniques [Citation13,Citation14]. However, due to the lack of direct nanoscale imaging of the transformation dynamics and their effects on the glassy matrix, the underlying reinforcing mechanism remains under debate, specifically whether phase transformation or shear banding occurs first [Citation13–17]. In this work, we report direct observation of the phase transformation dynamics in a TiZrCuBe BMGC under tensile deformation inside a transmission electron microscope (TEM).
Materials and methods
Bulk sample synthesis
BMGC with a nominal composition of Ti47.4Zr34Cu6Be12.6 (at. %) was produced by arc melting high-purity Ti, Zr, Cu and Be metals (purities over 99.9 wt.%) [Citation9]. As-cast rods were prepared by arc re-melting the master ingots and copper mold casting in a high-purity argon atmosphere (Edmund Bühler Arc Melter).
In situ TEM specimen preparation and deformation
A cuboid was cut from the bulk sample and transferred to a Hysitron Push-to-Pull (PTP) device inside a Zeiss Auriga dual-beam equipped with an Omniprobe micromanipulator, followed by cutting into a miniaturized dog-bone with a thickness of ∼150 nm. The design of PTP devices allows for converting the compressive motion of the indenter into well-controlled tensile loading in the TEM [Citation18]. Deformation was carried out using a Hysitron PI95 Picoindenter under displacement control in situ in a JEOL JEM-2100F TEM.
Results and discussion
As prepared in situ BMGC results from the formation of a dendritic crystalline phase during casting that is distributed uniformly in the glassy matrix (Supplementary Figure S1). The dendrites consist of a β-Ti/Zr phase containing a high density of ω-Ti/Zr phase precipitates (Supplementary Figure S2–S6, Table S1) [Citation19]. During deformation, the metastable β/ω phases transform into α’ phase. To study the effects of the phase transformation on the deformation of the BMGC in the TEM, miniaturized tensile specimens containing a glass-crystal interface was prepared using focused ion beam machining as described above.
Figure displays the dynamic response of a characteristic specimen under tensile deformation. The glassy phase is on the left side and the crystal on the right side of the tensile bar. A specific dark-field condition was chosen to distinguish the β/ω phase (bright) from the α’ phase (dark) (Supplementary Figure S7–S8). Figure (a–i) are time-lapsed images extracted from Supplementary Video S1. For a quantitative evaluation of the elongation, carbon-markers were deposited on the tensile specimen. In the first 47.5 s, the specimen endured elastic strain only. The elongation of both the matrix and the dendrite can be concluded from the movement of the interface and the carbon-markers (Figure (a,b)). As tension proceeded, a band-like darker contrast appeared in the dendrite (Figure (c)), indicating the formation of α’ phase. After nucleation, the α’ phase propagated quickly and then the propagation slowed down after Figure (d) (see Figure S7 for discussion on the nucleation and propagation of the phase transformation). In Figure (e,f) the propagation was blocked, as indicated by a remaining bright feature (see yellow arrow). Since the dendrite consists of β phase and ω variants, these obstacles are believed to be larger ω domains. During continued deformation, strip-like darker contrast features (indicated by green arrows) gradually appeared and grew bigger in the untransformed region (Figure (f,g)), indicating the nucleation of new α’ grains. Finally, the transformed α’ phase approached the end of the gauge section (Figure (h)), and only obstacles at the right end remained. Under continued deformation, the tensile specimen fractured at 82 s in the α’ phase, leaving an untransformed region at the right end (Figure (i)), demonstrating that the interface is not the weakest site in the BMGC.
Figure 1. Straining, phase transformation and fracture dynamics of a tensile specimen containing a glass-crystal interface. (a)-(i) Dark-field images showing the straining, phase transformation and fracture. Green dashed lines indicate nucleated α’ phase bands. The angle between the axial direction (cyan dashed horizontal lines) and the surface of the α’ phase (cyan dashed inclined lines) is denoted by θ. Yellow arrows indicate large ω grains blocking α’ phase propagation. Green arrows indicate parallel α’ bands formed during a later stage. (j) Time-dependent evolution of the stress σ and strain ϵ. The subscripts represent, whether ϵ was determined for the entire gauge section ‘t’, the glass ‘g’ or the crystal ‘c’. (k) stress-strain curves deduced from (j). (l) θ–t and S-t curve. S denotes the measured area of α’ phase. The dotted vertical lines in (j)-(l) correspond to frames (b)-(h) extracted from the video.
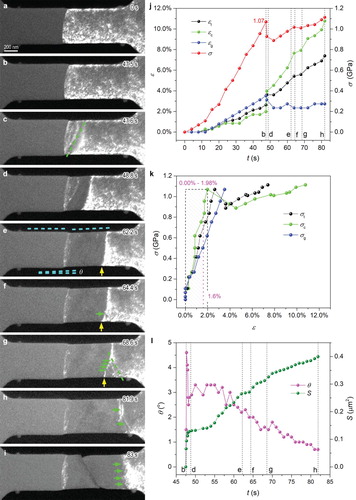
To quantify the deformation in the tensile specimen, strain-time (ϵ-t) and stress-time (σ-t) curves were calculated (Figure (j)). The strain for the glass (ϵg), the crystal (ϵc) and the overall tensile specimen (ϵt) was calculated by measuring local elongations and the applied stress (σ) was measured by the indenter (see Supplementary materials for the details of strain and stress calculation). The dashed lines are marked with b–h to refer to Figure (b–h). Initially, both the glassy matrix and the crystalline dendrite deformed elastically ((a)-(b)). The maximum strain in the glass and crystal was ∼3.52% and ∼1.98%, respectively. With the stress of ∼1.07 GPa, Young’s modulus was estimated to be ∼30 GPa and ∼54 GPa for the glass and crystal, respectively. The higher modulus of the crystal compared with the glass agrees with the theoretical prediction that crystals are usually stiffer than their metallic glasses counterparts [Citation20,Citation21]. When the α’ phase nucleated ((c)-(d)), a sudden increase in ϵc, a slight decrease in ϵg, and a sudden drop in σ were observed. This trend continued until σ reached a local minimum of ∼0.89 GPa and ϵg decreased to its minimum value of ∼2.34%. From this observation, several conclusions can be drawn: (1) the critical stress for α’ phase nucleation is ∼1.07 GPa for the tested tension-induced-transformation from β/ω to α’; (2) the critical stress for α’ phase growth in the β/ω dendrites is ∼0.89 GPa; (3) the transformation from β/ω to α’ causes a stress redistribution (the stress decreases). This sudden stress redistribution originated from the lattice change in the transformed region. As the α’ phase propagated, the crystal elongated, leading to a stress release. This process continued until the propagation stopped (52 s). With increased stress, the propagation restarted, as indicated by the increasing ϵc. Direct comparison with ϵg shows that higher stress was required to continue the deformation of the glass (56 s). As shown in Figure (e–g), the α’ phase propagation was blocked, which is reflected by the decelerated increase in ϵc. The nucleation of new α’ grain, as shown in Figure (f), resulted in a minor stress redistribution characterized by a small drop in σ and a slight decrease in ϵg. This process continued until fracture. From these results we can identify the following steps during plastic deformation of the BMGC: (i) α’ phase nucleates and propagates, inducing stress redistribution and reduction in the crystalline region, (ii) propagation slows down and gets blocked, causing stress to rise in the crystalline region, (iii) a new α’ phase grain nucleates and the sequence repeats.
In addition, stress–strain (σ-ϵ) curves were retrieved for the glass, the crystal and the overall specimen (Figure (k)), by redisplaying the data in Figure (j). Within the elastic regime (ϵ ≤ ∼1.98%), the curve slope for the crystal (σc, green) is larger than that for the glass (σg, blue), due to the higher Young’s modulus. It is interesting to note that the surface of the α’ phase is not parallel to the tensile axis. The angle, denoted θ, was measured, as shown in Figure (l) (magenta). During phase transformation, θ gradually decreased from ∼4.6o to 1o. This angle originated from the atomic shuffle during the transformation from β/ω to α’ [Citation22], and the gradual decrease was caused by the mechanical constraint from both ends, which provided compensatory shear stress to the α’ phase. The growth rate of the α’ phase was also evaluated by measuring its projected area (S) (Figure (l), olive) and matched perfectly with the curves in Figure (j). Between 47.5 and 48.8 s, the α’ phase nucleated and rapidly grew up to ∼0.131 μm2. The growth decelerated due to stress release at 48.8 s, accelerated as σ increased at 52 s, and decelerated again at 62.2 s when blocked by larger ω domains, and then accelerated suddenly at 64.4 s due to the nucleation of another small α’ grain. From 64.4 s, the growth was still blocked but small α’ bands kept nucleating and growing, resulting in a low but nearly constant growth rate until all obstacles were removed (81.9 s). The non-diffusive characteristic of this phase transformation was confirmed by distribution mapping the chemical composition of the fractured specimen (Supplementary Figure S9), which also revealed a thickness decrease in the transformed region. This decrease was also verified by cross-sectional SEM observations (Supplementary Figure S10) and is in good agreement with the lattice contraction induced by the phase transformation, as discussed below.
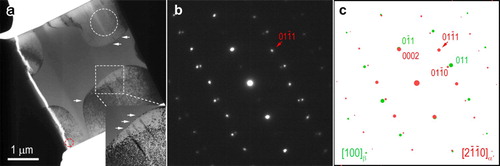
To study the effects of phase transformation in bulk composites, a larger tensile specimen containing multiple glass-crystal interfaces was prepared. Figure (a) shows a bright-field (BF) image of the fractured specimen. Multiple α’ laths are visible. Figure (b) is the selected area electron diffraction (SAED) pattern from the red dashed region in Figure (a), and Figure (c) is the simulated pattern, showing the orientated co-existence of β phase and α’ phase. Along this direction, the diffraction spots from ω variants overlap completely with those from the β phase. Therefore, in this case, β/ω is referred to as β for convenience. The spot indicated by a red arrow directly demonstrates the presence of α’ phase. Before fracture, a loading-unloading experiment was conducted under diffraction mode to examine the reversibility of the phase transformation (Supplementary Video S2). Upon loading diffraction spots from the
zone axis of the α’ phase appeared and upon unloading their intensity decreased, suggesting a loading-stress-dependent and partially reversible characteristic, which contributes to the ‘elasticity’ of current BMGC. The tensile specimen was then deformed to fracture in BF mode to directly image the deformation behavior (Supplemental Video S3). Consistent with the smaller tensile specimen, the α' phase propagated under increased loading. Noteworthy, instead of one main α’ band, multiple parallel α’ laths formed in the crystals, as pointed by the white arrows in Figure (a). Comparison of the two tests suggests that multiple matrix-dendrite interfaces intersect the growing α’ laths and contribute to the formation of new α’ laths. As indicated by the SAED pattern in Figure (b), fracture happened along α’ laths (red dashed region in Figure (a)), suggesting that phase transformation in the crystal and shear banding in the glass are closely related. In fact, during in situ deformation of a specimen having the crystal-glass interface parallel to the tensile direction, it could be observed that phase transformation in the crystal caused a step at the interface to the glass before fracture (Video S4 and Figure S11), i.e. phase transformation occurred first and triggered shear banding. The multiplication of dislocations and their movement away from the transformation front suggest a dislocation-mediated process.
Figure 2. Fracture of a larger tensile bar. (a) BF image of the fractured sample. The bottom-right inset is the blowup from the dashed square area. Several α’ phase laths are indicated by white arrows. (b) SAED pattern taken from the red dashed region in (a). (c) Simulated pattern illustrating the oriented co-existence of β phase (green) and α’ phase (red).
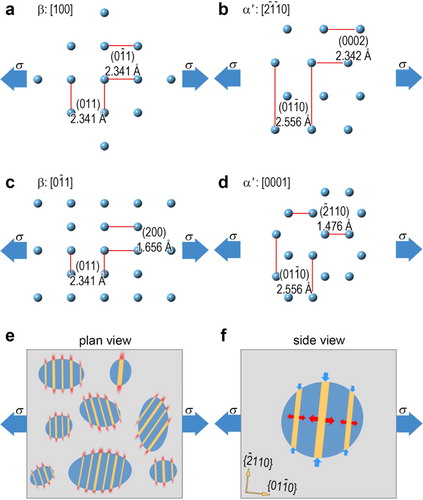
As shown in Figure (c), is parallel to (011)β, with the former having a larger d-spacing; (0002)α’ is parallel to
, both having similar d-spacings; and the
zone axis is parallel to the [100]β zone axis. Figure (a–d) presents a model for the atom configurations of the β and α’ phases along the labeled directions. When tensile stress is applied along the [011]β direction, the (011)β plane (2.341 Å) turns into the
plane (2.556 Å) (as implied by the gradual appearing of extra diffraction spots in Video S2 which are indexed in Figure (b,c)) [Citation22], introducing a lattice expansion of 9.18% along the tensile direction; the (200)β plane (1.656 Å) turns into the
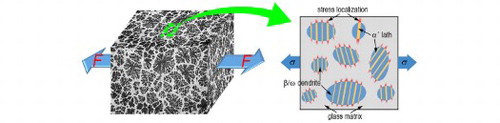
plane (1.476 Å) (which is not observable from [100]β direction) [Citation22], introducing a lattice contraction of 10.87% along the transverse direction. In BMGCs, these changes lead to stress redistribution, as shown in the schematic in Figure (e). When deformed sufficiently, α’ laths nucleate in the dendrites while the matrix is still elastically strained. Due to the equivalence of six <110> directions in the bcc β phase, the α’ laths are nearly perpendicular to the tensile direction (yellow bands). The lattice expansion along
planes will affect the stress distribution in two ways. Firstly, the stress loading originally carried by the untransformed β phase will be transferred to the adjacent glassy matrix. Secondly, because of the tight bonding between dendrite and matrix atoms at the interfaces [Citation8,Citation23,Citation24], the lattice expansion introduces extra tensile stress in the adjacent matrix. While lattice contraction along
planes will provide compressive stress in the front and back and extra tensile stress above and beneath the laths (Figure (f)). In consequence, some regions in the glass (rendered in red in Figure (e)) become more strained, and would likely act as nucleation sites for shear banding upon further deformation [Citation15,Citation24]. Moreover, due to the confinement from the interfaces [Citation8,Citation23,Citation24], the stress in the dendrite cannot be fully released as in free crystals. As a result, more α’ laths form and produce shear band nucleation sites. On the other hand, since the dendrites have randomly precipitated from a homogenous mixture, their orientations can vary significantly. It is thus hypothesized that while the α’ laths will be close to normal with respect to the tensile direction, their orientations show a significant distribution. This could potentially promote shear band nucleation along different directions to form networks in the matrix and improve the global plasticity [Citation15,Citation24].
Figure 3. Schematic illustration of the transformation-induced lattice change and its effects on the stress redistribution in the glass matrix. (a)-(d) Lattice spacing comparison between β phase and α’ phase along two directions. The red line pairs represent the indicated crystal planes and the distances between them (d-spacing) is shown aside. (e) Plan view showing the stress localization in the nearby region of the formed α’ laths. (f) Side view showing the extra stress caused by the phase transformation. In (e) and (f), gray background represents the glassy matrix, blue ellipses represent β dendrites, yellow bands represent α’ phase laths. The additional stress in the glassy matrix is indicated in red.
Conclusion
In summary, quantitative in situ tensile testing in the TEM has revealed the effects of phase transformation on the deformation of a BMGC. Differently from previous reports that shear banding happens in the glassy matrix first and get blocked by or trigger phase transformation in the crystalline precipitates [Citation16,Citation17], it is directly visualized that in a BMGC with metastable crystalline β phase, phase transformation occurs in the crystals first and likely produces preferential sites for shear banding during deformation. The current work sheds light on the complex deformation process in a BMGC exhibiting a TRIP effect and therefore serves as viable input for simulation and helps to formulate design criteria for better BMGCs.
Author contributions
H.S. and C.G. conceived the idea and performed TEM specimen preparation and subsequent ex situ and in situ TEM experiments. L.Z. performed bulk sample preparation and morphological SEM observation. L.Z., H.Z., J.W. and J.E. participated in data analysis and discussion. H.S., J.E. and C.G. prepared the manuscript with input from all authors.
Supplemental Material
Download QuickTime Video (14.1 MB)Supplemental Material
Download QuickTime Video (8.7 MB)Supplemental Material
Download QuickTime Video (7.8 MB)Supplemental Material
Download QuickTime Video (8.7 MB)Supplemental Material
Download PDF (2.4 MB)Acknowledgements
The authors would like to thank Dr. S. Jia for help with the EDSmapping experiment and Dr. D. Sopu for stimulating discussions and Dr. J. Zalesak for the help with sample preparation.
Disclosure statement
No potential conflict of interest was reported by the author(s).
Additional information
Funding
References
- Wang WH, Dong C, Shek CH. Bulk metallic glasses. Mater Sci Eng R Reports. 2004;44:45–89.
- Chen M. A brief overview of bulk metallic glasses. NPG Asia Mater. 2011;3:82–90.
- Ashby MF, Greer AL. Metallic glasses as structural materials. Scr Mater. 2006;54:321–326.
- Chen M. Mechanical behavior of metallic glasses: microscopic understanding of strength and ductility. Annu Rev Mater Res. 2008;38:445–469.
- Hofmann DC, Suh JY, Wiest A, et al. Designing metallic glass matrix composites with high toughness and tensile ductility. Nature. 2008;451:1085–1089.
- Wu Y, Wang H, Liu XJ, et al. Designing bulk metallic glass composites with enhanced formability and plasticity. J Mater Sci Technol. 2014;30:566–575.
- Pauly S, Gorantla S, Wang G, et al. Transformation-mediated ductility in CuZr-based bulk metallic glasses. Nat Mater. 2010;9:473–477.
- Eckert J, Das J, Pauly S, et al. Mechanical properties of bulk metallic glasses and composites. J Mater Res. 2007;22:285–301.
- Zhang L, Zhu Z, Fu H, et al. Improving plasticity and work-hardening capability of β-type bulk metallic glass composites by destabilizing β phases. Mater Sci Eng A. 2017;689:404–410.
- Zhou J, Wu Y, Jiang S, et al. Simultaneously enhancing the strength and plasticity of Ti-based bulk metallic glass composites via microalloying with Ta. Mater Res Lett. 2020;8:23–30.
- Wu Y, Xiao Y, Chen G, et al. Bulk metallic glass composites with transformation-mediated work-hardening and ductility. Adv Mater. 2010;22:2770–2773.
- Zhang L, Narayan RL, Fu HM, et al. Tuning the microstructure and metastability of β-Ti for simultaneous enhancement of strength and ductility of Ti-based bulk metallic glass composites. Acta Mater. 2019;168:24–36.
- Wang DM, Chen Y, Mu J, et al. An in situ neutron diffraction study of plastic deformation in a Cu46.5Zr46.5Al7 bulk metallic glass composite. Scr Mater. 2018;153:118–121.
- Wu Y, Ma D, Li QK, et al. Transformation-induced plasticity in bulk metallic glass composites evidenced by in-situ neutron diffraction. Acta Mater. 2017;124:478–488.
- Qiao J, Jia H, Liaw PK. Metallic glass matrix composites. Mater Sci Eng R Reports. 2016;100:1–69.
- Kim CP, Oh YS, Lee S, et al. Realization of high tensile ductility in a bulk metallic glass composite by the utilization of deformation-induced martensitic transformation. Scr Mater. 2011;65:304–307.
- Sun HC, Ning ZL, Wang G, et al. In-situ tensile testing of ZrCu-based metallic glass composites. Sci Rep. 2018;8:1–12.
- Gammer C, Ophus C, Pekin TC, et al. Local nanoscale strain mapping of a metallic glass during in situ testing. Appl Phys Lett. 2018;112:171905.
- Banerjee S, Tewari R, Dey GK. Omega phase transformation – morphologies and mechanisms. Int J Mater Res. 2006;97:963–977.
- Hufnagel TC, Schuh CA, Falk ML. Deformation of metallic glasses: Recent developments in theory, simulations, and experiments. Acta Mater. 2016;109:375–393.
- Weaire D, Ashby MF, Logan J, et al. On the use of pair potentials to calculate the properties of amorphous metals. Acta Metall. 1971;19:779–788.
- Banerjee S, Mukhopadhyay P. Phase transformations: examples from titanium and zirconium Alloys. Oxford: Elsevier; 2007.
- Hays CC, Kim CP, Johnson WL. Microstructure controlled shear band pattern formation and enhanced plasticity of bulk metallic glasses containing in situ formed ductile phase dendrite dispersions. Phys Rev Lett. 2000;84:2901–2904.
- Qiao JW, Sun AC, Huang EW, et al. Tensile deformation micromechanisms for bulk metallic glass matrix composites: from work-hardening to softening. Acta Mater. 2011;59:4126–4137.