
 ?Mathematical formulae have been encoded as MathML and are displayed in this HTML version using MathJax in order to improve their display. Uncheck the box to turn MathJax off. This feature requires Javascript. Click on a formula to zoom.
Abstract
Undeformed face-centred cubic (FCC) high-entropy alloys (HEAs) always possess excellent plasticity but low hardness. In this work, Al alloying on the surface of a CrCoFeNi FCC HEA is realized by laser alloying technique. An Al1.5CoCrFeNi body-centred cubic (BCC) HEA is in-situ generated on the surface of the FCC HEA. The well-bonding BCC HEA layer possesses a hardness as high as 536 HV. The hard surface results in a much lower wear rate of the Al-alloyed specimen than the pristine specimen. This study provides a simple strategy to harden the FCC HEAs by in-situ formation of BCC HEA through laser alloying.
GRAPHICAL ABSTRACT
IMPACT STATEMENT
A laser alloying technology to harden CrCoFeNi FCC HEA by in-situ formation of BCC HEA.
1. Introduction
The conception of high-entropy alloys (HEAs) was first proposed by Yeh in 2004 [Citation1]. Instead of one principal element in traditional alloys, HEA contains more than four elements in near-equiatomic proportions, providing a near-infinite compositional space. Over the decades, various HEAs have been developed involving 3d transition element HEAs [Citation2,Citation3] and refractory metal HEAs [Citation4,Citation5]. The majority of HEAs exhibit a single-phase or multiple-phase solid solution although some intermetallic compounds are introduced in HEAs to enhance mechanical properties [Citation6–8]. CrCoFeNi, a HEA with a single FCC phase, is one of the most widely studied HEAs so far [Citation9–11]. It exhibits relatively low strength in the conventional arc-melting production process (yield strength of ∼140 MPa) [Citation9]. The influence of additional elements on CrCoFeNi has been investigated (e.g. Mo, Al, V, Nb, Ta) [Citation8,Citation12,Citation13]. In particular, the addition of Al element can cause a shift in the stability of the FCC and BCC phase, which changes the mechanical properties significantly [Citation14–16]. With the increase of Al content, strength is enhanced at the expense of ductility [Citation17]. Hence, it is conceivable that both good ductility of FCC phase and high hardness of BCC phase can be achieved by appropriate design and construction of FCC/BCC heterogeneous materials. For CrCoFeNi FCC alloy, BCC phase transition induced by Al permeation is an interesting and simple thought. However, unlike traditional steel carburization, it is relatively difficult to permeate Al due to its bigger atom size than carbon atom. Laser surface treatment, as a branch of additive manufacturing, has been applied widely in surface modification. The deposited surface layer is capable of improving the surface properties on the basis of preserving the bulk properties. Most researches are focused on conventional steel or titanium substrates [Citation18–20]. Chai et al. [Citation21] achieved gradient equiaxed grain distribution into Zr sheet by combining laser surface treatment, rolling and annealing recently. In this work, Al1.5CoCrFeNi was in-situ synthesized on the surface of CrCoFeNi sheet via Al laser alloying. The wear resistance of the Al-alloyed surface shows remarkable improvement versus pristine specimen. Besides, microstructural details of equiaxed grains within the surface layer are investigated. To the best of our knowledge, this work is the first attempt to harden CrCoFeNi HEA by laser alloying. We expect this method can be extended to other HEAs, given that Al element is a BCC stabilizer for most HEA systems, thereby promoting their application.
2. Materials and methods
A laser alloying apparatus was used to carry out the Al laser alloying on a CrCoFeNi sheet. The corresponding apparatus in this work consists of a fibre laser system, a powder feeder, a KUKA six-axis robot and a cladding head with three beams surrounding the central powder feeding system (Figure S1(a)). The used laser is a continuous fibre laser with a maximum output power of 4500W and a laser wavelength of 1080 nm. Laser intensity distribution is flattened beam with a superposition of multi-modes. The beam diameter is 1.5 mm at their focus. The parameters during laser processing were set as follows: laser power of 1350 W, a scanning speed of 0.06 m/s, a powder feed rate of 1.15 g/min, a shielding argon flow rate of 0.8 L/min, a distance from the cladding head to the workpiece of 15 mm (at the focus), an angle between cladding head and workpiece of 80 ± 0.5° and an offset value of 300 μm.
The alloying material was Al powder with a size distribution of 50–100 μm (Figure S1(b)). FCC phase is identified from the XRD pattern (Figure S1(c)). The CrCoFeNi sheet was produced by arc melting. Before laser alloying, the sheet was processed through homogenization annealing (1000°C for 4 h followed by water quenching), cold rolling (90% reduction) and subsequent annealing (1000°C for 2 h followed by water quenching). The ultimate dimension of the sheet is approximately 100 × 50 × 1.5 mm3. During laser processing, the top layer of the CrCoFeNi sheet was melted to form a molten pool and mixed with the molten Al powder under the impact of Marangoni convection. Then an Al-alloyed layer was achieved on the CrCoFeNi sheet.
After laser processing, a cross-sectional sample was cut along Y–Z plane and prepared by the conventional metallographic method. Phase characterization was carried out by X-ray diffraction on Cu Kα radiation (XRD, Shimadzu 6000). The microstructure was analysed using an optical microscope (OM, LEICA DMLM), scanning electron microscope (SEM, HITACHI, SU-8010) equipped with an energy dispersive spectrometer (EDS, Oxford X-max80) and Electron Back-Scattered Diffraction (EBSD, Hikari XP). Vickers microhardness tests at a load of 0.05 kgf and a dwell time of 10 s were performed to measure the hardness distribution along the depth of the specimen.
The wear test was conducted on an HSR-2M friction testing machine at the condition of dry friction. The friction pair was ZrO2 with a diameter of 6 mm. The size of specimens for the wear test was Φ 25 mm. The parameters of the wear test were: a loading of 5 N, a sliding speed of5 m/min, and a duration of 20 min. The three-dimensional diagrams were reconstructed on a LEICA DCM3D laser confocal microscope. Five sectional profiles of the wear tracks were recorded to calculate average wear rates. The wear rate (δ) was calculated by the following equation [Citation20]:
(1)
(1) where ΔV indicates wear volume (m3), W is work (J), Fn represents applied load (N), and d indicates sliding distance (m).
3. Results and discussions
Figure (a) shows the XRD pattern of the CrCoFeNi alloy after annealing. As can be seen, the CrCoFeNi alloy is composed of a single FCC phase. Fine grains with an average size of 50 μm and homogeneous element distribution were obtained in the CrCoFeNi alloy (Figure (b,c)).
Figure 1. (a) XRD pattern, (b) microstructures and (c) the corresponding elemental distribution of the CrCoFeNi alloy after annealing.
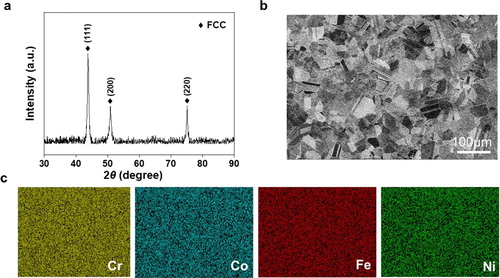
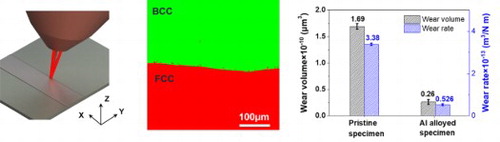
Figure (a) shows the SEM cross-sectional image of the Al-alloyed specimen. No visible cracks and defects is found in the surface layer. The corrugated interface indicates the metallurgical bond between the surface layer and substrate. The thickness of the surface layer is approximately 620 μm. Figure (b) shows elemental distributions along the depth of the cross-section, encompassing both the surface layer and substrate. Distributions of Fe, Co, Cr, Ni, Al elements are relatively uniform in the surface layer, suggesting the sufficient mixture of those elements. An area of 200 × 200 μm2 was used for composition quantification in the surface layer and the result is shown in Table . It can be seen that the chemical composition of the surface layer is approximately Al1.5CoCrFeNi. The XRD result confirms that the surface layer is composed of BCC/B2 phase (Figure (c)), as many previous studies show [Citation14,Citation22]. Figure (d–f) shows the EBSD characterizations of the area near the interface between the surface layer and substrate. The surface layer is composed of BCC phase, which is consistent with XRD results, while the substrate remains FCC phase (Figure (d)). The Inverse pole figure (IPF) map in Figure (e) reveals that the surface layer is mainly composed of equiaxed grains with random orientation, rather than oriented columnar grains which are commonly found in the additive manufacturing (AM) alloys [Citation23,Citation24] (Given that three-dimensional scale of grains, the X–Y, X–Z planes are also examined and found to be characterized by fine equiaxed grains likewise). Besides, the statistical grain size of the surface layer (dsurf) is approximately 12 μm on a Gauss distribution, as shown in Figure (f).
Figure 2. (a) Cross-sectional view of the surface layer and substrate. (b) Elemental distributions of Fe, Co, Cr, Ni, Al along the depth of the cross-section. (c) XRD pattern of the surface layer. (d) EBSD phase map of FCC and BCC phases. (e) IPF map near the interface between the surface layer and substrate. (f) The statistical grain size of the surface layer. (g) The equiaxed grain morphologies within the surface layer. (h–i) DF TEM images of the microstructure of the surface layer: (h) dendrite and (i) interdendrite taken from the (100) superlattice spot. The inset of (h) is the corresponding diffraction patterns.
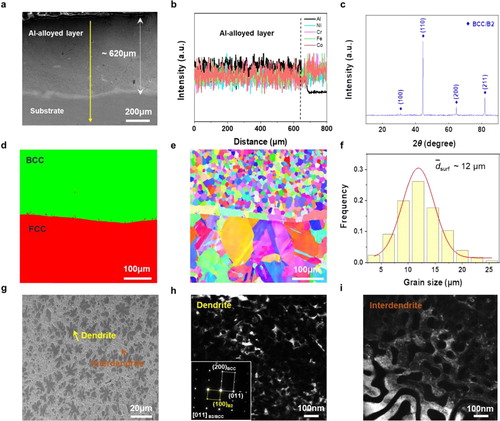
Table 1. Chemical compositions of the surface layer (at.%).
Based on the above analysis, it can be concluded that the addition of Al cause a shift in the stability of an FCC and BCC phase in the surface layer. In previous studies, many researchers were committed to predicting the phase stability for different HEA systems as a function of composition. Zhang et al. [Citation25] investigated the impact of the atomic size difference and the mixing enthalpy on the phase stability and found the solid solutions tend to form when −15 kJ/mol < ΔHmix < 5 kJ/mol, 1% < δ < 5%. Guo et al. [Citation12] showed valence electron concentration (VEC) can be used to predict the phase stability in HEAs by:
(2)
(2) where Ci denotes the atomic percentage of component i, (VEC)i denotes the VEC value of component i.
As such, FCC phase exists at VEC ≥ 8 while BCC phase exists at VEC < 6.87. The VEC of Al1.5CoCrFeNi and CrCoFeNi can be calculated based on Equation (2). The results show that CrCoFeNi has a VEC of 8.25, falling in the FCC stable area, while Al1.5CoCrFeNi has a VEC of 6.83, just inside the BCC stable area. The required parameters for the calculations are from Ref. [Citation12]. The phases predicted by the VEC rule are consistent with the XRD results (Figure (a) and Figure (c)).
According to the classical solidification theory, crystal morphology is mainly dependent on the original composition of an alloy, temperature gradient in solid/liquid interface (G) and solidification velocity (R). A high G/R ratio often facilitates the formation of columnar grains while a low G/R ratio facilitates the formation of equiaxed grains. In the laser AM process, G values are often extremely high up to 103 K/mm [Citation26] compared to approximately 1 K/mm in mould casting [Citation27]. Therefore, the final microstructures in AM process tend to be dominated by columnar grains. However, laser scanning speed in this work (60 mm/s) is relatively higher than that in the general AM process (<10 mm/s). That means the solidification rate becomes higher, decreasing the G/R ratio thereby promoting the formation of equiaxed grains.
Wang et al. [Citation14] fabricated Al1.5CoCrFeNi ingots using the vacuum arc remelting method. It exhibited similar equiaxed dendrite structure but with a much larger grain size of more than 100 μm compared to the current study (12 μm). Figure (g) shows equiaxed dendrite morphology inside grains. EDS reveals the enrichment of Al in the dendrite core and Cr segregates in interdendritic regions (Figure S2). The dendrites show irregular morphology, some of which are flowery while others are spherical, suggesting that dendrite fragmentation occurred during solidification [Citation28,Citation29]. The reason for the dendrite fragmentation phenomenon is that the neck of dendrite is thinner than other regions, which is unstable due to surface tension difference. During the subsequent solidification process, thicker regions would grow up at the expense of thin regions, as Ostwald ripening. On the other hand, when a negative temperature gradient exists in front of the solid/liquid interface during solidification, the crystallize latent heat would spread out from liquid phases radially. In the case of extreme undercooling, fine dendrites would be fused due to recalescence when the crystallised latent heat is released. These dendrite fragments can be natural nucleation sites for new grains, resulting in the ultimate fine equiaxed grain microstructure. Hunt [Citation30] and Gäumann et al. [Citation31] also suggested that high density of nucleation sites can be conducive to the formation of equiaxed grains despite high G values. Chai et al. showed that rapid non-equilibrium solidification during laser processing is conducive to grain refinement [Citation32].
The in-depth observation was conducted by TEM to reveal phase structures in the surface layer (Figure (h–i)). The diffraction pattern shows superlattice diffraction spots derived from B2 ordered structure. Dark field images taken from the (100) superlattice spot show the different morphology of the dendrite and interdendrite regions: spherical nanosized particles in the dendrite areas vs. cuboid and lath-shaped participates in the interdendrite areas, which is similar to Linden et al.’s results [Citation19].
Figure (a) shows the microhardness distribution of the specimen along the depth direction after laser alloying. The average hardness value of the surface layer is ∼536 HV, about three times that of the substrate (∼182 HV). As mentioned above, the addition of Al causes a shift of phase stability and induces the formation of BCC phase in the surface layer. BCC phase usually exhibits a higher hardness than FCC phase [Citation33]. Besides, refined microstructures in the surface layer can also make a contribution to hardness. Figure (b) shows the friction coefficient variations of the pristine specimen and Al-alloyed specimen as a function of test time. The mean friction coefficients of the pristine specimen and Al-alloyed specimen are 0.76 and 0.60, respectively. As shown in the 3D morphologies of both specimens (Figure (c,d)), the wear depth of the Al-alloyed specimen decreases remarkably versus the pristine specimen. Severe abrasive wear and local adhesive wear are observed on the worn surface of the pristine specimen, whereas the Al-alloyed specimen is just polished slightly. The wear volumes of the pristine specimen and the Al-alloyed specimen measured from Figure (c,d) are 1.69 × 10⁻¹⁰ and 0.26 × 10⁻¹⁰ μm3, respectively. The specific wear rates of both specimens are calculated to be 3.38 × 10⁻¹³ and 5.26 × 10⁻¹⁴ m3/N·m, respectively (Figure (e)). According to Archard’s law [Citation34], the wear resistance of materials is proportional to surface hardness. Therefore, the hard surface of the Al-alloyed specimen is responsible for the reduction of 80% in wear rate regarded to the pristine specimen.
Figure 3. (a) The microhardness distribution along the depth direction. (b) The friction coefficient variations vs test time of the pristine specimen and Al-alloyed specimen in a dry friction condition. (c–d) The three-dimensional program across the wear track of the pristine specimen (c) and Al-alloyed specimen (d). (e) Wear volumes and wear rates of the pristine specimen and Al-alloyed specimen.
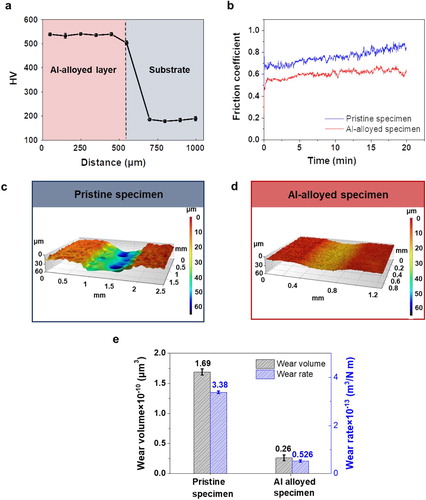
Figure shows worn surface morphologies of the pristine specimen and the Al-alloyed specimen. The insets in Figure (a,c) are the corresponding counterface balls after the wear tests. Ploughing grooves along the wear direction and adhesive layers are observed on the worn surface of the pristine specimen (Figure (a,b)). During the sliding process, the specimen underwent severe plastic deformation under the combined action of normal force and tangential force. From the image of worn ball (the inset in Figure (a)), a mass of materials transferred from the pristine specimen are observed on the ball surface. Therefore, the wear mechanism of the pristine specimen is predominantly adhesive wear, which is prevalent in soft and ductile materials [Citation35]. Besides, the process of wear was accompanied by oxidation due to heat through friction, evidenced by the high content of oxygen element on the worn surface (Table ). In contrast, the worn surface of the Al-alloyed specimen is relatively smooth with shallow scratches and debris, representing the improved wear resistance (Figure (c,d)). As mentioned above, good wear resistance is attributed to BCC phase formation in the Al-alloyed specimen. High hardness of BCC phase exhibits strong resistance to plastic deformation and then hinders the micro-cutting from the friction pair. Less adhesion can be seen on the surface of worn ball (the inset in Figure (c)). Besides, oxygen element is also detected on the worn surface (Table ). Therefore, the wear mechanism of the Al-alloyed specimen is oxidation wear and slight adhesive wear.
Figure 4. Worn surface morphologies of the pristine specimen (a, b) and Al-alloyed specimen (c, d). The insets in (a) and (c) are optical micrographs of the corresponding worn balls after wear tests.
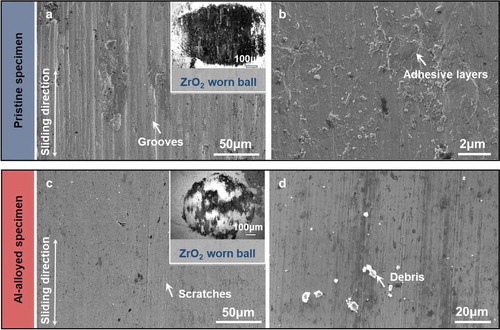
Table 2. Chemical compositions of the worn surface of the pristine specimen and Al-alloyed specimen (at.%).
4. Conclusion
In summary, the surface hardening of CrCoFeNi FCC HEA was achieved by in-situ synthesized BCC HEA via Al laser alloying. Al alloying leads to the shift of phase stability and generates the fine Al1.5CoCrFeNi grains with BCC structure on the CoCrFeNi FCC substrate. The Al-alloyed surface has a microhardness three times that of the substrate, which is responsible for the much lower wear rate. This work opens a door for achieving surface hardening of FCC HEAs by simple laser alloying technology.
Supplemental Material
Download MS Word (830.6 KB)Data availability statement
The data that support the findings of this study are available from the corresponding author upon reasonable request.
Disclosure statement
No potential conflict of interest was reported by the author(s).
Additional information
Funding
References
- Yeh JW. Nanostructured high-entropy alloys with multiple principal elements: novel alloy design concepts and outcomes. Adv Eng Mater. 2004;6:299–303.
- Cantor B, Chang I, Knight P, et al. Microstructural development in equiatomic multicomponent alloys. Mater Sci Eng A. 2004;375–377:213–218.
- Gludovatz B, Hohenwarter A, Catoor D, et al. A fracture-resistant high-entropy alloy for cryogenic applications. Science. 2014;345:1153–1158.
- Körmann F, Sluiter M. Interplay between lattice distortions, vibrations and phase stability in NbMoTaW high entropy alloys. Entropy. 2016;18:403.
- Senkov ON, Wilks GB, Miracle DB, et al. Refractory high-entropy alloys. Intermetallics. 2010;18:1758–1765.
- Vaidya M, Guruvidyathri K, Murty BS. Phase formation and thermal stability of CoCrFeNi and CoCrFeMnNi equiatomic high entropy alloys. JAlloys Compd. 2019;774:856–864.
- He F, Wang Z, Cheng P, et al. Designing eutectic high entropy alloys of CoCrFeNiNb x. JAlloys Compd. 2016;656:284–289.
- Liu WH, Lu ZP, He JY, et al. Ductile CoCrFeNiMox high entropy alloys strengthened by hard intermetallic phases. Acta Mater. 2016;116:332–342.
- Salishchev GA, Tikhonovsky MA, Shaysultanov DG, et al. Effect of Mn and V on structure and mechanical properties of high-entropy alloys based on CoCrFeNi system. JAlloys Compd. 2014;591:11–21.
- Lin D, Xu L, Jing H, et al. A strong, ductile, high-entropy FeCoCrNi alloy with fine grains fabricated via additive manufacturing and a single cold deformation and annealing cycle. Addit Manuf. 2020;36:101591.
- Lin Q, Liu J, An X, et al. Cryogenic-deformation-induced phase transformation in an FeCoCrNi high-entropy alloy. Mater Res Lett. 2018;6:236–243.
- Guo S, Ng C, Lu J, et al. Effect of valence electron concentration on stability of fcc or bcc phase in high entropy alloys. J Appl Phys. 2011;109:103505.
- Fan A-C, Li J-H, Tsai M-H. On the phase constituents of three CoCrFeNiX (X = V, Nb, Ta) high-entropy alloys after prolonged annealing. JAlloys Compd. 2020;823:153524.
- Wang W-R, Wang W-L, Wang S-C, et al. Effects of Al addition on the microstructure and mechanical property of AlxCoCrFeNi high-entropy alloys. Intermetallics. 2012;26:44–51.
- Joseph J, Jarvis T, Wu X, et al. Comparative study of the microstructures and mechanical properties of direct laser fabricated and arc-melted Al x CoCrFeNi high entropy alloys. Mater Sci Eng A. 2015;633:184–193.
- Yang T, Xia S, Liu S, et al. Effects of AL addition on microstructure and mechanical properties of Al CoCrFeNi high-entropy alloy. Mater Sci Eng A. 2015;648:15–22.
- Joseph J, Stanford N, Hodgson P, et al. Understanding the mechanical behaviour and the large strength/ductility differences between FCC and BCC AlxCoCrFeNi high entropy alloys. JAlloys Compd. 2017;726:885–895.
- Cai Y, Zhu L, Cui Y, et al. Fracture and wear mechanisms of FeMnCrNiCo + x(TiC) composite high-entropy alloy cladding layers. Appl Surf Sci. 2021;543:148794.
- Li X, Feng Y, Liu B, et al. Influence of NbC particles on microstructure and mechanical properties of AlCoCrFeNi high-entropy alloy coatings prepared by laser cladding. JAlloys Compd. 2019;788:485–494.
- Zhao P, Li J, Zhang Y, et al. Wear and high-temperature oxidation resistances of AlNbTaZrx high-entropy alloys coatings fabricated on Ti6Al4 V by laser cladding. JAlloys Compd. 2021;862:158405.
- Chai L, Zhu Y, Hu X, et al. A strategy to introduce gradient equiaxed grains into Zr sheet by combining laser surface treatment, rolling and annealing. Scr Mater. 2021;196:113761.
- Linden Y, Pinkas M, Munitz A, et al. Long-period antiphase domains and short-range order in a B2 matrix of the AlCoCrFeNi high-entropy alloy. Scr Mater. 2017;139:49–52.
- Thijs L, Kempen K, Kruth J-P, et al. Fine-structured aluminium products with controllable texture by selective laser melting of pre-alloyed AlSi10Mg powder. Acta Mater. 2013;61:1809–1819.
- Thijs L, Montero Sistiaga ML, Wauthle R, et al. Strong morphological and crystallographic texture and resulting yield strength anisotropy in selective laser melted tantalum. Acta Mater. 2013;61:4657–4668.
- Zhang Y, Zhou YJ, Lin JP, et al. Solid-solution phase formation rules for multi-component alloys. Adv Eng Mater. 2008;10:534–538.
- Guan S, Wan D, Solberg K, et al. Additive manufacturing of fine-grained and dislocation-populated CrMnFeCoNi high entropy alloy by laser engineered net shaping. Mater Sci Eng A. 2019;761:138056.
- Ares AE, Schvezov CE. Influence of solidification thermal parameters on the columnar-to-equiaxed transition of aluminum-zinc and zinc-aluminum alloys. Metall Mat Trans A. 2007;38:1485–1499.
- Mullis AM, Haque N. Evidence for dendritic fragmentation in as-solidified samples of deeply undercooled melts. J Cryst Growth. 2020;529:125276.
- Guan S, Solberg K, Wan D, et al. Formation of fully equiaxed grain microstructure in additively manufactured AlCoCrFeNiTi0.5 high entropy alloy. Mater Des. 2019;184:108202.
- Hunt JD. Steady state columnar and equiaxed growth of dendrites and eutectic. Mater Sci Eng. 1984;65:75–83.
- Gäumann M, Trivedi R, Kurz W. Nucleation ahead of the advancing interface in directional solidification. Mater Sci Eng A. 1997;226–228:763–769.
- Chai L, Wang C, Xiang K, et al. Phase constitution, microstructure and properties of pulsed laser-clad ternary CrNiTi medium-entropy alloy coating on pure titanium. Surf Coat Technol. 2020;402:126503.
- Xiang K, Chen L-Y, Chai L, et al. Microstructural characteristics and properties of CoCrFeNiNbx high-entropy alloy coatings on pure titanium substrate by pulsed laser cladding. Appl Surf Sci. 2020;517:146214.
- Archard JF. Contact and rubbing of flat surfaces. J Appl Phys. 1953;24:981–988.
- Zhang S, Wu CL, Yi JZ, et al. Synthesis and characterization of FeCoCrAlCu high-entropy alloy coating by laser surface alloying. Surf Coat Technol. 2015;262:64–69.