
 ?Mathematical formulae have been encoded as MathML and are displayed in this HTML version using MathJax in order to improve their display. Uncheck the box to turn MathJax off. This feature requires Javascript. Click on a formula to zoom.
Abstract
Oxygen-affected cracking commonly presents on thin Ni-based single crystal superalloy components serving in high temperature and oxidizing environments. This study uses a newly developed in-situ thermal-stress environmental transmission electron microscope to investigate the oxidation and fracture behaviors of Ni-based single crystal superalloy at 650°C under stress. The in-situ oxidation was found to change the tensile fracture mode from the close-packed {111} planes of plastic fracture to planes adjacent to γ/γ′ interfaces of brittle fracture. The microanalysis also revealed that the γ′ cuboids, γ phase, and γ/γ interface exhibit different oxidation behavior, thus underscoring the thickness debit effect.
GRAPHICAL ABSTRACT
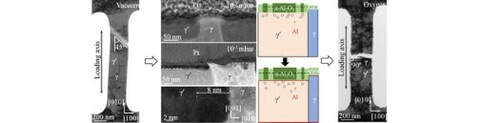
IMPACT STATEMENT
This paper firstly time provides direct in-situ oxygen-affected cracking behavior.
Introduction
Ni-based single crystal superalloys are exclusive materials used for turbine blades of modern aircraft engines [Citation1–3]. In the modern design of turbine blades, blade wall thickness has been continuously reduced to reduce overall weight and enhance cooling efficiency [Citation4,Citation5]. The reduced blade wall thickness causes shortening of the creep rupture life of the blades, known as the thickness debit effect [Citation6–8]. The thickness debit effect has been mainly ascribed to oxidation, which reduces the effective load-bearing area of a blade [Citation4,Citation9]. However, this factor has been demonstrated to be insufficient to explain the difference in creep rate in different atmospheres. Several other factors have also been suggested, e.g. vacancy formation due to selective leaching, conversion of γ to γ′ due to depletion of Al by selective oxidation, preferential oxidation along the γ/γ′ interfaces [Citation10–12].
Oxidation of Ni-based single crystal superalloys does not happen uniformly. The L12 γ′ phase and the face-centered cubic (fcc) γ phase in Ni-based single crystal superalloys are known to have different element concentrations, e.g. Al, Ti, and Ta prefer to segregate into the γ phase. In contrast, Cr, Co, W, and Re prefer to segregate into the γ phase [Citation13–15]. Ta, Ti, and Al have the highest affinity to oxygen and thus tend to oxidize first [Citation16,Citation17]. This leads to selective oxidation among the different elements and between the γ′ and γ phases [Citation18,Citation19]. Another characteristic of oxidation is the behavior of the {100} γ/γ interfaces [Citation18,Citation20]. Ding et al. observed oxygen segregation in the γ/γ′ interfaces using electron energy loss spectroscopy mapping analysis, indicating preferential oxidation along with the γ/γ′ interfaces [Citation12]. This is likely to cause local weakening of the alloy matrix and promote local crack formation and propagation, contributing to the thickness debit effect.
Previous studies on the oxidation of Ni-based superalloys have mainly focused on the structure and morphology of oxidation products, oxidation kinetics, and the stability of the oxides at different temperatures [Citation21–23]. Few studies have been conducted to investigate the oxidation-assisted cracking of these alloys. To fill this knowledge gap, an in-situ TEM study of the oxidation process of a Ni-based single crystal superalloy was conducted in an oxidation environment at elevated temperatures in an environmental transmission electron microscope (ETEM), as reported here.
Experiment
A homemade Ni-based superalloy was used in this study. Its nominal composition is 5.9 at. % Co, 2.3 at. % Cr, 0.7 at. % Mo, 3.7 at. %W, 11.4 at. % Al, 1.0 at. % Ta, 2.9 at. % Re and with Ni in balance. The alloy was fabricated into a single crystal cylindrical ingot in the [001] axial direction via directional solidification using the conventional Bridgman method. The ingot is ϕ15 × 150 mm3 in dimension. The ingot was solution-treated at 1365°C for 24 h in a flowing Ar atmosphere, then aged in a two-stage process involving heating at 1150°C for 5 h followed by a second stage at 870°C for 24 h. The ingot was cooled in the air after the aging treatment.
The experiments were conducted on a Bestron-ThermalFisher™ in-situ thermal-stress environmental transmission electron microscope. The thin plate-shaped samples of ∼70 nm in thickness for in-situ tensile testing in TEM were fabricated by the focused ion beam (FIB) milling method using a Helios Nanolab 600i instrument. They were then cut into a dumbbell shape, with the length aligned to [010] and the plate normal in [001] directions. The dumbbell-shaped samples were then transferred and secured onto a micro-electro-mechanical system (MEMS) device specially designed for conducting in-situ thermal-mechanical testing inside the microscope. The MEMS device is integrated into a Bestron INSTEMS-MT-1200 TEM sample holder. It allows the sample to be heated to and maintained at different temperatures up to 1150°C while applying a tensile deformation [Citation24]. The in-situ tensile tests were performed under displacement control mode with a loading rate of 1–2 nm/s.
In-situ oxidation experiments were conducted at 650°C in an FEI-Titan-ETEM operated at 300 kV. A differential pumping system was used to control the gas pressure around the sample. After the sample was heated to 650°C, pure O2 (99.999%) was injected into the ETEM. Two different O2 partial pressures were used, i.e. 10−3 and 10−1 mbar. All samples were pre-conditioned inside the microscope for 10 min before deformation to form a thin oxide surface layer to mimic the natural condition of the alloy in a real-life situation. Ex-situ oxidation experiments were conducted under the same conditions. The cross-sectional samples were lifted from the micro-bulk sample without electron beam irradiation for ex-situ observation, as shown in Fig. S5.
Results and discussion
Figure presents the original microstructure, the sample preparation, and the testing process of the superalloy. Figure (a-1 to a-3) shows the high-angle annular dark-field (HAADF) image and the distribution of the elements of the original microstructure. The γ phase is brighter than the γ′ phase due to its higher concentrations of heavier elements (Co, Cr, Re, and W) than γ′ phase (Ni and Al). Figure (b-1 to b-6) schematically shows the in-situ test sample preparing process. Firstly, a micro-bulk sample was obtained from the bulk sample using ion beam cutting, the Pt protective layer is deposited on the front side of the micro-bulk. Then the W needle was used to transfer the micro-bulk to the MEMS. Finally, the thickness of the micro-bulk was thinned to ∼70 nm in dumbbell shape using the ion beam. The preparing process in the real sample is also shown in Figure (c-1 to c-3).
Figure 1. The original microstructure, the sample preparation, and the testing process of the superalloy. (a) the microstructure and elements distribution of superalloy in original state. (b) The schematic image of the tensile sample preparation process. (c-1)–(c-3) The secondary electron images of preparing the real sample. (c-4) TEM image of the sample after exposure in vacuum at 650°C for 10 min. (c-5) TEM image of the sample after tensile deformation. (c-6) the SAED pattern of (c-4). (c-7) The schematic image of the fractured surface.
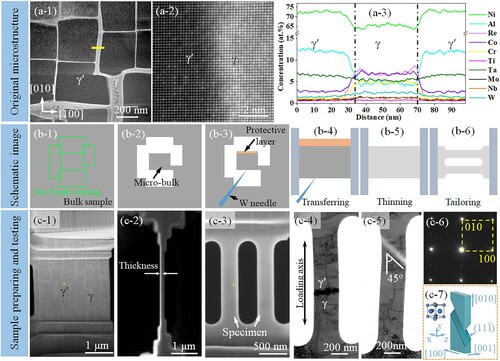
Figure (c-4) shows a TEM image of the sample after holding at 650°C for 10 min in a vacuum (10−7 mbar). Figure (c-6) shows a selected area electron diffraction (SAED) pattern, confirming the sample orientation. The sample was then deformed in tension to fracture. Figure (c-5) shows the sample just before fracture, still under load. The necking trace on the sample surface is at 45° from the [010] loading direction. The fractured surface was found to be planar on a surface non-perpendicular to the sample surface, consistent with the expectation of a (111) cleavage plane, the close-packed plane in the fcc structure, as shown in Figure (c-7). Other fractured results of the vacuum tensile test are shown in supplementary image Fig. S1.
Three dumbbell-shaped samples were also deformed at 650°C in-situ inside the microscope but in an oxygen atmosphere. Figure (a) shows a sample after the pre-treatment at 10−3 mbar. Some small oxide particles have formed on the surface (the particles in dark contrast). Figure (b) shows the sample after fracture. The facture surface is roughly perpendicular to the sample length direction ([010]). Figure (c–f) shows the TEM images of two other samples pre-oxidized for 10 min at 10−1 mbar O2 partial pressure. Similarly, the factures also occurred perpendicular to the sample length direction. The oxides around the γ/γ′ interface, where the intergranular-like fracture happened, are added in supplementary image Fig. S2.
Figure 2. In-situ TEM examination of samples deformed at 650°C in oxygen atmosphere. The samples were pre-oxidized for 10 min inside the microscope before deformation. (a) TEM image of a sample pre-oxidized at 10−3 mbar O2 partial pressure. (b) TEM image of a sample after tensile deformation in the oxygen atmosphere to fracture. (c) and (d) TEM image of sample II after the initial oxidation and fracture in tension in 10−1 mbar. (e) and (f) TEM image of sample III after the initial oxidation and fracture in tension in 10−1 mbar.
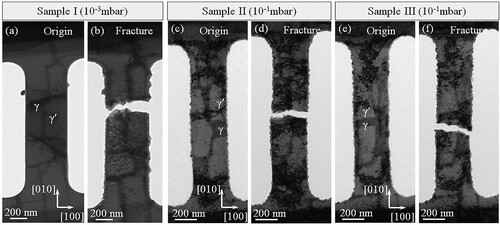
Figure shows the analysis of a sample oxidized under 10−1 mbar oxygen pressure at 650°C for 10 min. Figure (a) is a [001] cross-section HAADF view of the sample. Figure (b–d) shows the energy dispersive X-ray spectrometry (EDS) mapping of O, Ni, and Al of the area. The oxide layer is ∼45 nm thick, with the oxide on the γ′ surface had a more uniform thickness whereas that on the γ surface was much more irregular in thickness and morphology. The oxidized thickness of the metal was used as a reflection of the oxidation rate. After fine processing by the focus ion beam, the surfaces of the original samples are smooth. This smooth surface renders an easy thickness detection of the unoxidized region. The γ and γ′ phases have different unoxidized thicknesses, thus indicating different oxidation rates. Figure (e, f) shows the EDS line scans along the two dashed lines indicated in Figure (a), across the γ and γ′ phases, respectively. It is evident that the oxide on the γ phase contained more Al but less Ni compared to the oxide formed on the γ phase. Due to the faster oxidation rate of γ′, the content of Ni in both γ and γ′ phases decreased to an approximately equal level. The elements distribution of a sample under 10−3 mbar oxygen pressure at 650°C for 10 min is shown in Fig. S3.
Figure 3. TEM analysis of a sample oxidized under 10−1 mbar oxygen pressure at 650°C for 10 min. (a) A HAADF image of the cross-section of the sample. The observation direction is [001]. (b)–(d) EDS mapping of O, Ni, and Al, respectively. (e) EDS line scan along with line e in (a) across the γ phase. (f) EDS line scan along with line f in (a) across the γ′ phase.
![Figure 3. TEM analysis of a sample oxidized under 10−1 mbar oxygen pressure at 650°C for 10 min. (a) A HAADF image of the cross-section of the sample. The observation direction is [001]. (b)–(d) EDS mapping of O, Ni, and Al, respectively. (e) EDS line scan along with line e in (a) across the γ phase. (f) EDS line scan along with line f in (a) across the γ′ phase.](/cms/asset/af5ed7fd-7189-4223-9d0a-911679a03178/tmrl_a_1993367_f0003_oc.jpg)
To identify the oxide species formed, nanobeam electron diffraction technique was used. Figure (a) is a HAADF image of the area indicated by the yellow dashed box in Figure (a). The area is divided into 10×10 small square domains, with each being 20 × 22 nm2 in size. Figure (b) shows the nanobeam diffraction patterns of all the small domains in this area. Four phases can be verified based on their crystal structures, i.e. Pt in white, the oxide in orange, and γ′ in blue and γ in cyan. Figure (c) shows the schematic diagram of the sampling method in Figure (a). Based on this, Figure (a) shows the vertical section of the sample, and the evolution of oxidation state in depth direction is shown. Figure (d-1 to d-6) shows some enlarged nanobeam diffraction patterns seen in Figure (b), they can index to polycrystalline Pt (x1y10), polycrystalline NiO(x10y8), polycrystalline NiO and α-Al2O3(x3y7), [001] single crystal NiO(x4y6), γ′(x1y5) and γ(x6y5) respectively. The formation of them is due to α-Al2O3 has the lowest Gibbs energy of formation than NiO and thus is the first to form on the γ′ phase [Citation25–27]. However, the Al only has a content ∼13 at. % in the γ′ phase and close to zero in the γ phase. Therefore, the α-Al2O3 formed is insufficient to cover the full surface of the γ′ phase, leaving the opportunity for NiO to form concurrently.
Figure 4. The microstructure analysis on the vertical and horizontal sections of a sample oxidized under 10−1 mbar oxygen pressure. (a) A HAADF image of the cross-section of the sample. The observing direction is [001]. (b) The nanobeam diffraction patterns of 10×10 local domains of the viewing area. (c) The schematic image of lifting out the sample in (a). (d-1)–(d-6) Enlarged views of a few selected nanobeam diffraction patterns in different regions. (e) HAADF image of a γ/γ′ interface region observed from [010]. (f) Enlarged view of the rectangle region (e). (g) FFT patterns from the left, the middle (interface), and the right regions in (f). (h) The schematic image of lifting out the sample in (e).
![Figure 4. The microstructure analysis on the vertical and horizontal sections of a sample oxidized under 10−1 mbar oxygen pressure. (a) A HAADF image of the cross-section of the sample. The observing direction is [001]. (b) The nanobeam diffraction patterns of 10×10 local domains of the viewing area. (c) The schematic image of lifting out the sample in (a). (d-1)–(d-6) Enlarged views of a few selected nanobeam diffraction patterns in different regions. (e) HAADF image of a γ/γ′ interface region observed from [010]. (f) Enlarged view of the rectangle region (e). (g) FFT patterns from the left, the middle (interface), and the right regions in (f). (h) The schematic image of lifting out the sample in (e).](/cms/asset/a5b03fd6-3f77-4e03-acac-76e4a0b941ed/tmrl_a_1993367_f0004_oc.jpg)
In addition to the above, {001} γ/γ′ interfaces inside the alloy may also experience a higher oxidation rate. Figure (e) shows a top view of the oxidized sample, i.e. viewing from [010] direction. The surface oxide scale had been removed by FIB. The γ/γ′ interface region is 2∼13 nm in width, and it presents a clear contrast that is different from either γ or γ′. Figure (f) shows an enlarged HAADF image of the rectangular region identified in Figure (e). The γ/γ′ interface region shows a blurred crystal structure. Figure (g) shows the FFT patterns of the left, the middle (the interface), and the right regions in Figure (f). The pattern from the left to right regions are indexed to NiO, with no diffraction spot and γ phase, respectively. The image blurredness of the interface region may imply amorphization or it is being off a zone axis. The different oxides type also indicates the γ/γ′ interface proceeds a different oxidation behavior than the adjacent γ or γ′ phases. Figure (h) shows the schematic diagram of sampling method in Figure (e). Based on this, Figure (e) shows the horizontal section of the sample which roughly corresponds to the layer y6, and the different oxidation states of γ′ phase, γ/γ′ interface and γ phase in the same depth are shown.
To further investigate the oxidation behavior of the γ/γ′ interface, two samples are further oxidized under an oxygen pressure of 10−3 and 10−1 mbar at 650°C for 100 min respectively, as presented in Figure . Figure (a) shows the HAADF image of the vertical section for sample oxidized under 650°C-10−3 mbar for 100 min. It isn't easy to guarantee the obtained horizontal section of the sample corresponds to the y5 layer of Figure (b), i.e. the γ and γ′ phases remain unoxidized. The sample is prepared normally to the [011] directional to investigate the distribution of oxides, as schematically shown in Figure (a-4). Figure (a-1) shows a HAADF image in low magnification. The outside oxidation layer can be seen at the top of the sample. In addition, some particles in dark contrast with the dimension of ∼5 nm can be observed at the γ/γ′ interface, as indicated in the yellow dash rectangle. Figure (a-2) is the enlarged HAADF image of Figure (a-1) selected rectangle. The particle contains a different atomic structure from the surrounding γ or γ′ phase, as the structure changes to blurry. The EDS mapping results of O, Al, and Ni shown in Figure (a-3) indicate it contains a higher oxide magnitude, thus the particle should be the oxide. This further indicates the γ/γ′ interface can promote the formation of oxides. Figure (b) shows the HAADF image of the horizontal section of the sample under 650°C-10−3 mbar for 100 min. The observation direction is [010] as schematically shown in Figure (b-4). Under the condition, the particles have larger sizes (∼100 nm), distributed preferentially with one side contact to the γ/γ′ interface. The atomic structure (Figure (b-2)) and EDS mapping (Figure (b-3)) analysis also indicate these particles to be oxides. It indicates that, as the oxidation progresses, the nano-oxide particles (∼5 nm) in Figure (a) will spread out and transform to bigger nano-oxide particles (∼100 nm) shown in Figure (b). The different morphology of oxide particles at the interface region under different conditions and observation directions supporting the statement that the oxides particles preferentially formed at the γ/γ′ interface.
Figure 5. TEM analysis of two samples oxidized under 10−3 and 10−1 mbar oxygen pressure at 650°C for 100 min. (a-1) and (a-2) The HAADF images of the sample under 650°C-10−3 mbar for 100 min in low and high magnification. The observing direction is [011]. (a-3) The O, Al, and Ni distribution map of the (a-2). (a-4) The schematic image of lifting out the sample in (a-1). (b-1) and (b-2) the HAADF images of the sample under 650°C-10−1 mbar for 100 min in low and high magnification. The observing direction is [010]. (b-3) The O, Al, and Ni distribution map of the (b-2). (b-4) The schematic image of lifting out the sample in (b-1).
![Figure 5. TEM analysis of two samples oxidized under 10−3 and 10−1 mbar oxygen pressure at 650°C for 100 min. (a-1) and (a-2) The HAADF images of the sample under 650°C-10−3 mbar for 100 min in low and high magnification. The observing direction is [011]. (a-3) The O, Al, and Ni distribution map of the (a-2). (a-4) The schematic image of lifting out the sample in (a-1). (b-1) and (b-2) the HAADF images of the sample under 650°C-10−1 mbar for 100 min in low and high magnification. The observing direction is [010]. (b-3) The O, Al, and Ni distribution map of the (b-2). (b-4) The schematic image of lifting out the sample in (b-1).](/cms/asset/5e029401-d280-4c2b-b496-f6f9a99111c3/tmrl_a_1993367_f0005_oc.jpg)
Based on the evidence presented above, the initial oxidation process can be summarized below (as schematically shown in Fig. S4). Firstly, the α-Al2O3 has a relatively lower Gibbs energy than NiO and thus is the first to form on the γ′ phase. However, the Al only has a content ∼13 at. % in the γ′ phase and close to zero in the γ phase. Therefore, the α-Al2O3 formed is insufficient to cover the whole surface of the γ′ phase, leaving the opportunity for NiO to form concurrently. Al supply is much exhausted with the oxidation process, within the γ′ phase near the surface, and a continuous NiO layer is forced to form at the oxide–metal interface. Differently, the NiO oxides are formed on the γ phase during the whole process. As shown in Figure , the oxides formed at the γ/γ′ interface are different from those of γ and γ′ phases, suggesting different oxidation behaviors experienced by the interface. The lattice misfit causes lattice distortion and a high energy state at the interface renders it acting as a preferential path for oxygen nucleation and diffusion [Citation12,Citation28–31]. Thus, the γ/γ′ interface appears to experience severer oxidation.
With the above evidence, we may discuss the reason for the change of the fracture behavior upon tension after oxidation. The fracture surface direction changed from ∼45° from the tensile loading axis, along the crystallographic planes of the sample, to ∼90° from the loading axis, along the
planes after oxidation. The fracture along
in the unoxidized sample indicates plastic deformation and ductile fracture. The fracture along
in the oxidized sample implies a patterned weakening or lowered ductility. This may be due to three reasons. Firstly, the different oxidation rates of the γ and γ′ phases caused a thickness difference between the two phases, with the γ′ phase being more reduced and being the relatively weaker part. Second, due to selective leaching of Al, vacancies formed during oxidation in the γ′ phase, which further decreases the strength and reduces the ductility of the γ′ phase [Citation32–34]. Thirdly, the γ/γ′ interface exhibits different oxidation behavior than its neighboring γ and γ′ phases, further weakening the matrix integrity along the orthogonal <001> directions. In addition, the difference in oxidation depth between the γ and γ phases causes local geometrical discontinuities. Thus, stress concentration forms along with the γ/γ′ interfaces. This may also contribute to the fracture along the {001} direction of the thin foil TEM samples. The oxidation changes crack modes behavior is likely to cause local weakening of the alloy and further contribute to the thickness debit effect, e.g. the reduced creep life of thin turbine blade [Citation35].
Whereas the in-situ TEM study presented above allowed the opportunity to collect direct evidence of the oxidation process, the oxide products formed, and the fraction behavior of the alloy as affected by oxidation, it ought to be made clear that the observations made of TEM samples of very small dimensions, in this case, may not represent the behavior of the real-life Ni-based superalloy components accurately. Oxidation is a surface phenomenon. The relative contribution (damage) of surface oxidation to the fracture behavior of a thin foil TEM sample is much greater than to a bulk sample.
Conclusions
Oxidation changes the fracture characteristics of the alloy from the dominantly shear deformation rapture along {111} to normal direction breakage rupture along {001}. The γ and γ′ phases exhibit different oxidation behaviors, apparently related to their different chemical compositions. The oxide formed on the γ phase is NiO. The oxide formed on the γ phase is α-Al2O3/NiO composite. The γ/γ′ interface appears to experience more severe oxidation. The change of fracture mode after oxidation is attributed to several compounded factors, including the loss of ductility and strength of the γ phase due to selective leaching of Al, the geometrical non-uniformity between γ and γ′ phases due to differential oxidation, and the weakening of the γ/γ′ interfaces due to preferential oxidation.
Supplemental Material
Download MS Word (4.3 MB)Acknowledgments
The work was supported by the Natural Science Foundation of China (Nos. 91860202, 51988101, 52071003, 11604006); Beijing Municipal Education Commission Project (PXM2020_014204_000021); Beijing Outstanding Young Scientists Projects (BJJWZYJH01201910005018); Project funded by China Postdoctoral Science Foundation 2020 M670073; Beijing Natural Science Foundation (Z180014); project (DB18015); Y. Liu’s participation in this work is supported by the Australian Research Council in grant DP190102990.
Disclosure statement
No potential conflict of interest was reported by the author(s).
Additional information
Funding
References
- Reed RC. The superalloys: fundamentals and applications. Cambridge: Cambridge University Press; 2008.
- Donachie MJ, Donachie SJ. Superalloys: a technical guide. Ohio: ASM International; 2002.
- Pollock TM. Alloy design for aircraft engines. Nat Mater. 2016;15:809–815.
- Le Bihan Y, Joubert P-Y, Placko D. Wall thickness evaluation of single-crystal hollow blades by eddy current sensor. NDT&E Int. 2001;34:363–368.
- Koff BL. Gas turbine technology evolution: a designers perspective. J Propuls Power. 2004;20:577–595.
- Cassenti B, Staroselsky A. The effect of thickness on the creep response of thin-wall single crystal components. Mater Sci Eng A. 2009;508:183–189.
- Hu Y, Zhang L, Cheng C, et al. Influence of specimen thickness on the creep behavior of a directional solidification nickel-based superalloy. Vacuum. 2018;150:105–115.
- Wen Z, Pei H, Li D, et al. Thickness influence on the creep response of DD6 Ni-based single-crystal superalloy. High Temp Mater Process. 2016;35:871–880.
- Wang XM, Liu H, Hui YZ, et al. Quantitative study of the microstructure evolution along the thickness direction in the nickel-based single crystal superalloy DD6 at 1323 K thermal exposure. Mater Charact. 2019;154:285–293.
- Fournier L, Delafosse D, Magnin T. Oxidation induced intergranular cracking and Portevin-Le Chatelier effect in nickel base superalloy 718. Mater Sci Eng A. 2001;316:166–173.
- Pei H, Wen Z, Yue Z. Long-term oxidation behavior and mechanism of DD6 Ni-based single crystal superalloy at 1050 °C and 1100 °C in air. J Alloys Compd. 2017;704:218–226.
- Ding Q, Shen Z, Xiang S, et al. In-situ environmental TEM study of γ-γ phase transformation induced by oxidation in a nickel-based single crystal superalloy. J Alloys Compd. 2015;651:255–258.
- Long H, Wei H, Liu Y, et al. Effect of lattice misfit on the evolution of the dislocation structure in Ni-based single crystal superalloys during thermal exposure. Acta Mater. 2016;120:95–107.
- Long H, Mao S, Liu Y, et al. Microstructural and compositional design of Ni-based single crystalline superalloys ― A review. J Alloys Compd. 2018;743:203–220.
- Hemmersmeier U, Feller-Kniepmeier M. Element distribution in the macro- and microstructure of nickel base superalloy CMSX-4. Mater Sci Eng A. 1998;248:87–97.
- Seetharaman S. Treatise on process metallurgy, volume 3: industrial processes. Amsterdam: Elsevier; 2013.
- Zhang JS. High temperature deformation and fracture of materials. Sawston: Woodhead Publishing; 2010.
- Edmonds IM, Evans HE, Jones CN. The role of the γ precipitate dispersion in forming a protective scale on Ni-based superalloys at 750°C. Oxid Met. 2010;73:193–206.
- Sato A, Chiu YL, Reed RC. Oxidation of nickel-based single-crystal superalloys for industrial gas turbine applications. Acta Mater. 2011;59:225–240.
- Ma J, Jiang W, Wang J, et al. Initial oxidation behavior of a single crystal superalloy during stress at 1150°C. Sci Rep. 2020;10:1–9.
- Hu Y, Cao T, Cheng C, et al. Oxidation behavior of a single-crystal Ni-based superalloy over the temperature range of 850°C–950°C in air. Appl Surf Sci. 2019;484:209–218.
- Xiao J, Yang H, Liu H, et al. Strengthening-softening transition in yield strength of nanotwinned Cu. Scr Mater. 2019;162:372–376.
- Ye X, Yang B, Nie Y, et al. Influence of Nb addition on the oxidation behavior of novel Ni-base superalloy. Corros Sci. 2021;185:109436.
- Zhang J, Li Y, Li X, et al. Timely and atomic-resolved high-temperature mechanical investigation of ductile fracture and atomistic mechanisms of tungsten. Nat Commun. 2021;12:2218.
- Cheng CQ, Hu YB, Cao TS, et al. Two typical oxidation models on nickel-based superalloys under different initial surface roughness. Corros Sci. 2020;176:108942.
- Liu Y, Wu Y, Wang J, et al. Oxidation behavior and microstructure degeneration of cast Ni-based superalloy M951 at 900 °C. Appl Surf Sci. 2019;479:709–719.
- Cruchley S, Evans H, Taylor M. An overview of the oxidation of Ni-based superalloys for turbine disc applications: surface condition, applied load and mechanical performance. Mater High Temp. 2016;33:465–475.
- Zhu Q, Pan Z, Zhao Z, et al. Defect-driven selective metal oxidation at atomic scale. Nat Commun. 2021;12:1–8.
- Zhai Y, Chen Y, Zhao Y, et al. Initial oxidation of Ni-based superalloy and its dynamic microscopic mechanisms: The interface junction initiated outwards oxidation. Acta Mater. 2021;215:116991.
- Langelier B, Persaud SY, Korinek A, et al. Effects of boundary migration and pinning particles on intergranular oxidation revealed by 2D and 3D analytical electron microscopy. Acta Mater. 2017;131:280–295.
- Sanviemvongsak T, Monceau D, Desgranges C, et al. Intergranular oxidation of Ni-base alloy 718 with a focus on additive manufacturing. Corros Sci. 2020;170:108684.
- Neil B, Meier GH, Pettit FS. Introduction to the high temperature oxidation of metals. Cambridge: Cambridge University Press; 2006.
- Ramsay JD, Evans HE, Child DJ, et al. The influence of stress on the oxidation of a Ni-based superalloy. Corros Sci. 2019;154:277–285.
- Oleksak RP, Kapoor M, Perea DE, et al. The role of metal vacancies during high-temperature oxidation of alloys. NPJ Mater Degrad. 2018;2:1–8.
- Evans AG, He MY, Suzuki A, et al. A mechanism governing oxidation-assisted low-cycle fatigue of superalloys. Acta Mater. 2009;10:2969–2983.