
 ?Mathematical formulae have been encoded as MathML and are displayed in this HTML version using MathJax in order to improve their display. Uncheck the box to turn MathJax off. This feature requires Javascript. Click on a formula to zoom.
Abstract
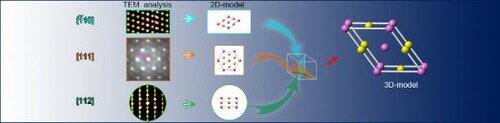
The chemical short-range orders (CSRO) are the sub-nanosized entities inherent in high-/medium-entropy alloys (H/MEA). To discern CSRO poses the challenge with pending issues as to under what zone axis in electron diffraction, signature scattering specific to CSRO will appear and what the structure motif of CSRO is. Here, we show extra diffuse scattering by CSRO from [111] and [112] directions in a VCoNi MEA and accordingly, construct the -type structure motif, and derive the spacial shape of flat cuboid of CSRO in virtue of diffractions under varying zone axis. Moreover, we demonstrate the methods to identify CSRO in lattice images.
GRAPHICAL ABSTRACT
IMPACT STATEMENT
The structure motif is constructed as -type for chemical short-range order in a medium-entropy alloy in terms of electron diffractions under the multiple zone axis.
1. Introduction
High-/medium-entropy alloys (H/MEA) are the complex concentrated solid solution composed of multi-principal elements [Citation1,Citation2], showing an improved synergy between strength and ductility [Citation3–7]. In H/MEA, constituent species would be much likely to make enthalpic interactions large enough locally such that the local chemical order (LCO) is induced in the basal solid solution [Citation8–11]. The chemical short-range order (CSRO) is the incipient LCO in H/MEAs [Citation9,Citation10], akin to the counterparts in the conventional alloys [Citation12–19]. By definition, CSRO refers to the preference/avoidance of some species in the alloy away from atomic fractions expected for random mixing, but the chemical order is short-ranged such that it prevails only in the first and the next couple of nearest-neighbor atomic shells around the atom at center. In this sense, CSRO is usually at the sub-nanoscale in size, without lattice periodicity. CSRO is considered as an iconic entities inherent in H/MEA [Citation20–29], playing a key role in dislocation behaviors [Citation10,Citation27], strain hardening [Citation27], and macroscopic mechanical properties such as strength and ductility [Citation11,Citation21,Citation22,Citation25].
So far how to identify convincingly CSRO becomes undisputedly the top question. To demonstrate CSRO, there are two kinds of experimental techniques. One is indirect, such as the fitting of the X-ray or neutron data [Citation30] as well as the three-dimensional atom probe tomography (3D-APT) [Citation31]; while the other is the ‘seeing-is-believing’ strategy by the direct observation of CSRO using the state-of-the-art (e.g. high-resolution, HR) transmission electron microscope (TEM) [Citation21,Citation24,Citation27]. For the latter, electron diffraction seems the most appropriate way capable of directly digging out the direct evidence of CSRO [Citation14–17,Citation24,Citation27,Citation32–34]. To be specific, in the selected-area electron diffraction pattern, CSRO may give off the extra superlattice scattering, usually in the form of diffuse disks with the diameters substantially larger than those of Bragg spots of base lattices [Citation34]. Such diffraction information in reciprocal space demonstrates the presence of CSRO entities in real space, with the sizes at the (sub-)nanometer scale [Citation34]. But for H/MEAs, the challenge emerges to identify CSRO in this way. On one hand, the basis to discern CSRO is the proprietary, CSRO-induced scattering, even much diffuse. Yet, these reflections show a much low intensity due to the moderate volume density of CSROs and their small sizes typically below one nanometer. The scattering signals are, therefore, much weak and highly diffuse such that it is hard to distinguish them from the noised background [Citation24,Citation27], even though an in-column Ω energy filtered TEM is used to enhance the signal-to-noise ratio of diffraction contrast from CSRO [Citation24]. On the other hand, an appropriate zone axis is necessary to display reflections by CSRO, as the diffraction intensity varies with crystallographic orientations [Citation27,Citation34]. On this account, it is better to check various zone axes for diffraction patterns. For example, scattering by CSRO is discernable under the [112] zone axis in an fcc base [Citation27], yet disappear under the routinely used [110] one. Simply, two puzzling issues remain as to how likely scattering by CSRO appears under a specific zone axis and whether or not scattering under various zone axis is ascribed to the same CSRO.
The electron diffractions under multiple zone axes would help to establish the structure motif of CSRO, i.e. the three-dimensional (3D) unit cell of chemical occupation of species [Citation30]. The structure motif inevitably exists in CSRO even without the definite lattice periodicity due to small sizes. The structure motif will facilitate an in-depth understanding of the CSRO formation and particularly, the relationship between CSRO and host phase, and the evolution of CSRO later into the medium-/long-range order.
Here, an equiatomic ternary VCoNi MEA was selected as the model material [Citation27,Citation35,Citation36]. Following the processing conditions in the early investigation [Citation27], the microstructure was obtained where the CSRO is formed in a face-center-cubic (fcc) base after recrystallization annealing at 880°C for 3 min. We will look for more zone axes having electron diffractions by CSRO, in addition to the [112] zone axis reported already [Citation27]. On this basis, we will build up the structure motif of CSRO with the help of mutual relationship and lattice correspondence between real and reciprocal spaces. Finally, the three-dimensional spacial shape of CSRO is derived.
2. Results and discussion
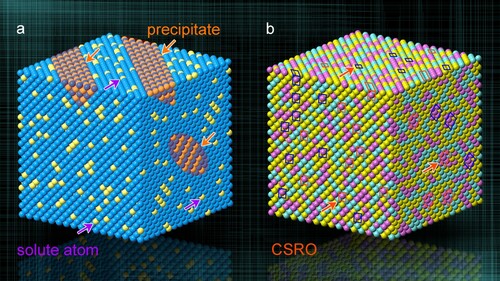
Solute atoms, labeled by solid spheres in yellow, Figure (a), in conventional alloys usually show the typical configurations of two kinds, i.e. those in a solution of solvent atoms and those in the form of a precipitate. Thereinto, atoms are randomly mixed in the former (purple arrows), while appear periodic in the latter (orange arrows) with solute concentration often much higher than that in the base. In contrast, the configuration of atoms in the H/MEA is different. Simply taking a ternary MEA as an example, Figure (b), three principal elements (labeled by solid spheres, respectively, in yellow, pink, and turquoise), all are random and disordered in a base solution of single phase. Lots of CSROs dispersedly distribute (marked by blue and red frames). As a result, CSRO shows two features by comparison to a precipitate. Firstly, atoms in CSRO still occupy the lattice sites of disordered base, but with at least one element forming the short-range order. Second, CSRO is of the short ordered period, usually less than 1 nm.
Figure 1. Schematic distribution of atoms. (a) Conventional alloy internally with solute atoms (yellow atoms) and precipitates (orange area). (b) Ternary medium-entropy alloy with CSROs labeled by blue and red frame.
In the following, the electron diffraction patterns under several zone axes (z.a.) are demonstrated to find out the z.a. as many as possible with reflections specific to CSRO. Figure (a) is the selected-area electron diffraction (SAED) pattern under the z.a. The extra superlattice scattering appears in the form of diffuse disks, lining up at the
positions of fcc lattice as indicated by two yellow arrows and one is marked by pink circle. These diffuse disks in reciprocal space are the conclusive evidence for CSRO entities of small sizes in real space [Citation27,Citation28,Citation34]. These scattering is the corollary to the rule-of-shape-factor between real and reciprocal space, i.e. ‘small becomes large’ and vice versa [Citation16,Citation32,Citation33].
Figure 2. Electron diffraction of CSRO under [112] zone axis. (a) SAED pattern. Yellow arrows and dash circle in pink: extra diffuse scattering by CSROs at positions of fcc base. (b) Lattice image of fcc base under
z.a. (c) FFT pattern corresponding to (b). Pink and yellow circles: diffuse scattering by the CSRO and sharp diffraction spot by base fcc. (d-1 & d-2) Inverse FFT patterns of CSRO and fcc base, respectively, in the area circled in green in (b). (d-3) Merged inverse FFT pattern of (d-1) and (d-2). Dash hexagon: CSRO. b: lattice parameter of unit cell in the CSRO, which is measured to be 0.264 nm. (d-4) Two-dimensional model of the CSRO. Solid spheres in pink and yellow: V-enriched and (Co,Ni)-enriched atom column. Note that the pink column is not entirely V atoms, also with (Co,Ni) atoms to certain contents.
![Figure 2. Electron diffraction of CSRO under [112] zone axis. (a) SAED pattern. Yellow arrows and dash circle in pink: extra diffuse scattering by CSROs at 12{3¯11} positions of fcc base. (b) Lattice image of fcc base under[112] z.a. (c) FFT pattern corresponding to (b). Pink and yellow circles: diffuse scattering by the CSRO and sharp diffraction spot by base fcc. (d-1 & d-2) Inverse FFT patterns of CSRO and fcc base, respectively, in the area circled in green in (b). (d-3) Merged inverse FFT pattern of (d-1) and (d-2). Dash hexagon: CSRO. b: lattice parameter of unit cell in the CSRO, which is measured to be 0.264 nm. (d-4) Two-dimensional model of the CSRO. Solid spheres in pink and yellow: V-enriched and (Co,Ni)-enriched atom column. Note that the pink column is not entirely V atoms, also with (Co,Ni) atoms to certain contents.](/cms/asset/e17bdce6-29ed-4670-a227-dd556181e580/tmrl_a_2029607_f0002_oc.jpg)
The HRTEM image of fcc base is obtained with no sign of CSRO, Figure (b). Next, a simple approach is proposed to find out where CSRO is. The first step is to obtain the fast Fourier transform (FFT) pattern, Figure (c), showing diffuse scattering by CSRO (one is circled in pink) and sharp reflections of fcc base (yellow circle). The second is to obtain the inverse FFT (IFFT) images for CSRO (white spots, Figure (d-1)) and fcc base (green spots, Figure (d-2)) by using their respective reflection. These two IFFT images come from the small area (green circle) in Figure (b). The final step to take is to merge above two IFFT images, Figure (d-3), where one CSRO (pink hexagon by white spots) is clearly visible on the fcc lattice, with spacing (λ) of (113) plane in CSRO twice that in fcc base. Based on the measurements by the atomic-resolution EDS mapping [Citation27], CSRO consists of a (Co,Ni)-enriched plane sandwiched by two V-enriched planes, as illustrated in Figure (d-3). Resultantly, the two-dimensional CSRO model is established in the [112] direction, Figure (d-4). V atoms (spheres in pink) occupy the vertices of unit cell, while both Co and Ni atoms (in yellow) locate in-between [Citation27].
The extra superlattice scattering by CSRO is further observed under the [111] z.a., Figure (a). These diffuse reflections are at the positions of and
of fcc base, one for each is circled in pink. The diffraction patterns are indexed by pink and turquoise lines, respectively, for CSRO and fcc base. Two (110) planes in CSRO and fcc base form an angle of 30°, i.e.
and
. The distance (
) from the center of fcc base (dash line in turquoise) to
spot is
3 times of that (dash line in pink) for CSRO. In other words,
, see the graphic details as shown in Figure (b,c). Accordingly, the 2D model of CSRO is established when viewing along the [111] z.a., Figure (b). Thereinto, the hexagon (dash line in pink) is the periodic, minimum unit cell of CSRO, in contrast to that (turquoise line) in fcc base, Figure (c). Further, the simulated diffraction pattern is obtained, Figure (d), where the
reflections (labeled by Xs in pink) are forbidden for CSRO. This is in contrast to the scattering by CSRO at the positions of
fcc base, even faint but clearly visible, Figure (a). The reason is that the model in Figure (d) is derived under the assumption of the long-range, disordered arrangement of atoms in a precipitate. However, CSRO is chemically ordered, even short-ranged. As such, scattering by CSRO does not satisfy the strict extinction law and makes the diffraction deviate from the theoretical extinction distance.
Figure 3. Electron diffraction pattern of CSRO under [111] zone axis. (a) Diffraction pattern. Note two positions for superlattice scattering at both and
of fcc base; one for each is circled in pink. (b) and (c) 2D model for CSRO and fcc base. Spacing (
) of (110) planes are marked. (d) Simulated diffraction pattern. Pink circle: scattering by CSRO. Pink cross: extinction of CSRO.
![Figure 3. Electron diffraction pattern of CSRO under [111] zone axis. (a) Diffraction pattern. Note two positions for superlattice scattering at both 1/3{4¯22} and 2/3{4¯22} of fcc base; one for each is circled in pink. (b) and (c) 2D model for CSRO and fcc base. Spacing (λ) of (110) planes are marked. (d) Simulated diffraction pattern. Pink circle: scattering by CSRO. Pink cross: extinction of CSRO.](/cms/asset/f2049007-7ead-459c-8a0c-43d62dd1628f/tmrl_a_2029607_f0003_oc.jpg)
Finally, the z.a. is checked. At least seemingly, this is the most suitable z.a. to identify CSRO [Citation24], but unfortunately, no convincing scattering by CSRO is available so far. The same is true in the present VCoNi MEA, Figure (a). Here, another method is demonstrated to find out CSRO based on the atomic-scale geometric phase analysis (GPA). The first step is to obtain the HRTEM lattice image under the
z.a., Figure (b). The second is to obtain the GPA strain map, Figure (c), with the locally periodic distribution of strain contrasts. This local strain is derived based on the displacement field [Citation37]. This method provides strain distribution induced by CSRO. In a simplified way, here, just considering the difference of atomic radii in V (radius of 1.35 Å), Co (1.26 Å), and Ni (1.24 Å), the column of larger V atoms will cause positive strains, as schematically shown in Figure (d), provided that these columns belong to CSRO which projects to the (111) plane. In the vicinity, negative strain is caused by the columns of smaller Co/Ni atoms in CSRO. Note that the spacing of
planes in CSRO is twice that in fcc base, Figure (d). It is therefore supposed that extra scattering by CSRO should be at the positions of
, see dash circles in pink, Figure (e-1), i.e. the FFT pattern from Figure (b). Indeed, scattering by CSRO (two pink circles) is visible, even much weak in intensity. The last is to obtain the IFFT images for both CSRO and fcc base, Figure (e-2 and e-3), corresponding to the area (dash parallelogram in turquoise) in Figure (b). Indeed, there exists a CSRO, Figure (e-2). By merging these two IFFT images, this CSRO is clearly seen to lay on the fcc base, Figure (e-4). Based on it, the 2-D model is established with the [110] z.a., Figure (e-5). Three parameters, a, c and β, are obtained in Figure (e-4), both as lattice parameters of unit cell.
Figure 4. Electron diffraction of CSRO with zone axis. (a) Nano-beam diffraction pattern. (b) Lattice image with [110] z.a. (c) GPA strain map imaged by
reflection. Scale bar: tensile (positive) and compressive (negative) strain. (d) Close-up view of GPA map in the purple square in (c). (e-1) FFT pattern of fcc base in (b). (e-2) and (e-3) Inverse FFT images for CSRO and fcc. (e-4) Merged inverse FFT image, showing the CSROs on fcc base. a, c and β: unit cell parameters. (e-5) 2D unit cell model. Solid spheres in pink and yellow: atom column of V- and (Co,Ni)-enriched.
![Figure 4. Electron diffraction of CSRO with [110] zone axis. (a) Nano-beam diffraction pattern. (b) Lattice image with [110] z.a. (c) GPA strain map imaged by (1¯11) reflection. Scale bar: tensile (positive) and compressive (negative) strain. (d) Close-up view of GPA map in the purple square in (c). (e-1) FFT pattern of fcc base in (b). (e-2) and (e-3) Inverse FFT images for CSRO and fcc. (e-4) Merged inverse FFT image, showing the CSROs on fcc base. a, c and β: unit cell parameters. (e-5) 2D unit cell model. Solid spheres in pink and yellow: atom column of V- and (Co,Ni)-enriched.](/cms/asset/f4f36812-3212-4462-9eee-5e8e466bfc1f/tmrl_a_2029607_f0004_oc.jpg)
Three 2D models of CSRO are summarized, see Figure (a–c), according to diffraction patterns from three independent ,
, and
z.a. The principle, similar to the engineering drawing, was applied to build up the 3D model. To be specific, by analyzing three 2D models and respective TEM projection in a way similar to the three orthographic views of a component [Citation38], complete information is obtained of both lattice structure and order occupation of three elements. As a result, the structure motif of CSRO, i.e. 3D unit cell, is reconstructed, left panel in Figure (d). To well recognize CSRO from fcc base, V and (Co,Ni) atoms in CSRO are colored, respectively, in pink and yellow; while randomly distributed V, Co, and Ni atoms are turquoise in the fcc base. Based on it, the space group is determined to be P2 for CSRO, which is a monoclinic lattice structure, with
125.5˚, and lattice parameters of a = 0.541 nm, b = 0.264 nm, and c = 0.445 nm, which are obtained from the measured real space of atoms in HRTEM images, Figure (d) and (e). The stoichiometry is V2CoXNi(2-x) according to the 3D unit cell. Meanwhile, the symmetry is much lower than that in fcc base (Fm-3 m). After the atomic occupation in CSRO is re-arranged as a result of the chemical order, interestingly, this CSRO unit cell is much similarly to that of
[Citation39], with a = 0.747 nm and γ = 89.9˚.
Figure 5. 3D unit cell of the CSRO. (a–c) 2D models with the ,
, and
zone axes, respectively. Pink and yellow spheres: V and (Co,Ni)-enriched atom positions; turquoise spheres: randomized (V,Co&Ni) atom positions. (d) 3D unit cell of the CSRO with a monoclinic lattice (Left panel). Middle panel: 3D unit cell which is embedded in fcc base. Note the [112] direction which is parallel to the major axis of the CSRO. Right panel: three typical crystallographic orientations in fcc lattice.
![Figure 5. 3D unit cell of the CSRO. (a–c) 2D models with the [112], [1¯10], and [111] zone axes, respectively. Pink and yellow spheres: V and (Co,Ni)-enriched atom positions; turquoise spheres: randomized (V,Co&Ni) atom positions. (d) 3D unit cell of the CSRO with a monoclinic lattice (Left panel). Middle panel: 3D unit cell which is embedded in fcc base. Note the [112] direction which is parallel to the major axis of the CSRO. Right panel: three typical crystallographic orientations in fcc lattice.](/cms/asset/7a0b3777-aca5-4784-955f-1842c1100065/tmrl_a_2029607_f0005_oc.jpg)
Based on the determined structure motif of CSRO, the 3D spacial shape of CSRO is a flat cuboid, outlined in pink, left panel in Figure (d). It follows that to see CSRO depends on not only this 3D spacial shape of CSRO but also the orientation relationship of CSRO with fcc base. First, more CSROs will be seen if viewed from the [112] z.a. which is parallel to the major axis of CSRO. However, this does not necessarily mean that it is true under all <112 > z.a. For example, both [121] and [211] z.a. form an angle of 33.6° with the major axis of CSRO. This leads to a decrease in the proportion of CSRO inside the spacial column for diffraction imaging in TEM thin film. The diffraction intensity by CSRO will become much weak such that it is hard to distinguish them from the noised background [Citation24,Citation27]. Second, the z.a. is parallel to the minor axis of CSRO, right panel in Figure (d). Accordingly, the diffraction intensity by CSRO is much weak by comparison with that under the [112] z.a. This is the reason that it is so difficult to observe extra scattering along the
z.a. Generally, CSRO may be seen or not under all [110] z.a., depending on the orientation relationship between CSRO and zone axis. The same is true for the [111] z.a. Simply to say, whether or not diffuse diffraction by CSRO appear depends on the spacial shape of CSRO and the orientation relationship between CSRO and zone axis, along with the thickness of TEM thin film for CSRO characterization.
3. Conclusion
It is a nontrivial challenge to find out CSRO in the microstructure of H/MEA. With regard to electron diffraction for seeking out scattering signals by CSRO, a step forward in this letter is the [111] zone axis showing diffuse scattering specific to CSRO. More importantly, the structure motif of CSRO, i.e. 3D unit cell of species occupation, is constructed as the ordered -type intermetallic compound, based on the crystallographic orientation relationship between the CSRO and host fcc base by virtue of multiple electron diffractions.
Supplemental Material
Download MS Word (15.5 KB)Disclosure statement
No potential conflict of interest was reported by the author(s).
Additional information
Funding
References
- Tsai MH, Yeh JW. High-entropy alloys: a critical review. Mater Res Lett. 2014;2:107–123.
- George EP, Raabe D, Ritchie RO. High-entropy alloys. Nat Rev Mater. 2019;4:515–534.
- Li Z, Pradeep KG, Deng Y, et al. Metastable high-entropy dual-phase alloys overcome the strength-ductility trade-off. Nature. 2016;534:227–230.
- Yang T, Zhao YL, Tong Y, et al. Multicomponent intermetallic nanoparticles and superb mechanical behaviors of complex alloys. Science. 2018;362:933–937.
- Pan Q, Zhang L, Feng R, et al. Gradient cell–structured high-entropy alloy with exceptional strength and ductility. Science. 2021;374:984–989.
- Yang Y, Chen T, Tan L, et al. Bifunctional nanoprecipitates strengthen and ductilize a medium-entropy alloy. Nature. 2021;595:245–249.
- Ma E, Wu X. Tailoring heterogeneities in high-entropy alloys to promote strength–ductility synergy. Nat Commun. 2019;10:5623.
- Cowley JM. An approximate theory of order in alloys. Phys Rev. 1950;77:669–675.
- Ding Q, Zhang Y, Chen X, et al. Tuning element distribution, structure and properties by composition in high-entropy alloys. Nature. 2019;574:223–227.
- Li Q, Sheng H, Ma E. Strengthening in multi-principal element alloys with local-chemical-order roughened dislocation pathways. Nature Commun. 2019;10:3563.
- Wu Y, Zhang F, Yuan X, et al. Short-range ordering and its effects on mechanical properties of high-entropy alloys.J. Mater Sci Technol. 2021;62:214–220.
- Cohen JB, Fine ME. Some aspects of short-range order.J Phys Radium. 1962;23:749–762.
- Schönfeld B. Local atomic arrangements in binary alloys. Prog Mater Sci. 1999;44:435–543.
- Chevalier JPAA, Stobbs WM. An electron diffraction study of short-range order in quenched Ni4Mo alloy. Acta Metall. 1976;24:535–542.
- Hughes IR, Jones H. Coupled eutectic growth in Al-Fe alloys. J Mater Sci. 1976;11:1781–1793.
- Kuwano N, Chiwata N, Oki K. In situ TEM observation of long range ordering via short range order in Cu3Pt. Bull Mater Sci. 1999;22:697–700.
- Hata S, Mitate T, Kuwano S, et al. Short range order structures in fcc-based Ni-Mo studied by high resolution transmission electron microscopy with image processing. Mater Sci & Eng A. 2001;312:160–167.
- Kim YS, Maeng WY, Kim SS. Effect of short-range ordering on stress corrosion cracking susceptibility of alloy 600 studied by electron and neutron diffraction. Acta Mater. 2015;83:507–515.
- Seol JB, Kim JG, Na SH, et al. Deformation rate controls atomic-scale dynamic strain aging and phase transformation in high Mn TRIP steels. Acta Mater. 2017;131:187–196.
- Lei Z, Liu X, Wu Y, et al. Enhanced strength and ductility in a high-entropy alloy via ordered oxygen complexes. Nature. 2018;563:546–550.
- Seol JB, Bae JW, Kim JG, et al. Short-range order strengthening in boron-doped high-entropy alloys for cryogenic applications. Acta Mater. 2020;194:366–377.
- Moon J, Hong SI, Seol JB, et al. Strain-rate sensitivity of high-entropy alloys and its significance in deformation. Mater Res Lett. 2019;7:503–509.
- Oh HS, Kim SJ, Odbadrakh K, et al. Engineering atomic-level complexity in high-entropy and complex concentrated alloys. Nat Commun. 2019;10:2090.
- Zhang R, Zhao S, Ding J, et al. Short-range order and its impact on the CrCoNi medium-entropy alloy. Nature. 2020;581:283–287.
- Schön CG. On short-range order strengthening and its role in high-entropy alloys. Scr Mater. 2021;196:113754.
- Li L, Chen ZH, Kuroiwa S, et al. Tensile and compressive plastic deformation behavior of medium-entropy Cr-Co-Ni single crystals from cryogenic to elevated temperatures. Int J Plast. 2022;148:103144.
- Chen X, Wang Q, Cheng Z, et al. Direct observation of chemical short-range order in a medium-entropy alloy. Nature. 2021;592:712–716.
- Zhou L, Wang Q, Wang J, et al. Atomic-scale evidence of chemical short-range order in CrCoNi medium-entropy alloy. Acta Mater. 2022;224:117490.
- Liu D, Wang Q, Wang J, et al. Chemical short-range order in Fe50Mn30Co10Cr10 high-entropy alloy. Mater Today Nano. 2021;16:100139.
- Lan S, Zhu L, Wu Z, et al. A medium-range structure motif linking amorphous and crystalline states. Nat Mater. 2021. doi:https://doi.org/10.1038/s41563-021-01011-5.
- Maiti S, Steurer W. Structural-disorder and its effect on mechanical properties in single-phase TaNbHfZr high-entropy alloy. Acta Mater. 2016;106:87–97.
- Van Tendeloo G, Amelinckx S. The origin of diffuse intensity in electron diffraction patterns. Phase Trans. 1998;67:101–135.
- Van Tendeloo G, Amelinckx S. On a simple method to determine the origin of diffuse scattering in electron diffraction patterns. Scr Metall. 1986;20:335–339.
- Williams DB, Carter CB. Transmission electron micro-scopy, a textbook for materials science. New York: Springer ScienceþBusiness Media; 2009.
- Liu CT. Atomic ordering and structural transformation in the V-Co-Ni ternary alloys. Metall Trans. 1973;4:1743–1753.
- Sohn SS, Kwiatkowski da Silva A, Ikeda Y, et al. Ultrastrong medium-entropy single-phase alloys designed via severe lattice distortion. Adv Mater. 2019;31:e1807142.
- Hytch MJ, Snoeck E, Kilaas R. Quantitative measurement of displacement and strain fields from HREM micrographs. Ultramicroscopy. 1998;74:131–146.
- Xiao LR, Cao Y, Li S, et al. The formation mechanism of a novel interfacial phase with high thermal stability in a Mg-Gd-Y-Ag-Zr alloy. Acta Mater. 2019;162:214–225.
- Deng L, Zhang XM, Wang L, et al. Local identification of chemical ordering: extension, implementation, and application of the common neighbor analysis for binary systems. Computational Mater Sci. 2018;143:195–205.