
Abstract
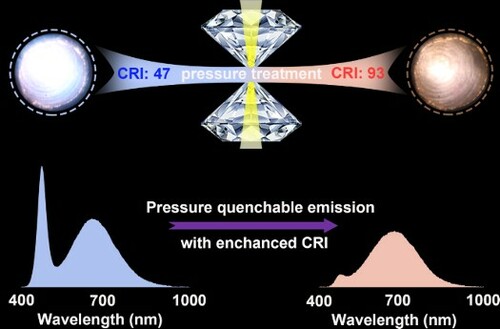
Warm WLED with high color rendering index (CRI) are greatly required for the widespread use of solid-state lighting especially indoors. Here, a remarkable improvement of CRI in alloyed CdS0.7Se0.3 QDs was achieved by pressure engineering. Notably, white light with enhanced CRI of 93, higher than pristine CRI of 47, was retained upon the complete release of pressure, accompanied by a color change from ‘natural’ (4298 K) to ‘warm’ white light (2170 K). Synchrotron ADXRD shows that CdS0.7Se0.3 QDs experienced an irreversible phase transition from the zinc blende phase to rocksalt structure.
GRAPHICAL ABSTRACT
IMPACT STATEMENT
Warm white light with enhanced color rendering index of 93 is achieved by pressure processing, accompanied by a color change from ‘natural’ (4298 K) to ‘warm’ white light (2170 K).
1. Introduction
Semiconductor quantum dots (QDs) have emerged as a new technology platform with the potential to replace commercially used lamps [Citation1–4]. Alloyed bichalcogenide CdSSe QDs showed promising potential in various light-emitting devices, such as white-light-emitting diodes (WLEDs) and photodetectors [Citation5]. Reabsorption-associated losses and color rendering index (CRI) are two key photometric parameters to assess the performance of lighting devices. Considerable efforts, including boosting trap-assisted emission via partial ligand exchange or adopting the gradient composition, have been made to control CRI values in CdSSe QDs [Citation6,Citation7]. Despite significant progress, the success in increasing the white-light quality has been limited and complex synthesis procedures are unfavorable for industrial production [Citation8]. Increasing the CRI value for defect-induced trap-rich white-light nanocrystals still remains a crucial challenge.
High pressure is a powerful stimulus to regulate the physical and chemical properties of various functional materials, which broadens our fundamental understanding of structure–property relationships [Citation9–12]. Moreover, metastable phases with novel properties upon compression could be retained under ambient conditions [Citation13–16]. In addition, pressure can induce emission enhancement in compressed CdSe QDs as a result of the strengthened interactions between the capping organic acid molecule and the CdSe QDs at high pressure [Citation17]. Motivated by these works, we have extended high-pressure effect to the alloyed bichalcogenide CdSSe QDs to investigate the structure–property behavior of CdSSe QDs and enhance their white-light properties.
In this regard, we systematically investigated the pressure-dependent optical properties of alloyed bichalcogenide CdS0.7Se0.3 QDs. Upon compression, the evolutionary behavior of band-edge emission and trap-assisted emission results in a persistently increscent CRI value up to 89 at 5.97 GPa. More importantly, the warm-white emission corresponding to the CIE coordinates (0.5041, 0.4085) with higher CRI of 93 is retained under ambient conditions upon the complete release of pressure, accompanied by a color change from ‘natural’ to ‘warm’ white light with 2170 K. The irreversible tuning of optical properties in CdS0.7Se0.3 QDs was highly associated with the retention of high-pressure rocksalt phase after pressure release. The high-resolution TEM images revealed the distinct variation in morphology due to the pressure-induced ripening in CdS0.7Se0.3 QDs, which is possibly responsible for the irreversible phase transition. Our study deepens insights into comprehending the structure–property relationship and guiding future material design for promising applications through phase engineering.
2. Results and discussion
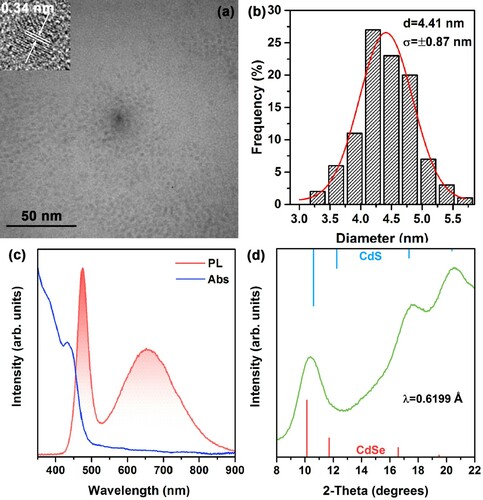
As shown in Figure (a and b), the synthesized samples exhibit a spherical shape with an average diameter of 4.41 nm. The zinc-blende (ZB) phase structure of alloyed CdS0.7Se0.3 QDs can be evidenced by the well-resolved lattice fringes with an interplanar spacing of 0.34 nm, which lies between the (111) lattice spacing of cubic CdS (0.336 nm) and that of cubic CdSe (0.352 nm) [Citation18]. Figure (c) presents the absorption and PL of CdS0.7Se0.3 QDs with a strong narrow emission (NE), at 475 nm and a broad emission (BE) at ∼ 658 nm. The NE, which is only a few nanometer Stokes-shift, is clearly a result of excitonic recombination at the band edge. The large Stokes-shifted BE can be attributed to the surface-related midgap states. The emission of CdS0.7Se0.3 QDs under ambient conditions is determined as (0.3519, 0.2926), which provides a correlated color temperature (CCT) of 4298 K. The XRD spectra confirm that the CdS0.7Se0.3 QDs occupy the ZB structure (Figure d). The reflections of CdS0.7Se0.3 QDs slightly shift toward the lower angles with respect to the reflections of CdS, indicating the existence of lattice expansion owing to the larger Se2− ionic radius compared with that of S2−. In addition, the emission properties can be modulated via S:Se ratios due to the existence of two different surface chalcogenide atoms within CdSSe QDs (Figure S1).
Figure 1. (a) TEM and HRTEM images of CdS0.7Se0.3 QDs. (b) Corresponding size distribution. (c) Absorption and PL spectra. (d) XRD pattern of CdS0.7Se0.3 QDs. The vertical red and blue lines show the reflections corresponding to CdSe and CdS.
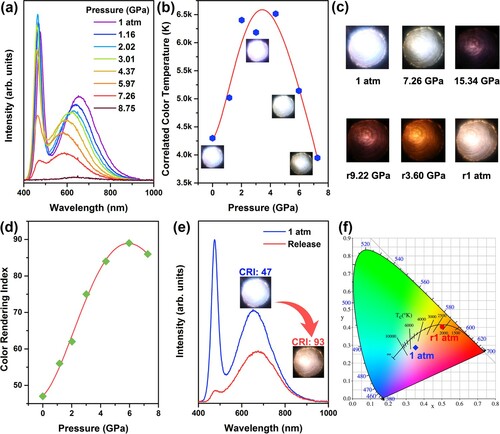
When the pressure increased to 2.02 GPa, the NE of CdS0.7Se0.3 QDs exhibited a blue shift, accompanied by a slight pressure-induced emission enhancement, while the BE underwent a persistent dropping in its intensity and a similar blue shift to that of NE. Upon further compression, the NE and BE intensities decreased and were finally quenched at 8.75 GPa. The CCT gradually increased up to 6516 K at 4.37 GPa, followed by a persistent decrease up to 3947 K. The corresponding optical micrographs of the emission clearly displayed the variation in the PL brightness of CdS0.7Se0.3 QDs upon compression, accompanied by the color change from neutral to warm white light (Figure c). Meanwhile, the obvious improvement of CRI was able to be achieved, and the CRI reached to a maximum of 89 at 5.97 GPa, which is almost twice than the initial counterpart (Figure d). Impressively, considerably different emission profile and intensity appeared upon decompression with the emergence of warm-white light (Figure e). The CRI was promoted from the initial 47 to the maximum value of 93 after pressure processing. The corresponding quantum yields of quenched CdS0.7Se0.3 QDs was estimated to be about 12.02%. On the basis of the CIE chromaticity diagram, as shown in Figure (f), the initial emission with CIE chromaticity coordinate of (0.3519, 0.2926) and CCT of 4298 K can be tuned by pressure, converting to 2170 K with CIE chromaticity coordinate of (0.5041, 0.4085). Moreover, the quenched CRI was able to remain the value of above 90 after aging time up to one week at ambient conditions (Figure S2). We further collected the PL spectra of CdS0.7Se0.3 QDs upon decompression from different pressures. The CRI values of quenched emission were 49, 92 and 93 from 5.07 GPa, 10.02 and 15.03 GPa, respectively (Table S2). When the applied pressure exceeded 10 GPa, the quenched NE intensity weakened apparently, whereas the quenched BE intensity was almost unchanged (Figure S3). CRI and CCT are important parameters for white emissive materials, and the reflect the ability of a light source to accurately render the colors of an object compared with daylight. Therefore, high-pressure technology as a simple and clean method achieves high-quality white-light emission. Looking forward, we can use the large volume press to achieve large-scale preparation of white emissive CdSSe QDs with high CRI for practical application [Citation19].
Figure 2. (a) Evolution of the PL spectra under pressures from 1 atm to 8.75 GPa. (b) Pressure-dependent correlated color temperatures of CdS0.7Se0.3 QDs. (c) Evolution of the microphotographs under selected pressures. (d) CRI changes as a function of pressure. (e) PL spectra of CdS0.7Se0.3 QDs at 1 atm and after pressure release from 15 GPa. (f) Chromaticity coordinate diagram for 1 atm and decompression.
The PL spectra selected were split into two sub-bands attributed to NE and BE to assess the high-pressure PL property more accurately (Figure a). Based on the deconvolution of the PL spectra using Gaussian functions, we deduced the high-pressure evolution of the FWHM, intensity, and position of each PL peaks. The FWHM of NE displayed a slight narrowing before 4.37 GPa and a slow broadening with further increase in pressure (Figure b). By contrast, the FWHM of the BE first increased when the pressure increased from ambient to 4.37 GPa (Figure b). Subsequently, the FWHM declined with pressure increasing from 4.37–7.27 GPa. The sudden decrease in the FWHM of BE could be attributed to the pressure-induced ripening of CdS0.7Se0.3 QDs, which reduces the number of trapped states from the surface of QDs. We also divided the BE intensity as a function of pressure into two regimes associated with dramatic change in slope (Figure c). The coefficient α of −35.26 GPa−1 from the linear function E(P) E0 + αP at the low-pressure regime was smaller than that of −82.74 GPa−1 at high-pressure regime. This finding could be attributed to the faster reduction in the number of trapped states. As depicted in Figure (d), the position of NE showed an initial blue shift upon compression to about 4.37 GPa. When higher pressure was applied, it exhibited a redshift to 7.26 GPa, at which point the PL intensity completely disappeared. With the increase in pressure to 5.97 GPa, the BE peak showed continuously blue-shift. The BE started to display a red-shift tendency.
Figure 3. (a) Fitted PL spectra at 1 atm and 4.37 GPa. (b) Pressure-dependent FWHM of NE and BE. (c) Intensity of BE as a function of pressure. (d) Pressure-dependent position variations of BE and NE. (e) Absorption spectra as a function of the pressure. (f) Pressure dependence of band gap.
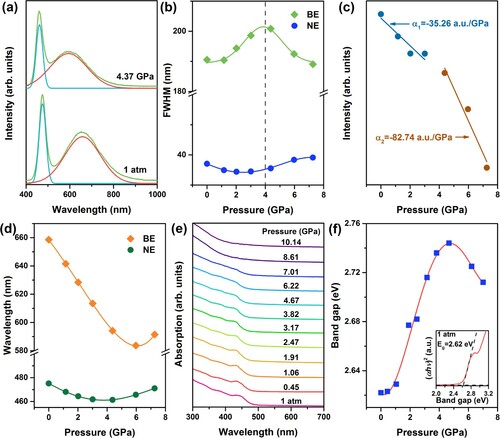
The pressure-dependent absorption spectra of CdS0.7Se0.3 QDs were recorded, as shown in Figure (e). Under ambient conditions, CdS0.7Se0.3 QDs exhibited an obvious exciton absorption peak around 433 nm. At relatively low pressure, the exciton absorption peak initially displayed a gradual blueshift in wavelength due to the compression of the unit cell. At around 4.67 GPa, the original exciton absorption peak suddenly presented a slight redshift, consistent with the NE behavior upon compression, indicating the intrinsic band-edge transition feature. In addition, the defect states depended on the host media, their transition energy should be not directly related to the change of host’s band gap. Beyond 7.01 GPa, the vanishing of the exciton absorption peak indicated that the CdS0.7Se0.3 QDs possibly underwent a structural phase transition. After completely releasing pressure to ambient conditions, the exciton absorption peak become seriously weakened compared with the original state, explaining the reduction in the NE intensity for the quenched samples (Figure S4). Detailed evolution of the band-gap energy for CdS0.7Se0.3 QDs under high pressure was displayed in Figure (f). The variation in band gap energy (Eg) for the CdS0.7Se0.3 QDs was estimated by a Tauc plot, fitting the linear portion of (αhν)2 versus hν, where α and hν are the absorption coefficient and photon energy, respectively. In addition, similar absorption behavior upon compression for CdSxSe1-x QDs (x = 0.5 and 0.3) indicates that the inflexion had nothing to do with the changes of S/Se ratios (Figure S5).
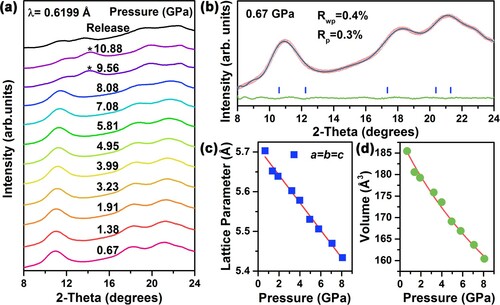
To evaluate the structure–property relationship, in situ high-pressure angle-dispersive X-ray diffraction (ADXRD) experiments were performed (Figure a). With increasing pressure, all diffraction peaks shifted toward high angles without any new peaks occurring below 8.08 GPa. The rietveld refinement confirmed that the initial structure was the ZB phase with the space group of F43 m (Figure b). As the CdS0.7Se0.3 QDs was subjected to pressure beyond 8.08 GPa, the appearance of a new diffraction peak at about 14° (marked by asterisk) suggested that the CdS0.7Se0.3 QDs underwent a structural phase transition to the RS structure. The phase transition from a direct band gap ZB structure to an indirect band gap RS structure explained why the BE and NE were basically quenched above 7.01 GPa. Note that when completely releasing the pressure, some diffraction peaks of high-pressure RS phase can be maintained (Figure a). The refinements of quenched ADXRD pattern indicated that the proportions of ZB and RS are 46.5% and 53.5%, respectively (Figure S6). This partially irreversible phase transition eventually resulted in the irreversible change in the PL and absorption spectra. Figure (c and d) depicts that lattice constants decreased linearly without sudden change before 8.08 GPa.
Figure 4. (a) ADXRD patterns of CdS0.7Se0.3 QDs at pressures. (b) Refinements of ADXRD pattern with the experiment (red fork), simulation (gray profile), and difference (green line). Therein, blue vertical markers indicate the corresponding Bragg reflection. (c, d) Pressure dependence of lattice parameter and volume.
First-principles calculations demonstrated that the bonds of Cd-S and Cd-Se experienced a persistent decrease with a similar rate under high pressure (Figure S7). The simulated electronic structure with a direct band gap feature exhibited a linear increase without any turning point upon compression (Figure S8). The HRTEM images show that the morphology of CdS0.7Se0.3 QDs was no longer uniform and some of QDs were sintered together after decompression (Figure S9). The decompressed CdS0.7Se0.3 QDs exhibited larger particle size, consistent with the result of CdSe QDs [Citation20]. Therefore, the increase in size associated with pressure-induced ripening would result in stark discontinuity at ∼4 GPa in the PL and absorption spectra. Because the stability of high-pressure phase was affected by the morphology of nanoparticles [Citation21], the effective shape modification of alloyed CdS0.7Se0.3 QDs through pressure engineering could be responsible for the irreversible phase transition. Eventually, alloyed CdS0.7Se0.3 QDs with enhanced properties can be anticipated at room temperature and ambient pressure.
3. Conclusion
The CRI values of alloyed CdS0.7Se0.3 QDs were remarkably improved by pressure treatment at room temperature. Of particular importance is the retention of the white-light emission with high CRI of 93 upon the complete release of pressure, accompanied by a distinct color change from ‘natural’ (4298 K) to ‘warm’ white light with 2170 K. Synchrotron ADXRD patterns indicated that CdS0.7Se0.3 QDs experienced an irreversible phase transition from cubic ZB phase to the RS structure. This work provides a promising strategy for rational material design by pressure treatment to retain novel properties, thus greatly facilitating its potential in solid-state lighting.
Supplemental Material
Download Zip (6.5 MB)Disclosure statement
No potential conflict of interest was reported by the author(s).
Additional information
Funding
Related Research Data
References
- Dai XL, Zhang ZX, Jin YZ, et al. Solution-processed, high-performance light-emitting diodes based on quantum dots. Nature. 2014;515:96–99.
- Xuan Z, Li J, Liu Q, et al. Artificial structural colors and applications. The Innovation. 2021;2:100081.
- Li H, Zhu YJ. Nanowires: Synthesis and energy/environmental applications. Energy Environ. Mater. 2020;3:544–561.
- Xie HX, Chen EG, Ye Y, et al. Highly stabilized Gradient Alloy Quantum Dots and silica Hybrid nanospheres by core Double shells for Photoluminescence devices. J. Phys. Chem. Lett. 2020;11:1428–1434.
- Jaiswal S, Pathak J, Kundu S, et al. One-Pot phosphine-free route for single-component white light emitting CdSexSy alloy nanocrystals. ACS Sustain. Chem. Eng. 2021;9:5613–5622.
- Saidzhonov BM, Zaytsev VB, Eliseev AA, et al. Highly luminescent gradient alloy CdSe1-xSx nanoplatelets with reduced reabsorption for white-light generation. ACS Photonics. 2020;7:3188–3198.
- Rosson TE, Claiborne SM, McBride JR, et al. Bright white light emission from ultrasmall Cadmium Selenide nanocrystals. J. Am. Chem. Soc. 2012;134:8006–8009.
- Sapra S, Mayilo S, Klar TA, et al. Bright white-light emission from semiconductor nanocrystals: by chance and by design. Adv. Mater. 2007;19:569–572.
- Ma Z, Li F, Zhao D, et al. Whether or Not emission of Cs4PbBr6 nanocrystals: high-pressure experimental evidence. CCS Chem. 2020;2:71–80.
- Wu HM, Wang ZW, Fan HY. Stress-Induced nanoparticle crystallization. J. Am. Chem. Soc. 2014;136:7634–7636.
- Zhu H, Nagaoka Y, Hills-Kimball K, et al. Pressure-Enabled Synthesis of hetero-dimers and hetero-rods through intraparticle coalescence and interparticle fusion of quantum-Dot-Au satellite nanocrystals. J. Am. Chem. Soc. 2017;139:8408–8411.
- Ma ZW, Li Q, Luo JJ, et al. Pressure-Driven reverse intersystem crossing: New Path toward Bright deep-blue emission of lead-free halide double perovskites. J. Am. Chem. Soc. 2021;143:15176–15184.
- Wang ZW, Wen XD, Hoffmann R, et al. Reconstructing a solid-solid phase transformation pathway in CdSe nanosheets with associated soft ligands. Proc Natl Acad Sci U S A. 2010;107:17119–17124.
- Zhao DL, Xiao GJ, Liu Z, et al. Harvesting cool daylight in Hybrid organic-inorganic halides microtubules through the reservation of Pressure-Induced emission. Adv. Mater. 2021;33:2100323.
- Fu RJ, Zhao WY, Wang LR, et al. Pressure-induced emission toward harvesting cold white light from warm white light. Angew. Chem. Int. Ed. 2021;60:10082–10088.
- Meng LY, Lane JMD, Baca L, et al. Shape dependence of pressure-induced phase transition in CdS semiconductor nanocrystals. J. Am. Chem. Soc. 2020;142:6505–6510.
- Xiao GJ, Wang YN, Han D, et al. Pressure-induced large emission enhancements of Cadmium Selenide nanocrystals. J. Am. Chem. Soc. 2018;140:13970–13975.
- Zhang HM, Wang FF, Kuang YM. Se/S ratio-dependent properties and application of gradient-alloyed CdSe1–xSx Quantum dots: shell-free structure, Non-blinking Photoluminescence with single-exponential decay, and efficient QLEDs. ACS Appl Mater Interfaces. 2019;11:6238–6247.
- Shang YC, Liu ZD, Dong JJ, et al. Ultrahard bulk amorphous carbon from collapsed fullerene. Nature. 2021;599:599–604.
- Lv PF, Yang SR, Liu C, et al. Pressure-induced emission enhancements and ripening of zinc blende Cadmium Selenide nanocrystals. J Phys Chem C. 2019;123:15339–15344.
- Wickham JN, Herhold AB, Alivisatos AP. Shape change as an indicator of mechanism in the high-pressure structural transformations of CdSe nanocrystals. Phys. Rev. Lett. 2000;84:923–926.