
 ?Mathematical formulae have been encoded as MathML and are displayed in this HTML version using MathJax in order to improve their display. Uncheck the box to turn MathJax off. This feature requires Javascript. Click on a formula to zoom.
Abstract
Outstanding electroactive properties of certain crystallographic phases of poly(vinylidene fluoride) (PVDF) bring much attention to its melting and crystallisation behaviour for tailoring crystallographic nature. In the past, the focus was put on operating conditions in terms of melting and crystallisation kinetics, whereas a deeper understanding of the molecular structure–property relationship of PVDF is sparsely addressed. This study is the first survey to investigate systematically the structure–property relationship by clarifying the question, how molecular weight distribution affects thermal–caloric properties and hence polymorphous phase behaviour. It is shown that molecular weight strongly influences electroactive phase formation and plays a key role in phase design.
GRAPHICAL ABSTRACT
IMPACT STATEMENT
This work provides new insights in molecular weight induced electroactive phase formation in poly(vinylidene fluoride)
Introduction
Poly(vinylidene fluoride) (PVDF) is an extensively studied polymer, due to its electroactive properties [Citation1–3]. However, among the five crystallographic phases of PVDF, namely α-, β-, γ-, δ- and ε- phase, their electroactivities are not evenly strong. The β- and γ-phases are the most electrically active [Citation4], while the α- and ε- phases are non-polar [Citation5–7]. Consequently, the promotion of the β- and γ-phases is of high interest for using electroactive features of PVDF for sensors, actuators, batteries, filters, and in the biomedical field [Citation8–10].
In principle, the β-phase can be obtained by mechanical stretching of the α-phase [Citation5] or from the melt under certain processing conditions, such as under high pressure [Citation11], external electric field [Citation12], ultra-fast cooling [Citation13–15], from solution crystallisation at low temperature [Citation10,Citation16,Citation17], or by adding nucleating fillers [Citation18–21], or by particle generation processes [Citation22,Citation23]. It is harder to obtain γ-phase compared with β-phase[Citation4]. On principle, γ-phase can be obtained through annealing at temperatures near melting temperature or with the addition of specific fillers [Citation24]. Recently, a sophisticated melt–recrystallisation process to obtain the γ-phase of PVDF is reported [Citation25], whereas the melt–recrystallisation process is conducted with various isothermal conditions for an isotropic PVDF melt. Quantitative information regarding thermal rate conditions and corresponding phases, investigated by different research groups, is provided in tabular form in the supplementary material of this work.
So far, the pursuit of gaining electroactive crystallographic phases, predominantly process conditions were focused on for tailoring purposes. The interrelation of specific molecular structure of pure PVDF with electroactive crystallographic phase generation through heating/cooling processes has up to authors’ knowledge not been focused on yet. Besides, it is known from other polymers that the molecular weight distribution and branching influence the melting and crystallisation behaviour strongly [Citation26–28]. Therefore, these characteristics are expected to play a significant role in the crystallographic phase behaviour of PVDF. Furthermore, it could be a key for the generation of electroactive PVDF phases through non-isothermal melting–crystallisation processes.
This work aims to reveal the impact of molecular weight on electroactive phase formation in PVDF, especially in the near-equilibrium region. Hence, two PVDF types are synthesised with different molecular weight distributions. The synthesised samples characterised by size-exclusion chromatography (SEC) show different molecular weights and non-uniformity. Non-isothermal melting and crystallisation experiments are conducted to investigate thermal and caloric properties, i.e. melting temperature and specific melting enthalpy, respectively. The dependence of these properties on the thermal rate in the near-equilibrium region is investigated by applying three different rates, 0.5, 5 and 10 °C/min. In addition, the phase-specific degrees of crystallinity and electroactive phase contents, which are formed under the influence of molecular weight distribution at the defined thermal rates, are studied.
Materials and methods
The polymers under investigation were synthesised via semi-batch emulsion polymerisation of vinylidene fluoride. Detailed information regarding synthesis is given in the supplementary material. The molecular weight distributions were obtained by SEC using N,N−dimethyl acetamide (DMAc, Acros, 99%) with LiBr (≥99%, Riedel-de-Häen) as eluent. The description of the polymerisation set-up and details on SEC analyses are provided elsewhere [Citation29].
The thermal and caloric measurements were conducted in a differential scanning calorimetry (DSC) instrument: Mettler Toledo DSC1. For each analysis, about 5–6 mg of the polymers were used. Each analysis of the samples was programmed to undergo a different cooling/heating rate of 0.5, 5 °C/min, or 10 °C/min. All the samples first went through a heating process up to a temperature, which is around 30°C above the melting temperature, this is referred to as step 1. Then, samples are cooled down at the same rate as the initial temperature, referred to as step 2. This is to ensure that the samples are fully melted, and thermal history is thus erased. Then, the fresh cooled sample was scanned with the same heating rate up to the same temperature compared with step 1 for studying its thermal property, i.e. melting temperature, and caloric property, i.e. specific melting enthalpy, during melting. This is referred to as step 3. Those different thermal rates in combination with the cooling and heating programme (step 1 to step 3) allow determining respective electroactive phases and the corresponding phase content based on DSC. This is further explained and discussed in the results section. To validate the results obtained by this method, phase specification and phase content information are also derived from Fourier-transform infra-red spectroscopy (FTIR). Samples obtained after step 2 are analysed by FTIR according to the procedure stated in [Citation17]. Additional information to FTIR analysis is also given in the supplementary material of this work. As FTIR apparatus, a Bruker Vertex 70 is applied.
Results and discussions
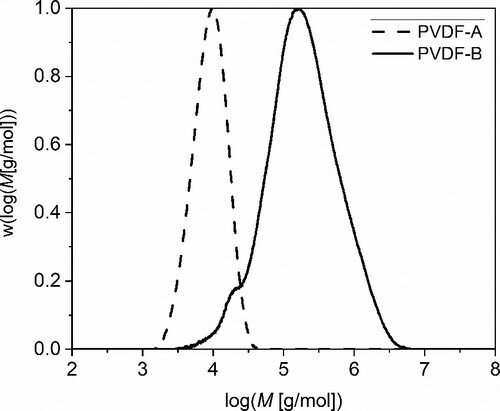
Figure shows the measured molecular weight distributions, normalised concerning peak height. Despite of the difference of the non-uniformity of the two PVDF samples, PVDF-A shows low molecular weight (Mn = 7600 g/mol, Mw = 10198 g/mol), compared with PVDF-B (Mn = 92700 g/mol, Mw = 344870 g/mol). Hence, PVDF-A is referred to low-molecular-weight and PVDF-B to high-molecular-weight samples, respectively.
Figure 1. Molecular weight distribution of PVDF-A (dashed line) and PVDF-B (full line).
Following the designed non-isothermal paths proposed in the materials and methods section, i.e. step 1 to step 2, historical recrystallisation and annealing phenomena, which might happen during synthesis are excluded. This is important to avoid additional challenges in the clarification of molecular weight-dependent electroactive phase formation in terms of cross-effects between different influence factors. The DSC results obtained during the thermal procedure in step 3 are presented in Figure . Results for different thermal rates for both PVDF, the low-molecular-weight PVDF-A and the high-molecular-weight PVDF-B, are presented in Figure (a). As it appears in Figure (a), a significant multi-peak behaviour with three peaks occurs for the low-molecular-weight PVDF only, under a thermal rate of 0.5 °C/min. For giving deeper insights into the phase-specific multi-peak behaviour of this sample and comparing it directly with the high-molecular-weight sample, a magnification is presented in Figure (b).
Figure 2. (a) Differential scanning calorimetry patterns of the samples for different thermal rates and molecular weights, (b) DSC pattern of the 0.5 °C/min cooled sample. Corresponding polymorphous phase assignments are inserted and referenced for PVDF-A and 0.5 °C/min as α0.5,A, β0.5,A, and γ0.5,A.
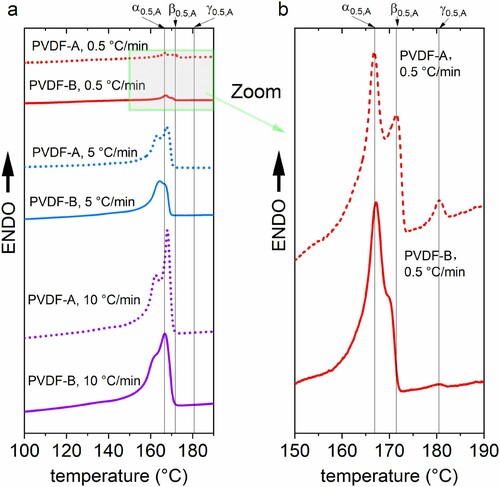
Figure further shows that the shape, position and location of endothermic peaks vary significantly, based on the joint influence of the molecular weight and thermal rates. The association of the respective peak in the multi-peak DSC pattern with the specific polymorphous phase of the PVDF is discussed and explained in the following section. The identification of γ-phase via DSC is straightforward because of the significantly different melting temperature of γ-phase [Citation4]. The melting temperature lies between 179°C and 180°C which is noticeably higher compared with the melting temperature of α- and β-phase, which is typically in the interval between 167°C and 172°C. DSC is an accepted method to determine γ-phase without further cross-validations [Citation4]. Therefore, the third peak at 182°C in Figure (b), obtained under a thermal rate of 0.5 °C/min heating for PVDF-A, corresponds to γ-phase and is further denoted herein as γ0.5,A. This electroactive phase only exists in the low-molecular-weight PVDF and could not be detected in the high-molecular-weight sample. Because this phase is observed only at a thermal rate of 0.5°C/min, it can be concluded that a condition close to equilibrium is needed for the formation of the γ-phase in combination with low-molecular-weight PVDF. It is found for the first time that molecular weight plays a key role in electroactive γ-phase formation.
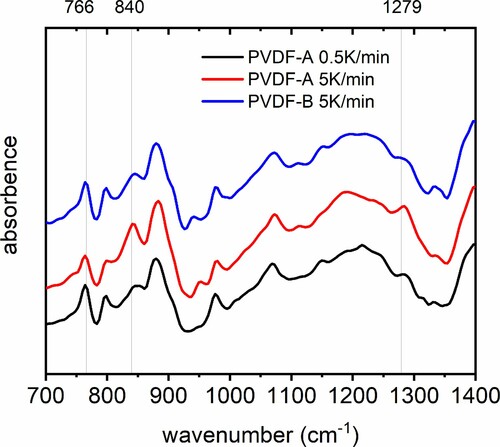
Besides the γ-phase peak, a double-peak structure in the DSC pattern is observed. The association of these peaks in the double-peak pattern with α- and β-phase is less straightforward with DSC only. On the one hand, α- and β-phase can hardly be distinguished from each other by DSC only by focusing on the melting temperature with a single heating rate, according to [Citation4]. On the other hand, this double-peak phenomena in the melting region of α- and β-phase have been observed and investigated by DSC in previous studies [Citation30–34] with some controversial discussions on its origin. Studies in the past [Citation30–34] have revealed, in principle, the source of the double-endothermic peaks in the α- and β-phase transition regime could be assigned primarily to three phenomena: (a) the existence of different crystallographic phases α and β (polymorphism), (b) the melting–recrystallisation phenomenon during the heating process and (c) the variation of the morphology [Citation31]. To distinguish these phenomena from each other, important information is given in Al-Raheil et al. [Citation30] and Marega et al. [Citation31], where a comparison of melting DSC curves of PVDF for different thermal rates are presented and associated with respective phenomena. In [Citation30,Citation31], it was shown that increasing heating rates lead to an increase of the low-temperature peak compared with the high-temperature peak in the double-peak pattern. This was directly associated with a melting–recrystallisation phenomenon instead of a polymorphous behaviour. This means that DSC melting curves obtained with different thermal rates provide information on the underlying mechanisms responsible for the double-peak behaviour according to the change of the peaks. Comparing the behaviour of the double peaks dependent on the thermal rates of PVDF-A and PVDF-B in this work, it turns out that the opposite behaviour is observed compared with [Citation30,Citation31]: With an increasing thermal rate, the peak at a lower temperature gets less pronounced. This means the underlying phenomenon corresponds to polymorphous phases. Therefore, the peak at higher temperature in the double-peak pattern is assigned to the β- phase. For further clarification the β-phase is denoted by β0.5,A for PVDF-A, and the peak at a lower temperature in the double-peak pattern is assigned to α-phase, referenced with α0.5,A and correspondingly for PVDF-B. To cross-validate this procedure, additional FTIR measurements are performed for selected examples. FTIR spectra for the samples, PVDF-A treated with 0.5 °C /min and 5°C /min and PVDF-B treated with 5°C /min thermal rate, are presented in Figure . Absorption peaks demonstrate the respective electroactive phases at wavenumbers around 840 and 1279 cm−1 [Citation4] and show the same behaviour determined by DSC patterns. Therefore, the DSC procedure applied to identify the peaks was validated qualitatively by FTIR and a quantitative validation will also be made afterward.
Figure 3. FTIR spectra for PVDF-A for a thermal rate of 0.5 and 5 °C/min and additionally for PVDF-B 5 °C/min.
The results show that the peak at higher temperature in the double peak of the DSC pattern is much weaker pronounced for PVDF-B compared to PVDF-A. Thus, less β-phase is present for higher molecular weight PVDF. Based on the experiments carried out in this study it is observed that a shorter chain length leads to higher β-phase content, indicating that the electroactive β-phase is strongly influenced by molecular weight too. The result for β-phase is similar to the phase inversion precipitation process, where also a shorter chain length promotes β-phase formation [Citation35]. In general, this finding supports that polymorphism with distinct electroactive phases can be controlled and regulated by molecular weight.
To gain further insights into thermal rate influence in molecular-weight-dependent electroactive phase formation, the polymorphous phase contents of PVDF-A and PVDF-B are investigated under different thermal rates, where thermal and caloric properties are recorded. Results of thermal rate-dependent specific melting enthalpies for low- and high-molecular-weight PVDFs in total are presented in Figure (a). The polymorphous phase-specific melting enthalpies for PVDF-A and PVDF-B are given in Figure (b).
Figure 4. Rate-dependent specific enthalpy of melting for PVDF-A and PVDF-B in total (a) and of crystallographic phase α and β (b) for different heating rates (values of specific melting enthalpies are given in tabular form in the supporting material). The degree of crystallinity (c) and the phase content (d) of electroactive phase of PVDF-A and PVDF-B obtained with different thermal rates.
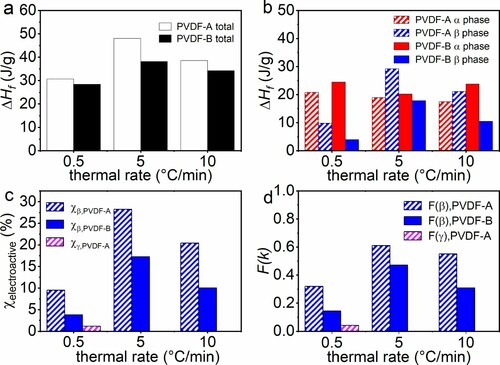
In Figure (b), for both PVDF-A and PVDF-B, specific melting enthalpies of α-phase stay almost constant while β-phase is strongly thermal rate-dependent between 0.5 and 10 °C/min. Moreover, this demonstrates a complex rate-dependent melting enthalpy of the β-phase, additionally influenced by molecular weight. With the information of the specific melting enthalpy, the degree of crystallinity of phase i can be calculated by applying the relation
[Citation4], where
is the melting enthalpy for phase i and
is the melting enthalpy for perfect crystalline PVDF of phase i. For α-phase, its value is 104.5 J/mol [Citation36], for β-phase 103.4 J/g [Citation36], and for γ-phase: 103.4 J/g [Citation37]. Results for the degree of crystallinity of the electroactive phases dependent on thermal rates are presented in Figure (c). It is shown that the highest degrees of β- phase crystallinities occur at 5 °C/min for both PVDF samples, where in the low-molecular-weight (PVDF-A) β-phase degree of crystallinity is around twice as high as in PVDF-B. For comparing the electroactive phase content
, where k can be β and γ, the relation
[Citation16,Citation38] is applied for PVDF-A and PVDF-B. The phase content of the electroactive phase of both PVDF samples dependent on the thermal rate is presented in Figure (d). This leads to the conclusion that the low-molecular-weight PVDF-A has a significantly higher electroactive phase content over the whole thermal rate interval compared with the high-molecular-weight PVDF-B. It is known that polymers having a shorter chain length can harder fold during crystallisation compared with long chain polymers [Citation39]. In turn, it is more likely that short-chain polymers have an unfolded configuration. In addition, it was reported that unfolded high-molecular-weight PVDFs, generated by stretching, leads to dipole alignment, which triggers β-phase formation [Citation40]. Transfer of this knowledge about the phenomena in high-molecular-weight PVDF and comparison with the findings of this work implies that PVDF-A is more likely to take an unfolded configuration, due to its short-chain character. Consequently, the unfolded configuration induces a higher fraction of the electroactive phase based on alignment, due to this stretched-like character.
To validate the DSC-based evaluation, the electroactive phase contents of PVDF-A and PVDF-B obtained at 5°C/min, where the highest electroactive phase content appeared in this investigation, are calculated based on FTIR spectra given in Figure . obtained by DSC and FTIR are compared in Table . The calculation of
from FTIR data is presented in the supplementary material. The β-phase contents obtained by DSC and FTIR data show a very good agreement (Table ), hence
obtained from DSC data is successfully validated.
Table 1. Calculated β-phase content from FTIR and from DSC with a thermal rate of 5 °C/min for PVDF-A and PVDF-B.
For the sake of completeness, the thermal rate influence of the thermal property, i.e. melting temperature for PVDF-A and PVDF-B, is presented in Figure . The influence of thermal rates on the peak temperature is different for both PVDFs: For PVDF-A in Figure (a), α-peak temperature drops significantly between a heating rate of 0.5 and 5°C/min. Figure (b) shows that for PVDF-B, a similar trend occurs; however, the peak shift between α- and β-phase is stronger.
Figure 5. Thermal rate-dependent melting peak temperature of PVDF-A 5(a) and PVDF-B (b) showing a thermal rate-dependent (green) and independent window (grey). Dashed and dotted lines reflect linear interpolations between measured points.
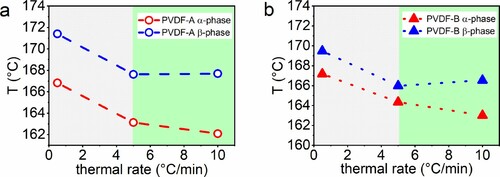
As shown in Figure , an anomaly of the melting temperature dependence on the thermal rate is obtained. For both polymers, the lowest melting temperature for β-phase is observed at a thermal rate of 5°C/min, whereas the other melting temperatures at 0.5°C/min and 10°C/min are higher. A similar finding is reported for polyethylene by Hellmuth and Wunderlich [Citation41]. Furthermore, it is known for linear PE that lower melting temperatures correlate with higher degree of crystallinities [Citation42]. This behaviour is now found for PVDF, too. Figures and in combination show that the lowest detected melting temperature is linked with the highest degree of crystallinity.
Conclusions
A first survey of the influence of the molecular weight on the non-isothermal cooling and heating has been performed for self-synthesised PVDF. Significantly, different molecular weight distributions of the 2 PVDF samples are characterised by SEC. In the heating path after erased morphological history, significantly different multi-endothermic peak phenomena occur for high- and low-molecular-weight samples in DSC patterns. It is revealed that γ-phase formation is induced by low-molecular-weight PVDF close to equilibrium conditions only. Therefore, molecular weight is identified as one key actor for the formation of electroactive γ-phase in PVDF. Furthermore, the double-peak phenomenon in the DSC patterns is discussed in detail. A procedure is described on how to identify the formation of the β-phase according to the DSC results at different thermal rates. The procedure is validated through FTIR measurements for selected examples. Furthermore, the low molecular weight also promotes the electroactive β-phase content. Moreover, the β-phase fraction is strongly influenced by the joint effect of molecular weight and thermal rate. These findings give first insights into the interrelation of the molecular weight as structural parameter, the thermal and caloric properties, and hence the polymorphous phase formation of PVDF, which is of particular interest for further understanding electroactive phase formation in PVDF.
Supplemental Material
Download MS Word (47.5 KB)Acknowledgements
We acknowledge Dr. Cathrin Härter for her valuable inputs.
Disclosure statement
No potential conflict of interest was reported by the author(s).
Additional information
Funding
References
- Kepler R, Anderson R. Piezoelectricity and pyroelectricity in polyvinylidene fluoride. J Appl Phys. 1978;49(8):4490–4494.
- Lovinger AJ. Poly(vinylidene fluoride). In: Bassett DC, editor. Developments in crystalline polymers—1. Dordrecht: Springer Netherlands; 1982. p. 195–273.
- Omote K, Ohigashi H, Koga K. Temperature dependence of elastic, dielectric, and piezoelectric properties of “single crystalline’’films of vinylidene fluoride trifluoroethylene copolymer. J Appl Phys. 1997;81(6):2760–2769.
- Martins P, Lopes A, Lanceros-Mendez S. Electroactive phases of poly (vinylidene fluoride): determination, processing and applications. Prog Polym Sci. 2014;39(4):683–706.
- Salimi A, Yousefi AA. Analysis method: FTIR studies of β-phase crystal formation in stretched PVDF films. Polym Test. 2003;22(6):699–704.
- Mohajir B-E E, Heymans N. Changes in structural and mechanical behaviour of PVDF with processing and thermomechanical treatments. 1. Change in Structure. Polymer. 2001;42(13):5661–5667.
- Martins P, Costa CM, Benelmekki M, et al. On the origin of the electroactive poly(vinylidene fluoride) β-phase nucleation by ferrite nanoparticles via surface electrostatic interactions. CrystEngComm. 2012;14(8):2807–2811.
- Martins P, Nunes JS, Hungerford G, et al. Local variation of the dielectric properties of poly(vinylidene fluoride) during the α- to β-phase transformation. Phys Lett A. 2009;373(2):177–180.
- Martins P, Caparros C, Gonçalves R, et al. Role of nanoparticle surface charge on the nucleation of the electroactive β-poly(vinylidene fluoride) nanocomposites for sensor and actuator applications. J Phys Chem C. 2012;116(29):15790–15794.
- Sencadas V, Gregorio Filho R, Lanceros-Mendez S. Processing and characterization of a novel nonporous poly(vinilidene fluoride) films in the β phase. J Non-Cryst Solids. 2006;352(21):2226–2229.
- Hattori T, Kanaoka M, Ohigashi H. Improved piezoelectricity in thick lamellar β-form crystals of poly (vinylidene fluoride) crystallized under high pressure. J Appl Phys. 1996;79(4):2016–2022.
- Zhong G, Zhang L, Su R, et al. Understanding polymorphism formation in electrospun fibers of immiscible poly (vinylidene fluoride) blends. Polymer. 2011;52(10):2228–2237.
- Gradys A, Sajkiewicz P, Adamovsky S, et al. Crystallization of poly(vinylidene fluoride) during ultra-fast cooling. Thermochim Acta. 2007;461(1):153–157.
- Pérez E, Angulo I, Blázquez-Blázquez E, et al. Characteristics of the non-isothermal and isothermal crystallization for the β polymorph in PVDF by fast scanning calorimetry. Polymers (Basel). 2020;12(11):2708.
- Yang D, Chen Y. β-phase formation of poly (vinylidene fluoride) from the melt induced by quenching. J Mater Sci Lett. 1987;6(5):599–603.
- Gregorio Jr R, Cestari M. Effect of crystallization temperature on the crystalline phase content and morphology of poly (vinylidene fluoride). J Polym Sci, Part B: Polym Phys. 1994;32(5):859–870.
- Lederle F, Härter C, Beuermann S. Inducing β phase crystallinity of PVDF homopolymer, blends and block copolymers by anti-solvent crystallization. J Fluor Chem. 2020;234:109522.
- Shi Z, Ma J, Nan C-W. A new magnetoelectric resonance mode in bilayer structure composite of PZT layer and terfenol-D/epoxy layer. J Electroceramic. 2008;21(1):390–393.
- Martins P, Moya X, Phillips L, et al. Linear anhysteretic direct magnetoelectric effect in Ni0. 5Zn0. 5Fe2O4/poly (vinylidene fluoride-trifluoroethylene) 0-3 nanocomposites. J Phys D: Appl Phys. 2011;44(48):482001.
- Mandal D, Kim KJ, Lee JS. Simple synthesis of palladium nanoparticles, β-phase formation, and the control of chain and dipole orientations in palladium-doped poly(vinylidene fluoride) thin films. Langmuir. 2012;28(28):10310–10317.
- Vukićević R, Vukovic I, Stoyanov H, et al. Poly (vinylidene fluoride)-functionalized single-walled carbon nanotubes for the preparation of composites with improved conductivity. Polym Chem. 2012;3(8):2261–2265.
- Wolff S, Jirasek F, Beuermann S, et al. Crystal phase transformation of α into β phase poly (vinylidene fluoride) via particle formation caused by rapid expansion of supercritical solutions. RSC Adv. 2015;5(82):66644–66649.
- Wiegmann J, Beuermann S, Weber AP. Influence of spray drying parameters on the formation of β-phase poly (vinylidene fluoride). Chem Ing Tech. 2021;93(8):1300–1306.
- Lopes AC, Costa CM, Tavares CJ, et al. Nucleation of the electroactive γ phase and enhancement of the optical transparency in Low filler content poly(vinylidene)/clay nanocomposites. J Phys Chem C. 2011;115(37):18076–18082.
- Zheng Y, Zhang J, Sun X, et al. Crystal structure regulation of ferroelectric poly (vinylidene fluoride) via controlled melt–recrystallization. Ind Eng Chem Res. 2017;56(15):4580–4587.
- Fischlschweiger M, Enders S. Solid–liquid equilibria of crystalline and semi-crystalline monodisperse polymers, taking into account the molecular architecture by application of the lattice cluster theory. Mol Phys. 2014;112(24):3109–3119.
- Fischlschweiger M, Enders S. A theory for solubility of semicrystalline and branched polymers in one solvent. Macromolecules. 2014;47(21):7625–7636.
- Fischlschweiger M, Enders S. Thermodynamic principles for the design of polymers for drug formulations. Annu Rev Chem Biomol Eng. 2019;10:311–335.
- Brandl F, Beuermann S. Halb-kontinuierliche emulsionspolymerisation von vinylidenfluorid. Chem Ing Tech. 2018;90(3):372–379.
- Al-Raheil IA, Qudah AM. Thermal behaviour and annealing of poly (vinylidene fluoride). Polym Int. 1996;41(3):323–326.
- Marega C, Marigo A. Influence of annealing and chain defects on the melting behaviour of poly (vinylidene fluoride). Eur Polym J. 2003;39(8):1713–1720.
- Sajkiewicz P. Crystallization behaviour of poly (vinylidene fluoride). Eur Polym J. 1999;35(9):1581–1590.
- Pan H, Na B, Lv R, et al. Polar phase formation in poly (vinylidene fluoride) induced by melt annealing. J Polym Sci, Part B: Polym Phys. 2012;50(20):1433–1437.
- Benz M, Euler WB. Determination of the crystalline phases of poly (vinylidene fluoride) under different preparation conditions using differential scanning calorimetry and infrared spectroscopy. J Appl Polym Sci. 2003;89(4):1093–1100.
- Haponska M, Trojanowska A, Nogalska A, et al. PVDF membrane morphology—influence of polymer molecular weight and preparation temperature. Polymers (Basel). 2017;9(12):718.
- Hashim NA, Liu Y, Li K. Stability of PVDF hollow fibre membranes in sodium hydroxide aqueous solution. Chem Eng Sci. 2011;66(8):1565–1575.
- Tan Z, Fu C, Gao Y, et al. Modifications of gamma poly (vinylidene fluoride)(γ-PVDF) films by high-energy electron beam irradiation. Radiat Phys Chem. 2018;153:258–268.
- Prest W Jr, Luca D. The formation of the γ phase from the α and β polymorphs of polyvinylidene fluoride. J Appl Phys. 1978;49(10):5042–5047.
- Hu W. The physics of polymer chain-folding. Phys Rep. 2018;747:1–50.
- Salimi A, Yousefi A. Analysis method: FTIR studies of β-phase crystal formation in stretched PVDF films. Polym Test. 2003;22(6):699–704.
- Hellmuth E, Wunderlich B. Superheating of linear high-polymer polyethylene crystals. J Appl Phys. 1965;36(10):3039–3044.
- Gopalan M, Mandelkern L. Effect of crystallization temperature and molecular weight on the melting temperature of linear polyethylene. J Phys Chem. 1967;71(12):3833–3841.