
 ?Mathematical formulae have been encoded as MathML and are displayed in this HTML version using MathJax in order to improve their display. Uncheck the box to turn MathJax off. This feature requires Javascript. Click on a formula to zoom.
Abstract
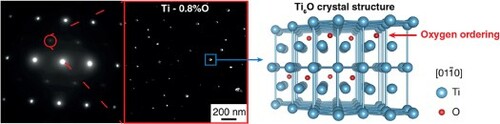
Small addition of oxygen is currently used to improve the mechanical properties of titanium. It has been thought, until now, that oxygen fully dissolves in the titanium matrix, thus leading to a solid solution. However, we show here, with transmission electronic microscopy and X-ray diffraction, that oxygen can also form ordered precipitates with a Ti6O-type structure, even for a concentration as low as 0.15 wt% O. The ordered precipitates found in a series of pure binary Ti–O alloys are also visible in commercially pure titanium, including grades 2 and 4, two compositions widely used for technological applications.
GRAPHICAL ABSTRACT
IMPACT STATEMENT
Oxygen-ordered precipitates are experimentally evidenced in a series of Ti–O alloys and in CP titanium. These findings question the paradigm defining oxygen only as a solute atom in titanium alloys.
Introduction
The hexagonal close-packed (hcp) structure of titanium (α phase) can incorporate up to 15 wt% oxygen [Citation1], with oxygen addition generally resulting in a large strength increase but also a drastic drop in ductility at room temperature [Citation1–4]. In the early 1970s, a few scattered studies on order–disorder transitions reported that oxygen had a natural tendency to order itself into interstitial superlattices when added in high concentration in titanium α phase [Citation5–9]. More recently, thermodynamic models relying on ab initio calculations have foretold the existence of Ti6O ordered compounds [Citation10,Citation11], with oxygen ordering on the octahedral interstitial sites of the hcp lattice, for compositions as low as 0.3 wt% oxygen at room temperature. However, these predictions have not been supported, so far, by experimental observations of such compounds for oxygen contents below the Ti6O stoichiometry. Despite the possibility for oxygen to form ordered compounds, it is generally assumed that oxygen is only found in solid solution in titanium alloys, in particular when describing the impact of oxygen addition on mechanical properties [Citation1,Citation3,Citation12–14]. Here, we set out to challenge these views and investigate the capacity of oxygen to form ordered compounds in the α phase, for titanium alloys with varying oxygen contents ranging from 0.4 to 0.8 wt% and for commercially pure grade 2 and grade 4 titanium.
Material and methods
The full investigation is performed on both grade 2 and grade 4 Commercially Pure Titanium (CP-Ti) and on arc-melted 200 g buttons of Ti–O alloys obtained from pure titanium sponges alloyed with TiO2 powder during the melting stage. As-melted ingots are hot-rolled into square-shaped bars, subsequently annealed at 923 K for 1.8ks for complete recrystallization and water quenched. Samples of all materials are then cold-rolled down to 0.6 mm thick sheets with a reduction level of 40%. The metal plates are finally recrystallized in molten salt baths at 1023 K for 600 s and subsequently water quenched. The chemical composition of the materials is checked by gas analysis ().
Table 1. Composition of the Ti–O alloys measured by gas analysis.
Polished specimens are prepared from as-quenched materials for X-ray diffraction. The latter is performed using a Panalytical XPert Pro diffractometer with Cu Kα radiation operating at 45 kV and 40 mA with a precession of the sample. The Rietveld refinement is carried out using the MAUD (Material Analysis Using Diffraction) software [Citation15]. All refinement parameters are initially locked and then manually unlocked according to the following sequence: the baseline is first adjusted, followed by the sample height z and the lattice parameters of the different crystalline structures. Then, the peak broadening induced by the crystallite size and the micro-strains is corrected by application of the theory of Popa [Citation16], and finally the material texture is adjusted using the Popa function. Conventional Transmission Electron Microscopy (CTEM) and High-Resolution TEM (HRTEM) investigations are performed on samples mechanically polished down to a thickness of roughly 100 μm. Final thinning is carried out with a Tenupol twin-jet electropolishing apparatus using a solution comprising 66% methanol, 27% butanol and 7% HClO4 at 19 V and at a temperature between −10 and −20°C. Samples are then observed with a JEOL 2100 + electron microscope operating at 200 kV. The determination of the precipitate size is carried out from TEM images using the ImageJ software [Citation17] according to the following protocol: a threshold is first performed so that all precipitates are highlighted and a ‘particle analysis’ is then launched. During this process, highlighted surfaces below 0.5 nm2 are not taken in account to reduce the contrast noise. Dynamical diffraction patterns have been computed using the software CRYSTAL developed in our laboratory by D. Gratias and M. Quiquandon based on the quantum mechanical formulation of dynamical elastic diffraction of fast electrons [Citation18,Citation19].
Results and discussion
SEM/EBSD analysis (not shown here) systematically conducted on all samples confirms that, at the mesoscopic scale, the samples are single-phased with a hexagonal alpha phase. The average grain size varies between 30 and 90 µm, depending on the samples. TEM observations are first performed on the Ti–0.8O (wt%) alloy to investigate the impact of oxygen content on the fine-scaled microstructure. (a) reveals that, in some selected zone axes, like in []α, superlattice reflections associated with ordering are observed. Dark-field images obtained using these reflections unambiguously reveal nanometric precipitates finely dispersed in the α matrix. To further investigate the nature of those precipitates, a complete set of Selected Area Diffraction Patterns (SADP) where the precipitates are in diffraction conditions are acquired ((b)). In some orientations, superlattice reflections are visible, as in [
]α, and in others, like in [
]α, the precipitates diffraction spots are observed to actually be superimposed with the matrix ones. The indexation of a complete set of diffraction patterns shows that the diffraction signature of the precipitates perfectly matches the Ti6O crystal structure [Citation7–9] ((c)). This trigonal structure (space group P31c) is very close to the one of the α-matrix, with titanium atoms lying on the same hcp lattice and oxygen atoms ordering every second layer along the [0001]α axis with one-third of octahedral sites occupied in each basal layer. The orientation relationship between the two phases inferred from the different TEM diffraction patterns can be defined as follows: [0002]α//[0002]Ti6O and (1
00)α//(1
10)Ti6O, which corresponds to the theoretical description available in the literature [Citation6,Citation7] and involves a fully coherent interface between the two phases.
Figure 1. Dark-field TEM images of Ti–0.8O alloy and corresponding []α SADP (a). Red circle indicates the superlattice reflection used to record the dark-field image. Set of SADPs taken in the Ti–0.8O alloy (b). For each zone axis (ZA), the orientation relationship between the matrix (in blue) and the Ti6O-type precipitates (in red) is specified. Atomic representation of the Ti6O crystal structure along [
]α orientation (c), obtained using VESTA three-dimensional visualization program [Citation20].
![Figure 1. Dark-field TEM images of Ti–0.8O alloy and corresponding [415¯6]α SADP (a). Red circle indicates the superlattice reflection used to record the dark-field image. Set of SADPs taken in the Ti–0.8O alloy (b). For each zone axis (ZA), the orientation relationship between the matrix (in blue) and the Ti6O-type precipitates (in red) is specified. Atomic representation of the Ti6O crystal structure along [011¯0]α orientation (c), obtained using VESTA three-dimensional visualization program [Citation20].](/cms/asset/6654608a-cfc2-4326-8bae-4db19cdc89b1/tmrl_a_2057202_f0001_oc.jpg)
depicts the simulated diffraction patterns of the precipitates structure in the zone axes where superlattices spots are visible. The proposed simulated diffraction patterns assume a sub-stoichiometric Ti6O-type structure. To account for all observed superlattice reflexions, it is necessary to consider that the two (0001) layers enriched in oxygen are actually not fully occupied, with a different composition for each layer, thus breaking the mirror symmetry between these two planes existing in the perfect and stoichiometric Ti6O structure. As a result, a perfect fit of the superlattice spots position is observed between the experimental and simulated patterns Some spots of the and the
diffraction patterns are not observable on the experimental pattern, which can be explained by their relative much lower intensity.
Figure 2. Comparison of the experimental diffraction patterns and the simulated diffraction patterns of the Ti6O structure. The chosen zone axes are those in which superlattice spots have been evidenced: (a),
(b),
(c). The red circles highlight the spots that are visible in the respective experimental image.
![Figure 2. Comparison of the experimental diffraction patterns and the simulated diffraction patterns of the Ti6O structure. The chosen zone axes are those in which superlattice spots have been evidenced: [4¯51¯6] (a), [101¯2] (b), [21¯1¯6] (c). The red circles highlight the spots that are visible in the respective experimental image.](/cms/asset/3b8f26ac-537c-40d6-b9c2-a35fa453b234/tmrl_a_2057202_f0002_oc.jpg)
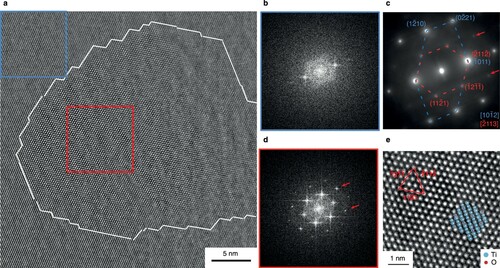
To confirm that the observed superlattice spots correspond to the diffraction signature of precipitates, High-Resolution TEM (HRTEM) observations are carried out on Ti–0.8O alloy (). HRTEM images are taken in such a way that only ()α matrix planes are visible ((a,b)) so that both phases can be differentiated. Fast Fourier transforms taken both from the matrix area ((b)) and inside the precipitate ((d)) display the different diffracting planes contributions of both structures. The superimposition of the Ti6O atomic structure in this direction perfectly fits the observed contrast ((e)), showing unambiguously that the ordered precipitates possess a Ti6O-type crystal structure.
Figure 3. High-resolution TEM image of an ordered precipitate in the Ti–0.8O alloy (a) and associated fast Fourier transforms in the matrix (in blue) (b) and in the precipitate (in red) (d). Corresponding indexed SADP (c). Organization of the atomic columns in the Ti6O crystal structure and main planes (e). Red arrows highlight the superlattice spots rows.
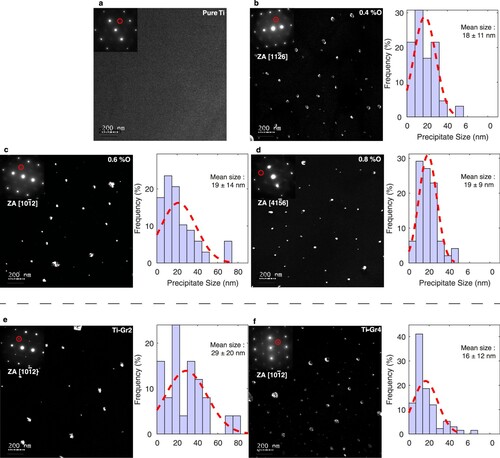
Additional TEM observations reveal that the same ordered precipitates are actually observed in all studied alloys, even at oxygen content as low as 0.157 wt%, in the Ti grade 2 (). The same observations in pure titanium (0.05 wt% of O) did not lead to any precipitate observation, thus confirming that ordered precipitates are not formed during TEM sample electropolishing and that their formation requires an oxygen content higher than 0.05 wt%. It is worth noting that the same ordered precipitates are also observed in the commercially pure grade 2 and grade 4 titanium ((e,f)). These two CP Ti alloys contain less oxygen than the pure binary Ti–O alloys synthetized for this study, showing that ordered precipitates can form for an oxygen composition as low as 0.157 wt%. The highest impurity content of these CP alloys, in particular Fe, do not inhibit this oxygen ordering. On the other hand, one should point that such ordered compounds have never been reported before in these CP alloys. Possible explanation is that the superlattices spots corresponding to the Ti6O-type precipitates are only visible in particular matrix zone axes, like []α, [
]α and [
]α, whereas the most studied zone axes are the one with the lowest indices, such as [
]α, [
]α or [
]α [Citation21]. One cannot also exclude the potential impact of the thermomechanical heat-treatment on precipitation. Looking now to the variation of the precipitation micro-structure among the different alloys, image analyses indicate that the size of the precipitates does not evolve significantly with oxygen content and remains stable around ∼18–20 nm.
Figure 4. TEM observations in dark-field conditions of the pure titanium (a), the Ti–xO alloys with x = 0.4 (b), 0.6 (c), 0.8 (d), and the titanium grade 2 (x = 0.157) (e) and grade 4 (x = 0.320) (f). The insets indicate the corresponding zone axis and show the SADPs and the reflections used to record the dark-field images (red circles). The corresponding distribution function of the precipitates size is represented for each alloy.
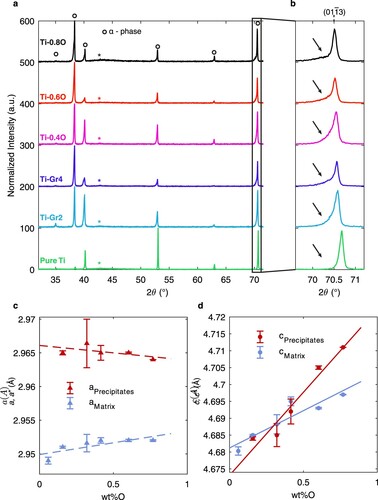
In order to give a complementary insight on the presence of these ordered nanoprecipitates, X-ray diffraction (XRD) analyses are performed on the different Ti–O alloys (). All diffraction patterns display a series of peaks compatible with the sole presence of the α phase. No additional diffraction peaks are thus observed, which can be reasonably accepted on the basis of the theoretical diffraction intensities of the Ti6O phase as shown in Supplementary Information Content Fig. 1. Indeed, most of the Ti6O peaks display a relative intensity below 1%, making them hardly detectable by XRD analyses and only peaks corresponding also to diffraction peaks of the α matrix have a high enough intensity to be evidenced. However, as it will be shown below, these diffraction peaks existing both for the matrix and the ordered precipitates bring important information on the lattice mismatch between both phases. Looking more closely to XRD data, a systematic shoulder can be observed on most of the α peaks, which intensity increases with oxygen content. This asymmetric broadening is due to the overlap of intense peaks from the α-Ti matrix with small and broad peaks, at slightly lower angles, arising from the ordered nanoprecipitates. The increasing visibility of these shoulders when the oxygen content increases can be explained by the lattice mismatch evolution between the α-matrix and the ordered nanoprecipitates. As shown in (c), all lattice parameters increase with oxygen content, as determined by Rietveld refinement assuming a mixture of α phase and of Ti6O-type ordered phase. The increase in the c parameter of the precipitates is much stiffer than for the matrix, leading to an increasing mismatch between both structures. Regarding the matrix, it can be calculated that the c parameter along the [0001] axis increases more rapidly than a parameter, i.e. distances in the basal plane, consistently with the known evolution of α-Ti with oxygen [Citation22,Citation23].
Figure 5. XRD analyses of the Ti–xO alloys (a) and evolution of the shoulder on the reflection with oxygen content (b). Evolution of the lattice parameters of the matrix (in blue) and of the precipitates (in red) deduced by Rietveld analysis from XRD data (c). Parameters of the precipitates are normalized by a* = a(Ti6O)/√3 and c* = c(Ti6O)/2 for comparison with the matrix. Error bars represent the estimated error on the values obtained by Rietveld refinement. The peaks marked by the symbol * in XRD data correspond to an artifact due to sample holder.
The ordered precipitates evidenced in our work are in agreement with the phase diagram deduced from ab initio calculations in [Citation11], showing such an ordering of oxygen atoms at low temperature. Neglecting the potential impact of impurity elements, results obtained in grade 2 CP Ti show that the formation of Ti6O-type ordered precipitates may occur when the global concentration of oxygen is above 0.15 wt%. Water-quenched conditions used here does not allow reaching a fully stable equilibrium microstructure. As a consequence, lattice parameters of the two phases, the α solid solution on the one hand and the ordered precipitates on the other hand, vary with the nominal oxygen concentration, a signature that the composition of these two phases evolves. It may however be noticed that such water-quenched conditions are severe compared to common practice in titanium metallurgy. The formation of Ti6O precipitates is also expected from softer quenching conditions, with a precipitation microstructure probably closer from equilibrium.
Observation of Ti6O-type precipitates also call for revisiting our current understanding of oxygen impact on the mechanical properties of titanium alloys, which have mostly been described in the light of a strong interaction of individual oxygen atoms with mobile dislocations leading to a drastic strength increase [Citation3,Citation4]. In addition to the usual solid solution contribution, it appears necessary to also consider these ordered precipitates. Finally, beyond the case of the binary Ti–O alloys described in our work, the question of the existence of such ordered Ti6O precipitates in other titanium alloys naturally arises.
Conclusion
The Ti–O alloys of this study demonstrate the oxygen capability to order even in diluted titanium alloys. The Ti6O-type precipitates evidenced here present a crystalline structure very close to the α-hcp lattice, making them challenging to observe. These observations open promising perspectives which should lead to reconsider the precise role of oxygen on the evolution of the mechanical properties of titanium alloys for example. They also open a wide scientific field on the role of other possible alloying elements on this ordering tendency: it is not excluded that this ordering may also be actually observed in titanium alloys with a more complex chemistry. Finally, a whole study is to be conducted to understand the thermodynamic origin of this ordering with respect to the thermo-mechanical path followed for these alloys.
Supplemental Material
Download MS Word (108.6 KB)Acknowledgements
M. Quiquandon and D. Gratias are gratefully acknowledged for their help with the TEM diffraction simulations.
Disclosure statement
No potential conflict of interest was reported by the author(s).
Additional information
Funding
References
- Conrad H. Effect of interstitial solutes on the strength and ductility of titanium. Prog Mater Sci. 1981;26:123–403.
- Lutjering G, Williams JC. Titanium. 2nd ed. Berlin: Springer-Verlag; 2007.
- Yu Q, Qi L, Tsuru T, et al. Origin of dramatic oxygen solute strengthening effect in titanium. Science. 2015;347:635–639.
- Chong Y, Poschmann M, Zhang R, et al. Mechanistic basis of oxygen sensitivity in titanium. Sci Adv. 2020;6:1–11.
- Hirabayashi M, Yamaguchi S, Asano H, et al. Order-disorder transformations of interstitial solutes in transition metals of IV and V groups. In: Warlimont H, editor. Order-disorder transform alloy [Internet]. Berlin: Springer-Verlag; 1974. p. 266–302. Available from: http://www.elsevier.com/locate/scp.
- Banerjee S, Mukhopadhyay P. Oxygen ordering in alpha-alloys. In: S Banerjee, P Mukhopadhyay, editors. Phase transform examples from titan zircon alloy. New York (NY): Elsevier Science; 2007. p. 764–769.
- Yamaguchi S. Interstitial superlattice of Ti6O and its transformation. J Phys Soc Japan. 1966;21:2096.
- Yamaguchi S. Interstitial order-disorder transformation in the Ti-O solid solution. I. Ordered arrangement of oxygen. J Phys Soc Japan. 1969;27:155–163.
- Yamaguchi S, Hiraga K, Hirabayashi M. Interstitial order-disorder transformation in the Ti-O solid solution. IV. A neutron diffraction study. J Phys Soc Japan. 1970;28:1014–1023.
- Burton BP, Van De Walle A. First principles phase diagram calculations for the octahedral-interstitial system αtiO X, 0≤X≤1/2. Calphad Comput Coupling Phase Diagr Thermochem. 2012;39:97–103. DOI:https://doi.org/10.1016/j.calphad.2012.09.004.
- Gunda NSH, Puchala B, Van Der Ven A. Resolving phase stability in the Ti-O binary with first-principles statistical mechanics methods. Phys Rev Mater. 2018;2:33604. doi:https://doi.org/10.1103/PhysRevMaterials.2.033604.
- Naka S, Lasalmonie A, Costa P, et al. The low-temperature plastic deformation of α-titanium and the core structure of a-type screw dislocations. Philos Mag A Phys Condens Matter Struct Defects Mech Prop. 1988;57:717–740.
- Barkia B, Couzinié JP, Lartigue-Korinek S, et al. In situ TEM observations of dislocation dynamics in α titanium: effect of the oxygen content. Mater Sci Eng A. 2017;703:331–339.
- Chaari N, Rodney D, Clouet E. Oxygen-dislocation interaction in titanium from first principles. Scr Mater. 2019;162:200–203. doi:https://doi.org/10.1016/j.scriptamat.2018.11.025.
- Lutterotti L. Total pattern fitting for the combined size-strain-stress texture determination in thin film diffraction. Nucl Instruments Methods Phys Res Sect B. 2010;268:334–340.
- Popa NC. The (hkl) dependence of diffraction-line broadening caused by strain and size for all Laue groups in Rietveld refinement. J Appl Crystallogr. 1998;31:176–180.
- Schneider CA, Rasband WS, Eliceiri KW. NIH image to ImageJ: 25 years of image analysis. Nat Methods. 2012;9:671–675.
- Gratias D, Portier R. Time-like perturbation method in high-energy electron diffraction. Acta Crystallogr Sect A. 1983;39:576–584.
- Quiquandon M, Beauchesne JT, Gratias D. Simulations of high-resolution electron microscopy images of icosahedral quasicrystals. Philos Mag. 2008;88:1941–1948.
- Momma K, Izumi F. VESTA 3 for three-dimensional visualization of crystal, volumetric and morphology data. J Appl Crystallogr. 2011;44:1272–1276.
- Zhang R, Zhao S, Ophus C, et al. Direct imaging of short-range order and its impact on deformation in Ti-6Al. Sci Adv. 2019;5:1–8.
- Murray JL, Wriedt HA. The O-Ti (oxygen-titanium) system. J Phase Equilibria. 1987;8:148–165.
- Wiedemann KE, Shenoy RN, Unnam J. Microhardness and lattice parameter calibrations of the oxygen solid solutions of unalloyed α-titanium and Ti-6Al-2Sn-4Zr-2Mo. Metall Trans A. 1987;18:1503–1510.