
Abstract
This study provides a quantitative way to tailor the grain structure in laser powder bed fusion (LPBF). Square-bottomed columnar grains (SCGs) were developed with a certain width roughly equal to the hatch spacing. The development of SCGs relied on different distinguishable regions, which were identified based on the differences in microstructural features between the melt-pool side and centreline. High lattice rotation accumulated at the melt-pool centreline, leading to grain boundaries forming at the centreline regions. The ultrasonic attenuation measurements and microhardness tests further validated the controllable properties. The findings indicated a novel approach to customise the material property.
GRAPHICAL ABSTRACT

IMPACT STATEMENT
A method to quantitatively control the columnar grain width in laser powder bed fusion was uncovered. The controllable properties were indicated, and the formation mechanism was revealed.
1. Introduction
Grain morphology (GM) control has recently gained great interest in metal additive manufacturing (AM) [Citation1–3], as both can significantly affect properties of engineering materials, such as strength and ductility [Citation4], anisotropies [Citation5], fracture behaviour [Citation6], fatigue [Citation7] and corrosion resistance [Citation8]. Therefore, controlling the grain structure/size by AM is believed to be a promising method to customise the performance of the components.
Melt pool is the unit for the laser powder bed fusion (LPBF) process. Via the melt pool control, GM control has been realised in LPBF mainly through two approaches. One is changing the melt pool dynamics, including changing energy input (such as the laser beam intensity profile [Citation9], laser power [Citation10], scanning speed [Citation11], and energy density [Citation12]) and the thermal transfer (such as the preheating temperature [Citation13] and scanning length [Citation14]). Using this approach, the melt pool morphology changes, which affects the solidification direction, solidification rate, and thermal history. Consequently, GM changes. The other is changing the interaction between melt pools, including changing the scan rotation [Citation15] and other scan strategies [Citation16]. Via this approach, GM changes due to the changes in the mismatch between the seed grain orientation and the maximum thermal direction. However, these methods are qualitative. Methods to quantitatively control the grain size of AM metals are yet to be explored. Recently, it was reported that the melt-pool centreline region contains fine grains with higher grain boundary (GB) density [Citation17]. The distance between the melt-pool centreline can be determined by hatch spacing, which is often optimised based on melt pool dimension to avoid lack-of-fusion defects [Citation18]. Compared with laser power and scanning speed, hatch spacing has less effect on the solidification process [Citation19]. Therefore, opportunity for quantitative control of the microstructure may arise when the microstructure features like GBs within one melt-pool are minorly affected. In such scenario, changing the overlapping of the melt-pool by altering the hatch spacing can be an effective method to quantitatively control the GB density. Here, we report a method to semi-quantitatively control the columnar grain width of stainless steel 316L (SS316L) fabricated by LPBF. The method holds a promise to be further extended to other AM materials dominated by columnar grain.
2. Material and methods
Gas atomised SS316L powder with the particle sizes of 5–25 μm was used to produce cubes (11 × 11 × 11 mm3) via an in-house developed micro LPBF system equipped with a continuous 500 W IPG fibre laser (λ = 1.07 μm, beam diameter = 25 μm). The details for the powder and the equipment can be found in our previous publication [Citation20]. The processes were conducted under a N2 atmosphere (O2 < 200 ppm). The laser power of 65 W, scanning speed of 400 mm/s, layer thickness of 10 µm, rotation angle of 90° and a variable hatch spacing of 15/30/45/60/75 µm (identified as H1/H2/H3/H4/H5) were employed. The scan strategy was bi-directional.
The microstructure was observed by scanning electron microscopy (SEM) and electron back-scatter diffraction (EBSD). The step size for EBSD test was 0.8 µm. The EBSD data were analysed using the software Channel 5. Immersion ultrasonic test was conducted on samples using a 10 MHz transducer. The experiment setting and the calculation for the ultrasonic attenuation were described in Figure S1 in Supplementary Material. Nanoindentation experiments with Berkovich tip were performed on the x–y plane (horizontal section) of each sample and the details were demonstrated in Figure S2. Vickers microhardness test was carried out on the vertical-sectional samples with a load of 2 kg and a loading time of 15 s. The distance between the two adjacent indents was 0.5 mm along horizontal direction and 1 mm along vertical direction. The averages of 50 microhardness indents were used to indicate overall hardness of the samples.
3. Results
Figure (a) shows the GMs of the samples, observed along the x–y plane and the x–z plane (vertical section, equivalent to y–z plane). All the samples show typical columnar grain characteristics. The GM can be divided into two different types: square-bottomed columnar grains (SCGs) and random columnar grains (RCGs). In Sample H2–H5, the morphology of grains in the horizontal section is chessboard-liked while it is an array of rectangular shape columnar grains with the main axis parallel to the building direction (BD, z-direction) in the vertical section. The columnar grains are separated by high-density fine grains. These samples are identified consisting of a series of SCGs. Nevertheless, among all the SCG-dominating samples, Sample H5 shows a much larger GB density along the BD, which means the SCGs are easily broken under the extra-large hatch spacing. Different from SCGs dominating samples, in Sample H1, the morphology and the size of columnar grains are quite random.
Figure 1. (a) Grain morphology (GM) of the samples: (I) H1; (II) H2; (III) H3; (IV) H4; (V) H5, (b) lines AB drawn in x–y planes, (c) magnification of the misorientation profile showing the different regions, (d) average major and minor width as hatch spacing changes, (e) misorientation angle profile along line AB.
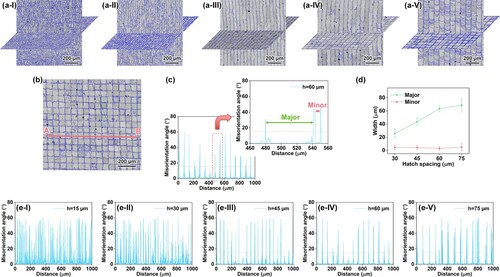
For detailed characterisation of both SCGs and RCGs, the misorientation angle variations along the x- and y-directions have been measured, as schematically shown in Figure (b). In SCGs dominating samples, across the line AB, two distinguishable spacings between the adjacent high-angle grain boundaries can be observed (Figure (c)): (1) minor (narrow) regions, demonstrating the GBs of the random fine grains; and (2) major (wide) regions, demonstrating the GBs of the SCGs. As shown in Figure (d), the widths of the major regions are close to the hatch spacing employed, which are 25 ± 7 μm, 43 ± 6 μm, 63 ± 5 μm and 69 ± 10 μm, respectively. As the hatch spacing increases, the widths of minor regions remain constant as ∼4 μm. In RCGs dominating samples, the spacing between the adjacent peaks is less distinguishable (Figure (e)). The different correlation between the grain width and the hatch spacing indicates that the respective grain growth mechanisms are different.
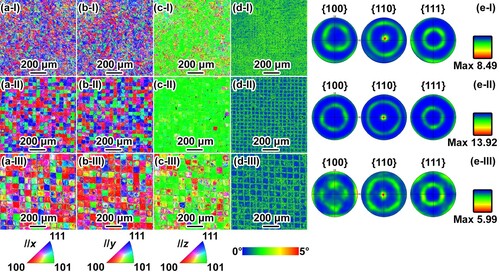
To clarify the grain growth mechanism, the crystallographic orientation analyses were conducted on three representative samples (H1/H3/H5). A strong <110>//z texture is observed in all samples (Figure ). In Sample H3, the <110>//z orientation is found in most SCGs. Along the x- or y-direction, SCGs show various orientations. The squared regions with different orientations in the inverse pole figure (IPF) maps indicate that the epitaxial growth is only accomplished in each single SCG, forming a fibre texture. The kernel average misorientation (KAM) map (Figure (d)) highlights the distinct regions. The minor regions, where the fine grains form, are the high local misorientation angle regions (HMRs). In contrast, the major regions are the low local misorientation angle regions (LMRs). Sample H5 displays the similar characteristics with Sample H3. Nevertheless, the <100>//z orientation can be more easily observed in the major region, resulting a weaker texture intensity. Besides, more major regions result in HMRs. In Sample H1, although the <110>//z orientation still dominates, distinct regions cannot be observed.
Figure 2. Inverse pole figure (IPF) maps of the samples (I) H1, (II) H3 and (III) H5 along the (a) x-, (b) y- and (c) z-directions in the x–y plane; (d) kernel average misorientation (KAM) map; (e) corresponding pole figures (PFs).
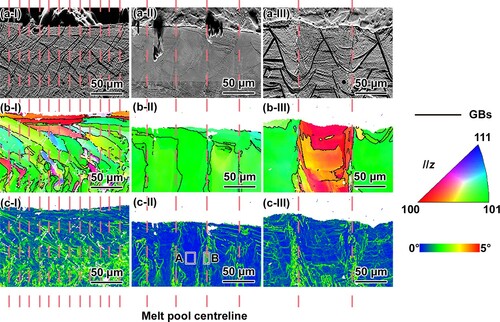
As the hatch spacing alters the overlapping of the melt pool (89%, 75%, 58%, 37% and 15%, along with the increasing hatch spacing), further analyses were conducted to investigate the crystallographic orientation at the melt-pool level. According to KAM map (Figure (c)), in Sample H3, the HMRs are mostly located at the melt-pool centreline. The average value in the region A is 0.21° while the average value in the region B is 0.95°. The centrelines divide the materials into multiple LMRs. Between the centrelines, the GBs are barely found. The crystallographic orientation demonstrates the same characteristics described above. The difference in Sample H5 is that a few GBs are found between the centrelines, associating with the <100>//z orientation (Figure (b)). In Sample H1, the melt pools are much closer, and the regions of melt-pool centreline are mostly remelted by the subsequent scanning tracks in the same layer. Multiple orientations form along the various thermal gradient directions.
Figure 3. (a) Back-scatter electron (BSE) images of the samples: (I) H1; (II) H3; (III) H5; (b) IPF map along the BD and grain boundary (GB) distribution; (c) KAM maps.
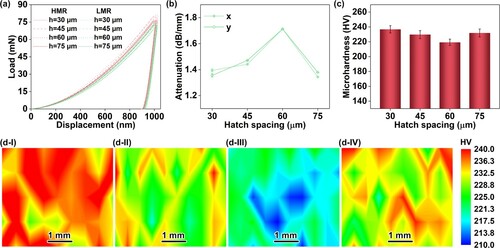
The ultrasonic attenuation test can be used to evaluate the overall grain size in the samples due to the positive correlation between the ultrasonic attenuation and the grain size [Citation21]. Besides, the ultrasonic attenuation has been found to be inversely correlated with the UTS and ductility of the AM-fabricated SS316L [Citation22]. Hence, the immersion ultrasonic test was conducted to demonstrate the overall grain size and indicate the mechanical responses of different SCGs dominating samples. In both directions, the ultrasonic attenuation from the samples increases first and then decreases with respect to the hatch spacing (Figure (b)). The reason for the evolution is that the width of the SCGs increases as the hatch spacing increases, and the ultrasonic attenuation increases with the grain size. However, the broken SCGs make the GB density increase and thus grains smaller, leading to smaller ultrasonic attenuation due to the less scattering in Sample H5. The similarity between the results along the x- and y-directions further proves the homogeneity for GB density along the two directions. The texture effect is excluded as there is no obvious texture along both transmit directions. Based on the EBSD and ultrasonic test results, the SCGs were indicated to exist in the entire samples. The ultrasonic test result also indicates that the mechanical properties decrease first and then increase as the hatch spacing increases. The microhardness test (Figure (c)) validates the result. The microhardness maps (Figure (d)) further demonstrate that the property of the sample is controllable by the distribution of HMRs and LMRs. The representative nanoindentation load-displacement curves (Figure (a)) show that the HMRs demonstrate a higher maximum load, which is contributed by the GB strengthening.
Figure 4. (a) Representative nanoindentation load-displacement curves; (b) ultrasonic attenuation and (c) average microhardness of the SCGs dominating samples; (d) microhardness map of the samples: (I) H2; (II) H3; (III) H4; (IV) H5.
4. Discussion
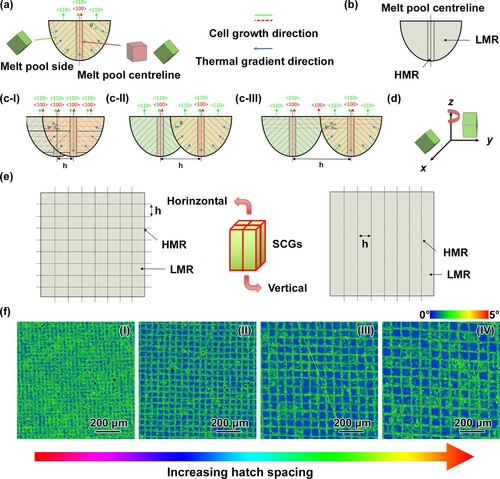
The formation of GBs is associated with the distinct cell growth, which is relevant to the heat flow direction. At the V-shape keyhole melt-pool side, the cell prefers to grow at an inclination of ∼±45° with respect to BD, resulting in <110>//z orientation. The epitaxial growth results in LMRs. At the melt-pool centreline, Gokcekaya et al. [Citation4] have indicated that the heat flow direction is either stable but different from the melt-pool side or unstable and fluctuating. The orientation in the melt-pool centreline varies from <100>//z to <110>//z. In both cases, HMRs are easy to form around the melt-pool centreline. With the high lattice rotation in HMRs, the epitaxial growth is easily interrupted. Consequently, an interface which separates the LMRs and HMRs takes into shape (Figure (b)). The GBs are likely to form at the interface.
Figure 5. (a) Schematic illustration depicting solidification of the cell in single melt pool; (b) corresponding distinct regions (LMR and HMR) in single melt pool; (c) effect of the melt pool overlapping on the cell growth under small hatch spacing (I), large hatch spacing (II) and extra-large hatch spacing (III); (d) lattice rotation with 90° scan rotation strategy. (e) LMRs and HMRs in samples; (f) KAM maps of samples: (I) H2; (II) H3; (III) H4; (IV) H5.
The interface can be broken if the melt-pool centreline is partially remelted. Considering the melt pool overlapping, three different possible scenarios are illustrated in Figure (c). In the last two scenarios, the overlapping ratio is less than 50%, and LMRs of the subsequent melt pool will not contact with HMRs of the previous melt pool. The interface remains. In Scenario II, the final solidified layer is a lamellated microstructure with the HMR (fine grains) at the melt-pool centreline and the LMRs (SCGs) between the adjacent HMRs (Figure (c-II)). Nevertheless, as the top of the melt pool will be partially remelted by the subsequent layer, the solidification process of the subsequent layer will be barely affected if the broken centreline is remelted. Therefore, the overlapping ratio of the remaining melt pool, which is defined as the effective overlapping ratio, should be smaller than 50%. The orientation of the LMRs is <110>//z. HMRs contact with LMRs. Therefore, the fluctuating HMRs are more likely to result in the orientations close to <110>//z rather than <100>//z. Hence, IPF map in Figure (c) shows that most square boundaries result in green to yellow in colour. In Scenario III, an extra-large hatch spacing (75 μm in the present study) triggers the lateral growth at the necking of the keyhole melt pool, resulting in <100>//z texture in LMRs (Figure (c-III)). The activation of the <100>//z texture also increases the possibility of the appearance of this texture in HMRs.
Considering the multiple layers in Scenario II, for the materials upon the HMRs in the previous layer and the melt-pool centreline materials upon the LMRs in the previous layer, the epitaxial growth is hard to maintain due to the high lattice rotation, so these areas are HMRs in the final samples. Previous research has indicated that <100>//SD texture can be easily formed in face-centred-cubic materials with a 0° scan rotation strategy [Citation23–25]. With the 90° rotation, the scanning direction is either x- or y-direction in different layers. For the melt-pool side materials upon LMRs in the previous layer, the maximum thermal gradient direction is not parallel but inclined to the BD. The <110>//z can be maintained with the angular mismatch θ less than 45° in both x- and y-scanned melt pools. The rotation of the scanning direction causes the rotation of the preferential crystallographic orientation around the BD. The rotation of the crystallographic growth direction will be in an equilibrium state with a certain direction between <100>//x and <100>//y, as shown in Figure (d). Therefore, the epitaxial growth is achieved in each LMR. In the horizontal-section (x–y plane), the chessboard patterns are formed with the 90° rotation. The criss-crossed HMRs divided the samples into square regions, which are LMRs, as shown in Figure (e). The corresponding KAM maps (Figure (f)) provide the experimental theoretical analysis. In the final samples, the SCGs form in LMRs, and the fine grains form in HMRs. The array of centreline is controlled by the hatch spacing, so the width of SCGs is close to the hatch spacing. In Scenario III, the activation of the <100>//z texture affects the solidification in the subsequent layer, leading to the epitaxial growth in partial LMRs. However, <100>//z in major regions is not stable. <110>//z will easily nucleate and grow owing to the maximum thermal direction. There are GBs between the <100>//z orientated grains and <110>//z orientated grains, and thus SCGs are easily broken.
For the first scenario, as the centreline is broken due to the large melt pool overlapping, the regions divided by the centreline cannot be identified. The overlap of HMR and LMR intensifies the conflict between the heat flow direction and pre-nucleated grain orientation. Consequently, the LMRs disappear, and the final solidified layer is a mixed microstructure, as shown in Figure (c-I). For the multiple layers, the chessboard pattern based on the differences in the local misorientation cannot form. Hence, the control of columnar grain width via hatch spacing cannot be achieved. The interaction between the different LMRs makes the epitaxial growth difficult. Consequently, RCGs are dominant GM in the samples.
It is worthy pointing out that previous analyses are based on the overlapping by the same melt pool. However, varying the scan strategy affects the thermal accumulation during LPBF. For instance, short scanning vector will enhance the thermal accumulation, leading to the increase in the track dimension. In this case, the melt pool flow behaviour and the solidification texture will change, which makes the control less effective. Chessboard with a small scanning length is a typical example. Adjusting the laser power or scanning speed to maintain the melt pool morphology can resolve the issue.
5. Conclusions
In this study, we achieved the semi-quantitative control of columnar grain width in LPBF via altering hatch spacing. We further studied the formation mechanism of the SCGs. With an effective overlapping ratio smaller than 50%, the regions distinguished by different local misorientation angles can remain. Two distinct regions (LMR and HMR), together with the 90° scan rotation, contribute to the formation of the chessboard-liked microstructure. The LMR, in which cells epitaxially grow in the <110> direction along the BD, is the major regions in SCGs. The criss-crossed melt pool centrelines divide the space into the squared regions, and thus the width of the SCGs can be controlled by the hatch spacing.
Supplemental Material
Download MS Word (1.5 MB)Disclosure statement
No potential conflict of interest was reported by the author(s).
Additional information
Funding
References
- Todaro CJ, Easton MA, Qiu D, et al. Grain structure control during metal 3D printing by high-intensity ultrasound. Nat Commun. 2020;11(1):1–9.
- Zhao R, Chen C, Shuai S, et al. Enhanced mechanical properties of Ti6Al4V alloy fabricated by laser additive manufacturing under static magnetic field. Mater Res Lett. 2022;10(8):530–538.
- Plotkowski A, Ferguson J, Stump B, et al. A stochastic scan strategy for grain structure control in complex geometries using electron beam powder bed fusion. Addit Manuf. 2021;46:102092.
- Gokcekaya O, Ishimoto T, Hibino S, et al. Unique crystallographic texture formation in Inconel 718 by laser powder bed fusion and its effect on mechanical anisotropy. Acta Mater. 2021;212:116876.
- Ni M, Chen C, Wang X, et al. Anisotropic tensile behavior of in situ precipitation strengthened Inconel 718 fabricated by additive manufacturing. Mater Sci Eng A. 2017;701:344–351.
- Wu B, Pan Z, Ding D, et al. Effects of heat accumulation on microstructure and mechanical properties of Ti6Al4V alloy deposited by wire arc additive manufacturing. Addit Manuf. 2018;23:151–160.
- Kumar P, Jayaraj R, Suryawanshi J, et al. Fatigue strength of additively manufactured 316L austenitic stainless steel. Acta Mater. 2020;199:225–239.
- Laleh M, Hughes AE, Xu W, et al. On the unusual intergranular corrosion resistance of 316L stainless steel additively manufactured by selective laser melting. Corros Sci. 2019;161:108189.
- Shi R, Khairallah SA, Roehling TT, et al. Microstructural control in metal laser powder bed fusion additive manufacturing using laser beam shaping strategy. Acta Mater. 2020;184:284–305.
- Choo H, Sham KL, Bohling J, et al. Effect of laser power on defect, texture, and microstructure of a laser powder bed fusion processed 316L stainless steel. Mater Des. 2019;164:107534.
- Sabzi HE, Hernandez-Nava E, Li XH, et al. Strengthening control in laser powder bed fusion of austenitic stainless steels via grain boundary engineering. Mater Des. 2021;212:110246.
- Sun SH, Ishimoto T, Hagihara K, et al. Excellent mechanical and corrosion properties of austenitic stainless steel with a unique crystallographic lamellar microstructure via selective laser melting. Scr Mater. 2019;159:89–93.
- Li W, Liu J, Zhou Y, et al. Effect of substrate preheating on the texture, phase and nanohardness of a Ti-45Al-2Cr-5Nb alloy processed by selective laser melting. Scr Mater. 2016;118:13–18.
- Hocine S, Van Swygenhoven H, Van Petegem S, et al. Operando X-ray diffraction during laser 3D printing. Mater Today. 2020;34:30–40.
- Leicht A, Yu CH, Luzin V, et al. Effect of scan rotation on the microstructure development and mechanical properties of 316L parts produced by laser powder bed fusion. Mater Charact. 2020;163:110309.
- Salman OO, Brenne F, Niendorf T, et al. Impact of the scanning strategy on the mechanical behavior of 316L steel synthesized by selective laser melting. J Manuf Process. 2019;45:255–261.
- Aota LS, Bajaj P, Zilnyk KD, et al. Recrystallization kinetics, mechanisms, and topology in alloys processed by laser powder-bed fusion: AISI 316L stainless steel as example. Materialia. 2021;20:101236.
- Sun Z, Chueh YH, Li L. Multiphase mesoscopic simulation of multiple and functionally gradient materials laser powder bed fusion additive manufacturing processes. Addit Manuf. 2020;35:101448.
- Mahmoudi M, Tapia G, Franco B, et al. On the printability and transformation behavior of nickel-titanium shape memory alloys fabricated using laser powder-bed fusion additive manufacturing. J Manuf Process. 2018;35:672–680.
- Fu J, Qu S, Ding J, et al. Comparison of the microstructure, mechanical properties and distortion of stainless steel 316L fabricated by micro and conventional laser powder bed fusion. Addit Manuf. 2021;44:102067.
- Stanke FE, Kino GS. A unified theory for elastic wave propagation in polycrystalline materials. Acoust Soc Am. 1984;75(3):665–681.
- Huang N, Cook OJ, Smithson RL, et al. Use of ultrasound to identify microstructure-property relationships in 316 stainless steel fabricated with binder jet additive manufacturing. Addit Manuf. 2022;51:102591.
- Dovgyy B, Piglione A, Hooper PA, et al. Comprehensive assessment of the printability of CoNiCrFeMn in laser powder bed fusion. Mater Des. 2020;194:108845.
- Sofinowski KA, Raman S, Wang X, et al. Layer-wise engineering of grain orientation (LEGO) in laser powder bed fusion of stainless steel 316L. Addit Manuf. 2021;38:101809.
- Thijs L, Kempen K, Kruth JP, et al. Fine-structured aluminium products with controllable texture by selective laser melting of pre-alloyed AlSi10Mg powder. Acta Mater. 2013;61(5):1809–1819.