
 ?Mathematical formulae have been encoded as MathML and are displayed in this HTML version using MathJax in order to improve their display. Uncheck the box to turn MathJax off. This feature requires Javascript. Click on a formula to zoom.
ABSTRACT
Dislocations form patterns that strongly influence mechanical properties. Prevailing theories are dichotomous: patterns either form by energy minimization or stochasticity during plastic flow. Using discrete dislocation dynamics simulations, it is shown that both energy and stochasticity contribute to patterns. Monte Carlo simulations reveal that short-range forces between dislocations lead to wall-like structures, while long-range forces control the wall thickness. Perturbation simulations demonstrate that persistent, low-density regions form when the network is perturbed over sufficient deformation. These findings suggest a two-stage process where stochasticity forms low-density regions, which then lead to confined walls through local energy minimization.
GRAPHICAL ABSTRACT
IMPACT STATEMENT
Dislocation patterns govern mechanical properties of metals. Contrary to previous thinking, we demonstrate that both energy minimization and stochasticity govern the emergence and nature of dislocation patterns.
Introduction
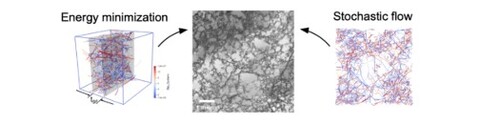
Dislocation lines—the primary carriers of plasticity in crystalline solids—have a tendency to self-organize into quasi-ordered patterns, often comprised of low-density cells surrounded by high density walls, as shown in Figure (a). These patterns are important because they strongly influence mechanical properties, such as fatigue life [Citation1], resistance to irradiation damage [Citation2], hydrogen embrittlement [Citation3], and propensity for void nucleation [Citation4,Citation5]. While many hypotheses have been proposed to explicate these patterns [Citation6–13], the most widely cited are the theory of low energy dislocation structures (LEDS) [Citation10], which posits that patterns form to minimize energy, and the stochastic patterning (SP) model [Citation9,Citation14] in which stochastic noise drives patterning. On the other hand, recent work using continuum dislocation dynamics simulations suggests that the LEDS and SP mechanisms operate concurrently to drive patterning [Citation6,Citation7,Citation15,Citation16]. Simulations using discrete dislocations have also revealed fundamental aspects of patterning [Citation17–19]. Despite these advances, the basic dislocation processes which give rise to patterning are not well understood. Here we show using discrete dislocation dynamics (DDD) simulations that both energy minimization and stochasticity play important roles in pattern formation; they are the yin and yang (the seemingly opposing forces that share a deep interconnection) of dislocation patterning.
Figure 1. (a) Transmission electron micrograph of cellular patterning in Ni [Citation24] (reproduced with permission). (b) Snapshot from MC-DDD simulation of wall structure formation. (c) thick slab extracted from a DDD tensile test simulation after 0.5% strain with a perturbation region radius
. Colors in (b,c) represent slip systems.
![Figure 1. (a) Transmission electron micrograph of cellular patterning in Ni [Citation24] (reproduced with permission). (b) Snapshot from MC-DDD simulation of wall structure formation. (c) 4.3μm thick slab extracted from a DDD tensile test simulation after 0.5% strain with a perturbation region radius R=4.3μm. Colors in (b,c) represent slip systems.](/cms/asset/9f90de8a-674a-4d80-9acb-11b5dc6ebe9d/tmrl_a_2149283_f0001_oc.jpg)
We can decompose the problem of cellular pattern formation into two mechanistic questions: What gives rise to regions of low density which eventually become cells? And what stabilizes and confines the dislocation content within the high density walls? Coupled to these questions is the quandary over what controls the length scales characterizing the cells and walls. To pursue answers to these questions, we have developed DDD-based techniques and studied dislocation patterning in single crystalline, face-centered cubic (FCC) metals.
Materials and methods
DDD simulations were performed using the ParaDiS code [Citation20] with the subcycling time integrator [Citation21] using elastic constants for pure Cu (shear modulus of 54.6 GPa and Poisson's ratio of 0.324). To simulate wall formation, the Monte Carlo DDD (MC-DDD) approach of Deka and Sills was used [Citation22]. Periodic boundary conditions were used in the plane of the putative wall (the x–y plane) and infinite boundary conditions in the direction orthogonal to the wall (in the z-direction) to avoid spurious image interactions that may affect wall formation. For all results in the manuscript, our cubic simulation cell is 30, 000b on each edge (results with a larger cell are shown in the Supplemental Material) and is oriented with axes. We model an FCC metal with
slip systems. Each MC-DDD simulation was initialized with an array of parallel edge dislocations separated by distance
(we show in the Supplemental Material that our findings are insensitive to the initial structure). No stresses were applied. During the MC line insertion step, periodic dislocation lines which span the simulation cell were inserted randomly. If the net force toward the center of the box on the inserted dislocation line resulting from elastic interactions with all dislocations in the system is below
(negative forces are attractive), then the line is accepted. Otherwise it is deleted and another attempt is made. Below we present normalized values for the MC-DDD force acceptance parameter as
, where μ is the shear modulus and b is the magnitude of the Burgers vector. In MC-DDD the acceptance criterion can be designed to answer specific questions about dislocation structure formation and evolution. The criterion we used here was designed to enable studies of planar wall formation. All
dislocations are confined to
planes, no climb motion and no cross-slip is allowed except for in a few simulations given in the Supplemental Material. Each MC-DDD simulation was run on a single CPU for up to two weeks. Wall thicknesses resulting from these simulations were quantified by determining the thickness that contains 95% of the total dislocation line length,
. The steady-state thickness was obtained by fitting a tanh function to the
vs. MC step number data and taking
of the asymptotic value as steady-state.
For the DDD perturbation simulations of cell formation, fully periodic boundary conditions were used. The initial system was comprised of straight, periodic dislocation lines which were first relaxed under zero applied stress until a stable network formed. All dislocations are confined to
planes, no climb motion and no cross-slip was allowed. Then a strain rate of
was applied in the
direction. To perturb the network, junction formation was suppressed by preventing node splits associated with junction formation and using a relatively large core radius of a = 600b [Citation23], which almost entirely suppresses junction formation. To compute radial dislocation density profiles from the center of the cubic simulation cell, the simulation cell was divided into 30 spherical shells of equal thickness. The total dislocation line length inside each shell was then used to compute the density as a function of radius. Each perturbation simulation was typically run on 64 cores for 4 weeks.
Results
First we consider cell-wall formation using MC-DDD simulations. We showed previously how these MC-DDD simulations naturally lead to the formation of cell-wall-like structures—as shown in Figure (b)—that converge to a steady-state thickness as long as
is below a critical value,
[Citation22]. Since the interaction forces between dislocations result from following downhill gradients in elastic energy, this finding is in line with the LEDS hypothesis.
Given that MC-DDD predicts formation of stable wall structures, such as those observed in cellular patterns, we seek to determine what aspects of dislocation physics govern wall formation and control the wall thickness. While the formation of these cell-wall-like structures is insensitive to many physical phenomena (see Supplemental Material), the range of elastic interactions has a strong influence. In materials, the range and magnitude of elastic interactions are controlled by the dislocation core structure (e.g. extended versus compact) and arrangement of lines (e.g. dipolar bundles, low-angle boundaries). Here we are interested in modulating short- and long-range interactions to see how they influence wall formation. By ‘short’ and ‘long’ range interactions, we simply mean elastic interactions nearer to dislocations versus their long-range 1/r tails. To reduce the short-range interactions we increase the dislocation core radius, a, used to compute dislocation stress fields [Citation25]. While increasing a does not alter the steady-state wall thickness, it does have a significant influence on the acceptance rate for MC line insertion, as shown in Figure (a). Specifically, as a is increased the acceptance rate systematically decreases, meaning it becomes more difficult for a new dislocation line to find an attractive site in the wall. In fact, if a>200b, the acceptance rate essentially goes to zero under conditions where a stable wall would form (). This means it is not possible to find a line insertion position and geometry that satisfies the MC acceptance criterion. Thus, our simulations require short-range interactions to promote wall formation. However, it is possible that other mechanisms not considered here could still enable wall formation.
Figure 2. Results from MC-DDD simulations of wall formation. (a) MC acceptance rate for different core radii a when . (b) Wall thickness (see Methods) as a function of MC step for different f and
. (c) Steady state thickness as a function of acceptance force tolerance for different long-range force cut-offs f. Curves show fit to a function of the form
. Gray regions in (b) and (c) denote when the finite simulation cell size artificially influences the wall thickness.
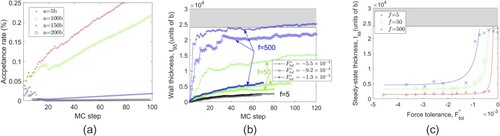
To study the influence of long-range interactions, we investigated the effect of truncating the long-range field at different lengths. We accomplished this truncation by computing the difference between each dislocation's stress field computed with core radius a and that computed with core radius fa, where f>1. Since the long-range field of a dislocation is independent of a, this scheme smoothly truncates the long-range field at a range specified by f [Citation26] (fa is like an outer cut-off radius). Figure (b) presents a set of results showing evolution of the wall thickness with three different values of f and . These results indicate that as the long-range interactions are progressively removed (as f is reduced): (1) the steady-state wall thickness is decreased, (2) sensitivity of the steady-state wall thickness on
is reduced, and (3) the critical value
increases. To more clearly illustrate these trends, we plot the steady-state wall thickness as a function of
for different values of f in Figure (c).
Collecting these results together, we see that wall formation observed in our simulations clearly analogizes with a phase transition; as is decreased, the dislocation ‘phase’ changes from a random, unbounded network (uncondensed phase) to a stable, confined wall with well-defined thickness (condensed phase). The critical value
at which this transition proceeds is analogous to the boiling point. When long-range interactions are (nearly) ‘entirely’ removed, as in the case of f = 5, the transition from the uncondensed to condensed phase is sharp. However, when long-range interactions are present, this transition becomes smeared [Citation27–29]; rather than an abrupt change in steady-state thickness, it gradually reduces to an asymptotic value as
. As f increases and more and more long-range interactions are included in the simulations, the phase transition continues to smear. Furthermore, as f increases,
decreases, meaning that the boiling point is depressed. Our results seem to indicate that in the asymptotic limit of purely short-range elastic interactions,
and
, meaning that zero-thickness walls form under infinitesimally attractive interaction forces between the dislocations in the wall.
Our studies of short- and long-range interactions lead us to conclude that wall formation is driven by attractive short-range elastic interactions, a finding that is consistent with other DDD simulations [Citation17,Citation18]. Long-range interactions, on the other hand, control the thickness of the walls and the strength of the attractive interactions that are necessary for walls to form. It is typically assumed that long-range interactions are self-screened by the dislocation network, so that the typical interaction range scales with [Citation30]. Our results thus predict that the wall thickness will decrease as the dislocation density increases since long-range interactions are attenuated, which is consistent with recent detailed transmission electron microscope measurements [Citation31].
These results elucidate fundamental aspects of wall structures, but what about the low-density cell interiors? Where do they come from and what governs their diameter? One possibility is that cells are a natural result of statistical fluctuations in the dislocation density field, as envisaged by SP. Since dislocation motion is noisy, resulting from avalanche-style slip events [Citation32,Citation33], the local dislocation density is constantly fluctuating. If a large enough fluctuation occurs resulting in a region of relatively low density, the dislocation network could locally destabilize leading to a persistent ‘hole’ which does not fill back in. In this view, cells form as a result of an instability in the network, similar to the recent theory of Zaiser, Groma, and colleagues [Citation6,Citation7,Citation16].
To quantify the potential for such instabilities, we developed a perturbation technique within DDD that allows us to initiate cell formation. In this approach, we define a spherical perturbation region of radius R centered in our simulation cell within which junction formation is suppressed. Outside this region, junctions are still able to form as usual. The binary junction suppression is accomplished using methods discussed previously by Sills et al. [Citation23]. In our simulations, the formation of these junctions is the primary mechanism for dislocation multiplication, so by locally suppressing their formation a region of low dislocation density develops with strain, as shown in Figure (c). This provides a framework for performing a perturbation analysis of dislocation networks.
We employ this perturbation technique during standard tensile test simulations. Figure (a) shows how the dislocation density inside of the perturbation region, , evolves during a DDD simulation with a box size of
, initial dislocation density of
, and various values of R. When
, we find that while the dislocation density inside the perturbation zone is lower than outside of it, the multiplication rate is nonzero. On the other hand, if
the multiplication rate inside the perturbation region is negative, indicating that the network in that region is unstable; see Figure (c) for a snapshot when
. The resulting radial dislocation density profile is shown in Figure (b) at a few strain levels, showing a sigmoidal behavior. This behavior implies that there is a critical perturbation volume of order
, above which the dislocation network becomes locally destabilized. This critical perturbation volume is set by the strengths of the dislocation junctions in the network. As the perturbation volume increases, the arms spanning the volume increase in length until no junctions are strong enough to anchor them, driving the local multiplication rate to zero.
Figure 3. Results from DDD perturbation simulations. (a) Dislocation density inside the perturbation region as a function of strain for different R values. (b) Radial dislocation density profiles with and different tensile strains, showing the development of a hole. Sigmoidal fit lines also shown. (c) Difference in dislocation density between outside and inside after removing the perturbation, showing an unstable response when
.
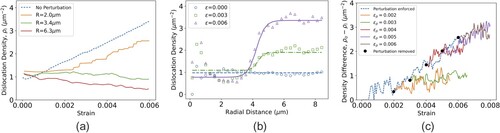
Carrying the analysis further, after some chosen amount of perturbation strain we subsequently lifted the perturbation by re-enabling junction formation, and then continued straining. This process was repeated for various levels of perturbation strain
resulting in different dislocation densities outside of the perturbation region,
. The perturbation strain here is not intended to represent an applied strain level which would induce patterning, but rather a means for quantifying the stability of the dislocation network with respect to low density fluctuations. For these reasons, we cannot directly compare the perturbation strains here to experimental strains (it is not possible to do such a perturbation analysis experimentally). In Figure (c) we plot the difference in dislocation density between the outside and inside of the perturbation region,
, as a function of strain. The dashed curve shows the behavior while the perturbation is enforced; the density difference grows continuously with strain since the cell is always present. Other curves show what happens when the perturbation is removed. When the perturbation strain is greater than 0.3% and the perturbation is lifted, the difference in dislocation density continues to grow as if the system were still being perturbed (approximately follows the dashed curve). On the other hand, when the perturbation strain is less than 0.3% the dislocation density difference saturates, indicating that the network within the perturbation region has begun to multiply: the hole is filling back in. Additional results showing similar behavior are in the Supplemental Material. This bifurcated behavior indicates that there is a critical perturbation magnitude, above which a low density region is ‘permanently’ locked in place. These results provide strong evidence supporting the notion that dislocation networks are intrinsically unstable and will naturally form regions of low density under the action of statistical fluctuations. While the levels of strain attained here are small compared with experimental strains typically associated with patterning, the dislocation density levels in our DDD simulations are in the range where cellular patterns are observed in single crystalline FCC metals [Citation34]. Hence, we believe that our assessment of dislocation network instability is directly relevant to experimentally observed patterning.
Discussion
The insight gained above provides a new window into the phenomenon of dislocation patterning, suggesting a two-stage process. First, regions of low density (holes) naturally form as a result of instabilities in plastic flow. After a region in the network is destabilized so that ‘free volume’ is liberated, dislocation lines within the low density zone are able to move more freely since they have more space around them. They are able to identify and move towards attractive regions on the periphery of the low density zone by cross-slipping to change their glide plane. The acceptance rates from our MC-DDD simulations indicate that finding such attractive regions becomes easier as the dislocation density increases, suggesting that attractive sites are easier to find at high densities. If attractive enough sites can be located, the periphery of the cell will condense into a stable wall structure. Recent work by Wu, Zaiser, and coauthors has further demonstrated that formation of low and high density regions ‘self replicates’ giving rise to a large-scale patterned structure which originates from a cell ‘nucleus’ [Citation7,Citation16]. This pictures shows how LEDS and SP mechanisms can work together to produce a cellular pattern.
While we are still far from a complete picture, the results presented herein provide unprecedented insight into the basic processes which underlie patterning obtained via discrete dislocation simulations with few assumptions and/or approximations. They reveal that dislocation networks contain several hidden length scales which are likely to influence patterns. The wall thickness is set by the elastic interactions within the network and the balance between short- and long-range stresses, and the cell size is set by the stability of the dislocation junctions which enable multiplication and govern network stability. Of course additional processes not considered here are likely to play a role. For example, many researchers have argued that cross-slip of screw dislocations is essential for patterning [Citation8,Citation17]. We have argued above that cross-slip enables dislocation lines in the free volume of a cell to find attractive spots on the cell's periphery. In other words, we believe that cross-slip plays an important role in ‘selecting’ the force tolerance value underlying wall formation. Although we did not consider cross-slip in our perturbation simulations, this should be pursued as future work. In future efforts, it may be possible to combine the two approaches employed here (MC-DDD and perturbation analysis) in a single simulation to construct a true cellular pattern. Overall, our results mechanistically reveal the synergistic roles played by energy minimization and stochastic flow in dislocation patterning. These insights could be used to design processing conditions yielding dislocation patterns with better properties, such as resistance to fatigue or irradiation damage.
Supplemental Material
Download PDF (1.2 MB)Acknowledgments
The authors thank Dr. Péter Ispánovity, Dr. Brad Boyce, and Dr. Hojun Lim for their valuable feedback on this work.
Disclosure statement
The authors declare no competing interests.
Data availability statement
After publication, all datasets associated with this work will be published at the following Data DOI:10.5281/zenodo.6470996.
Additional information
Funding
References
- Habib K, Koyama M, Tsuchiyama T, et al. Visualization of dislocations through electron channeling contrast imaging at fatigue crack tip, interacting with pre-existing dislocations. Mater Res Lett. 2018 Jan;6:61–66.
- Was GS. Fundamentals of radiation materials science. New York (NY): Springer New York; 2017.
- Martin ML, Dadfarnia M, Nagao A, et al. Enumeration of the hydrogen-enhanced localized plasticity mechanism for hydrogen embrittlement in structural materials. Acta Mater. 2019 Feb;165:734–750.
- Noell P, Carroll J, Hattar K, et al. Do voids nucleate at grain boundaries during ductile rupture? Acta Mater. 2017 Sept;137:103–114.
- Noell PJ, Sabisch JE, Medlin DL, et al. Nanoscale conditions for ductile void nucleation in copper: vacancy condensation and the growth-limited microstructural state. Acta Mater. 2020 Feb;184:211–224.
- Groma I, Zaiser M, Ispánovity PD. Dislocation patterning in a two-dimensional continuum theory of dislocations. Phys Rev B. 2016 June;93:Article ID 214110.
- Wu R, Tüzes D, Ispánovity PD, et al. Instability of dislocation fluxes in a single slip: deterministic and stochastic models of dislocation patterning. Phys Rev B. 2018 Aug;98:Article ID 054110.
- Xia S, Belak J, El-Azab A. The discrete-continuum connection in dislocation dynamics: I. Time coarse graining of cross slip. Model Simul Mater Sci Eng. 2016 Oct;24:Article ID 075007.
- Hähner P, Zaiser M. Dislocation dynamics and work hardening of fractal dislocation cell structures. Mater Sci Eng. 1999 Nov;272:443–454.
- Kuhlmann-Wilsdorf D. The theory of dislocation-based crystal plasticity. Philos Mag A. 1999 Apr;79:955–1008.
- Nabarro FRN. Complementary models of dislocation patterning. Philos Mag A. 2000 Mar;80:759–764.
- Sandfeld S, Zaiser M. Pattern formation in a minimal model of continuum dislocation plasticity. Model Simul Mater Sci Eng. 2015 Sept;23:Article ID 065005.
- Zhou Z, Zhu Y, Luo J, et al. Characterisation of dislocation patterning behaviour with a continuum dislocation dynamics model on two parallel slip planes equipped with a deep neural network resolving local microstructures. Int J Solids Struct. 2020 Aug;198:57–71.
- Hähner P, Bay K, Zaiser M. Fractal dislocation patterning during plastic deformation. Phys Rev Lett. 1998 Sept;81:2470–2473.
- Ispánovity PD, Papanikolaou S, Groma I. Emergence and role of dipolar dislocation patterns in discrete and continuum formulations of plasticity. Phys Rev B. 2020 Jan;101:Article ID 024105.
- Wu R, Zaiser M. Cell structure formation in a two-dimensional density-based dislocation dynamics model. Mater Theory. 2021 Dec;5:3.
- Devincre B, Kubin L, Lemarchand C, et al. Mesoscopic simulations of plastic deformation. Mater Sci Eng. 2001 Jul;309–310:211–219.
- Gómez-García D, Devincre B, Kubin LP. Dislocation patterns and the similitude principle: 2.5D mesoscale simulations. Phys Rev Lett. 2006 Mar;96:Article ID 125503.
- Hussein AM, Rao SI, Uchic MD, et al. Microstructurally based cross-slip mechanisms and their effects on dislocation microstructure evolution in fcc crystals. Acta Mater. 2015 Feb;85:180–190.
- Arsenlis A, Cai W, Tang M, et al. Enabling strain hardening simulations with dislocation dynamics. Model Simul Mater Sci Eng. 2007 Sept;15:553–595.
- Sills RB, Aghaei A, Cai W. Advanced time integration algorithms for dislocation dynamics simulations of work hardening. Model Simul Mater Sci Eng. 2016 May;24:Article ID 045019.
- Deka N, Sills RB. Monte Carlo-discrete dislocation dynamics: a technique for studying the formation and evolution of dislocation structures. Model Simul Mater Sci Eng. 2022 Mar;30:Article ID 024002.
- Sills RB, Bertin N, Aghaei A, et al. Dislocation networks and the microstructural origin of strain hardening. Phys Rev Lett. 2018 Aug;121:Article ID 085501.
- Harris ZD, Lawrence SK, Medlin DL, et al. Elucidating the contribution of mobile hydrogen-deformation interactions to hydrogen-induced intergranular cracking in polycrystalline nickel. Acta Mater. 2018 Oct;158:180–192.
- Cai W, Arsenlis A, Weinberger C, et al. A non-singular continuum theory of dislocations. J Mech Phys Solids. 2006 Mar;54:561–587.
- Bertin N. Connecting discrete and continuum dislocation mechanics: a non-singular spectral framework. Int J Plast. 2019 Nov;122:268–284.
- Chattopadhyay S, Ayyub P, Palkar VR, et al. Size-induced diffuse phase transition in the nanocrystalline ferroelectric PbTiO 3. Phys Rev B. 1995 Nov;52:13177–13183.
- Sknepnek R, Vojta T. Smeared phase transition in a three-dimensional Ising model with planar defects: Monte Carlo simulations. Phys Rev B. 2004 May;69:Article ID 174410.
- Hrahsheh F, Nozadze D, Vojta T. Composition-tuned smeared phase transitions. Phys Rev B. 2011 June;83:Article ID 224402.
- Cai W, Nix WD. Imperfections in crystalline solids. Cambridge: Cambridge University Press; 2016.
- Oudriss A, Feaugas X. Length scales and scaling laws for dislocation cells developed during monotonic deformation of (001) nickel single crystal. Int J Plast. 2016 Mar;78:187–202.
- Zaiser M. Scale invariance in plastic flow of crystalline solids. Adv Phys. 2006 Jan;55:185–245.
- Devincre B, Hoc T, Kubin L. Dislocation mean free paths and strain hardening of crystals. Science. 2008 June;320:1745–1748.
- Basinski SJ, Basinski ZS. Plastic deformation and work hardening. In: Nabarro F, editor. Dislocations in solids, Vol. 4. New York (NY): North-Holland; 1979.