
 ?Mathematical formulae have been encoded as MathML and are displayed in this HTML version using MathJax in order to improve their display. Uncheck the box to turn MathJax off. This feature requires Javascript. Click on a formula to zoom.
ABSTRACT
Metadislocations are novel defects recently identified in complex metallic alloys. It was reasoned that their propagation necessarily requires the orchestrated motion of hundreds of atoms along various crystallographic directions per elementary step. Here, we report on the direct observation of the motion of metadislocations on the atomic scale in the complex metallic alloy phase T-Al-Mn-Fe, using in-situ high-resolution transmission electron microscopy. We observe their propagation by discrete jumps between low-energy configurations. Using a tiling model, we determine their characteristic features including the Burgers vector, and identify their motion to take place in a mixed glide/climb process.
GRAPHICAL ABSTRACT
Impact Statement
We report on the direct in-situ observation of the motion of metadislocations in the transmission electron microscope, establishing a novel mechanism of plastic deformation in a structurally complex metallic alloy.
1. Introduction
Since several decades, quasicrystals and the related family of complex metallic alloys (CMAs), have attracted widespread research interest due to their exceptional structural and physical properties [Citation1–3]. CMAs possess a periodic complex structure with large unit cells and lattice parameters, typically ranging from one up to tens of nanometres. Their atomic structure is often related to that of quasicrystals, being based on a cluster sub-structure and featuring local 5- or 10-fold symmetry. These unusual structural features may give rise to salient mechanical properties, new mechanisms of plastic deformation, and novel defects [Citation4–6]. Indeed, a new class of salient structural defects, referred to as metadislocations (MDs), have been observed in various CMA phases including ϵ-Al–Pd–Mn [Citation4,Citation5,Citation7], Al–Pd–Fe [Citation8], Al13Co4 [Citation9–11], T-Al-Mn-Pd, and T-Al-Mn-Fe [Citation6,Citation12]. In the phase T-Al-Mn-Pd, for example, a highly complex MD-based deformation mechanism was identified [Citation6,Citation12]. MDs are partial dislocations, [Citation5] and their motion implies structural transformation in a large volume and a formation of a slab of a different complex phase in their wake. Yet, the detailed atomic mechanisms of metadislocation motion are widely unknown. Up to now, only a very limited number of tiling-based models have been employed to describe MD motion [Citation10,Citation13], which for the relatively simple case of MD motion in the phase Al13Co4 could be further developed into a three-dimensional atomic model including all involved atomic species [Citation14]. It was shown that the rearrangement of atoms within the core region leads to atomic jumps with a maximum distance of about 3 Å along various crystallographic directions, which is much shorter than the elementary glide step of 12.3 Å. So far, however, the motion of a MD in a complex alloy has never been directly observed, for instance in a TEM in-situ experiment. The available models of MD motion were never validated experimentally, not even the mechanism of motion of MDs on the unit-cell scale. All evidence for the mobility of MDs has been obtained from post-mortem investigation of plastically deformed samples. While this is pretty strong evidence it is still indirect, and it remains an open question if MDs are indeed mobile, and if MD motion contributes to plastic deformation in complex metallic alloys at all.
In this paper, we report on the direct observation of MD motion in a complex metallic alloy using in-situ transmission electron microscopy. MD Motion was observed along different crystallographic directions and individual elemental steps of motion were identified. The atomic-scale structure of the moving MD was analysed using atomic-resolution (scanning) transmission electron microscopy ((S)TEM), individual steps along the <0 0 1 > and <1 0 1 > directions by climb were identified, and a tiling model for the motion of the MD in the phase T-Al-Mn-Fe phase was developed.
2. Methods
The experiments were carried out using single crystalline T-AlMnFe CMA samples of composition Al 72 at.%, Mn 22 at.%, and Fe 6 at.% grown by the Czochralski technique (Figure S1) [Citation15]. Lamellar specimens with (0 1 0) plane normal were prepared using a focused ion beam (FIB) system and placed on MEMS chips (DENSsolutions Wildfire system) for the in-situ TEM experiments (see Figure S2). Three separate MEMS chips were prepared and subsequently three in-situ experiments were executed. The heating experiments were conducted in an image corrected FEI TITAN 80–300 and an FEI Tecnai G2 F20 microscope. The samples were oriented with their [0 1 0] direction parallel to the electron beam and the heating experiments were performed under similar conditions. All three samples were initially free of defects. During the in-situ experiments at about 600°C, the creation of dislocations and planar defects at the edges of all of the three FIB lamellae was observed (Figure S3). After the initial creation of dislocations, the temperature was set to control the speed of dislocation motion. For low-magnification observations we held the temperature above 600°C to record long-range dislocation motion at discernible velocity, while for high-resolution imaging we slowed down the dislocations by decreasing the temperature below 600°C.
Post-mortem high-resolution HAADF-STEM analysis at room temperature was performed on the in-situ heated samples in a probe-corrected FEI TITAN 80–300 employed with a high-angle annular dark field (HAADF) detector.
3. Results
Figure displays two low-magnification Bragg-contrast still micrographs taken at a time interval of 60s during an in-situ experiment at 645°C (see supplementary movie_1). Dislocations (red arrows) are seen to move towards the upper-left side, leaving behind planar defects. Also seen are bend-contrast contours (dark, almost vertical lines), which also change position due to bending of the FIB lamella during the deformation experiment. The movement of the dislocations can unambiguously be monitored via their relative position with respect to the stationary surface-contamination speckles (blue arrows). For clarity, in the 60 s frame the initial dislocation positions at t = 0s are indicated by pink arrows. An average dislocation velocity of about 0.8 nm/s was observed.
Figure 1. Bragg-contrast TEM still images of an in-situ heating experiment at 645°C showing the motion of dislocations (red arrows) trailing planar defects. The movement of the dislocations is determined by comparison of their relative positions with respect to the surface contamination speckles (blue arrows). In the 60s frame, the dislocation positions at t = 0 s are indicated by pink arrows as a guide to the eye.
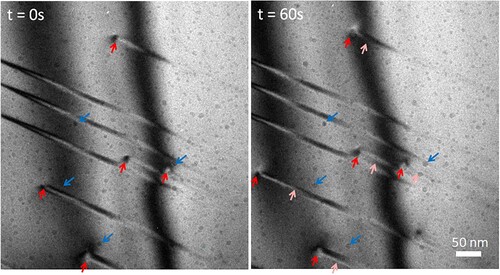
Figure presents still images from an in-situ experiment at 565°C (see supplementary movie_2) under HR-TEM conditions along the [0 1 0] direction. A corresponding fast-Fourier-transform image of a respective image of the in-situ series and an electron diffraction image of the T-AlMnFe phase sample are shown in Figure S4.
Figure 2. (a,b) High-resolution transmission electron micrograph still images of in-situ heating experiments at 565°C showing the motion of a dislocation (red arrows) along the -[0 0 1] and -[1 0 1] direction trailing planar defect segments. Previous dislocation positions are indicated by pink arrows. See supplementary movie 2 and crystallographic information in Figure S4.
![Figure 2. (a,b) High-resolution transmission electron micrograph still images of in-situ heating experiments at 565°C showing the motion of a dislocation (red arrows) along the -[0 0 1] and -[1 0 1] direction trailing planar defect segments. Previous dislocation positions are indicated by pink arrows. See supplementary movie 2 and crystallographic information in Figure S4.](/cms/asset/11bcdd35-1126-4e41-a338-4d7f8b8c7fc2/tmrl_a_2155492_f0002_oc.jpg)
We see movement of a dislocation on the unit-cell scale, trailing a planar defect with short (1 0 0) and (1 0 1) segments. For better visualisation, red and pink arrows mark the current and previous positions of the dislocation, respectively. Furthermore, the jump directions are indicated by dotted arrows. We note however that the discrete jumps are difficult to discern by looking at the still images in Figure , so we recommend to consider supplementary movie_2. Between the consecutive image frames at 0 and 0.3 s, a discrete jump of the dislocation along the -[1 0 1] direction takes place, followed by further jumps along -[1 0 1] and -[0 0 1] in the subsequent frames. The jump distances correspond to the edges and diagonals of the unit cell and occur rapidly between individual frames, i.e. faster than the frame rate of 3 s−1. The dislocations move in a jerky fashion with large fluctuations of the jump frequency at 565°C and occasional halts for several seconds or even minutes (see also supplementary movie_3). Here, an average dislocation velocity of about 0.14 nm/s was found. Backward motion was not observed.
In general, it is observed that the speed of motion varies with temperature. Therefore, the temperature was adjusted in a range between about 650 and 550°C to adapt the dislocation velocities to allow high-resolution imaging. After accumulation of some strain at later stages of the in-situ experiments, the dislocations slow down and a higher temperature is needed to maintain dislocation motion. We also observed that the dislocation velocities greatly vary in different sample areas, which most probably is a result of local variations of the stress field. Accordingly, from the current set of experiments, a more quantitative evaluation of the temperature dependence of the dislocation velocities is not feasible.
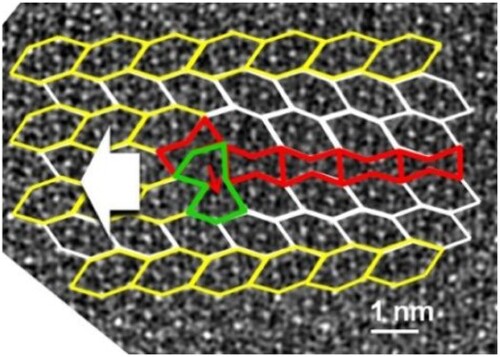
Subsequent to the in-situ experiments, the samples were cooled to room temperature, in order to investigate the very dislocations, the motion of which was previously observed as well as the planar defects created, using high-resolution HAADF-STEM imaging. A tiling representation is used to interpret the micrographs and analyse the defect structures. In Figure (a) the (100) planar defect is characterised by a parallel arrangement of hexagon tiles (white tiles) and a row of bow-tie shaped tiles (red tiles). The dislocation core is represented by a green polygon. The Burgers vector of the dislocation is determined by applying a Burgers circuit along the edges of the dislocation-core polygon [Citation5]. In a first step, a closed circuit along the edges of the polygon is performed. Second, the circuit is transferred to an unstrained tiling using ideal tiles (Figure (b)). The edges of an ideal tile correspond to vectors of a regular pentagon which can be expressed as:
(1)
(1)
where a0 is the edge length of the hexagons. The closure failure, depicted by a red arrow in Figure (b), is given by
, which yields
With the lattice constant
, the Burgers vector
of magnitude of 0.257 nm is obtained. The Burgers vector points out of the (1 0 0) and (1 0 1) planes of motion, which means that the dislocation does not move by pure glide but has a climb component.
Figure 3. (a) HAADF-STEM micrograph a dislocation associated with a (1 0 0) planar defect and corresponding tiling representation. (b) Burgers circuit around the dislocation core using unstrained tiles. The Burgers vector is represented by a red arrow. (c) HAADF-STEM micrograph of a (1 0 1) planar defect.
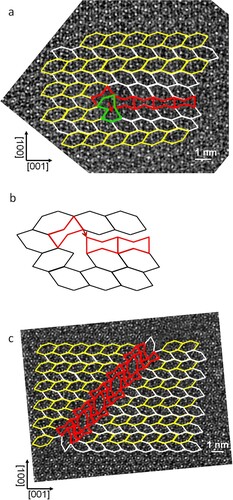
The (1 0 1) planar defect, the second faceted direction of dislocation movement, is displayed in Figure (c). The overlaid tiling representation reveals that this planar defect is described by an arrangement of bow-tie shaped tiles (red) and additional inclined hexagons.
4. Discussion
In this study, we induced the motion of linear defects with [0 1 0] line direction in-situ in single crystalline T-Al-Pd-Fe (0 1 0)-oriented FIB lamellae by thermal stress. The defects were shown to possess a Burgers vector which is a small fraction of the lattice parameter scaled by the factor τ, i.e. they are irrational partial dislocations in the structure. Upon movement, they create planar defects in their wake that can be described by a specific hexagon and bow-tie tiling representation. According to these features, we can identify the defects as MDs [Citation5]. The MDs observed in the present study have a Burgers vector not lying in the plane of motion, i.e. they move by a mixed glide/climb mode. The latter distinguishes them from MDs previously observed in T-Al-Mn-Pd and Al-Mn-Fe, which were always found to move either by pure glide or pure climb and have pure edge-character.
Previously, MDs induced by plastic deformation of T-phase Al-Mn-Pd and Al-Mn-Fe were characterised after two types of uniaxial deformation experiments. On the one hand, macroscopic compression experiments along a direction perpendicular to the [0 1 0] direction and inclined by 45° with respect to [1 0 0] and [0 0 1] led to a high resolved shear stress for glide on (1 0 0) planes along the [0 0 1] direction [Citation12]. MDs induced by this deformation experiment were identified to be of the type shown in Figure S1b, having a (x = 2, 3, 4) Burgers vector, and move by pure glide. They trail (1 0 0) planar faults which in a tiling are represented by a parallel arrangement of hexagon tiles [Citation6]. On the other hand, compression experiments along the [1 0 0] direction and perpendicular to [0 1 0] and [0 0 1] led to the formation of MDs also having a [001] Burgers vector, but moving by pure climb and trail faults consisting solely of bow-tie shaped tiles, i.e. forming (001) phason planes [Citation12].
The main difference to the previously observed MDs, in particular the occurrence of a mixed glide/climb motion, is most likely due to the different experimental deformation geometry. In macroscopic compression experiments, the compression direction is well defined along a single axis, while in the present case, in-situ heating was applied to a T-Al-Mn-Fe lamella on a SiN MEMS chip. The different thermal expansion of the sample material and the MEMS chip leads to a complex stress field in the lamella in which the MDs are created. Indeed, investigation of the FIB lamellae after the experiment revealed strong bending of the samples with local variation of the sample-plane normals of up to 20 degrees and occasional fracture of the lamellae. The lamellae are thus subjected to a strongly non-uniform stress field, including mixed compressive and bending components, i.e. a considerably different deformation geometry than in the macroscopic compression experiments reported previously. A further experimental difference to the previous experiments is the temperature range, which in the present experiments was considerably lower than in the previous experiments, as well as the presence of a very different sample geometry, i.e. the presence of a thin sample and an extended surface area, which might induce defect/surface interaction effects by extended diffusion and due to surface pinning of the dislocations.
In our in-situ experiments, we have directly observed MD motion on the unit-cell scale. To our best knowledge, this is the first time that direct motion of defects was observed in a complex metallic alloy. We observed different modes of motion at high magnification and were able to control the speed of MD motion by adjusting the temperature. At higher temperature, fast and continuous motion is observed (Figure ), while at lower temperature, discrete instantaneous jumps of the MDs along -[0 0 1] and -[1 0 1] are observed (Figure ). Heating induces strain due to thermal expansion of the sample material and the MEMS chip, so it is assumed that the speed of the MDs is controlled both by the effects of thermal activation and thermally induced local stress. Furthermore, it is very likely that additional electron-beam induced straining or heating of the sample during high resolution investigation influences the speed or direction of motion, so that variations of the direction of motion (Figure , SI movies) might include an electron-beam effect. Therefore, a consistent quantitative analysis of the temperature dependence of the MD velocities is not possible.
Individual jumps of motion along -[0 0 1] and -[1 0 1] were found to occur within short time intervals below 0.3 s, so motion of the MDs takes place in a jerky fashion on the unit cell scale. These jump distances are 4.9. and 7.5 times higher than the Burgers vector length. Apparently, the unit cell acts as a rate-controlling obstacle to the motion of the MD, which is not trivial as the unit cell is considerably larger than the Burgers vector or average interatomic distances. All incremental steps of motion, on the scale of the Burgers vector and on the atomic scale, occur too fast to be observed within the temporal resolution of the experiment, while MD movement comes to a temporary halt on the scale of the lattice constants. This allows for the conclusion that the observable structure of the MD core represents a low-energy state, while all intermediate phases of MD movement correspond to higher states of energy and as such represent the activation barrier for MD movement.
Using the tiling models introduced in Figure based on the ex-situ HAADF-STEM investigations and the results from our in-situ TEM investigations demonstrating MD jumps along the -[0 0 1] and -[1 0 1] direction, a tiling-based model of MD motion along these directions can be constructed. Figure a shows a tiling model of a dislocation trailing a (1 0 0) planar defect in its initial state (Figure (a)) and after a jump along the -[0 0 1] direction (Figure (b)). Subsequently, a jump along a -[1 0 1] direction is show (Figure (c)). Figure d1 and d2 illustrate further motion of the MD along -[0 0 1] direction and -[1 0 1], respectively. It can be noted that the (1 0 1) and (1 0 0) planar defect segments can be seamlessly connected as shown in Figure , and are both characterised by the same displacement vector of . This agrees with the observation that these defects segments are trailed by a single dislocation with the same Burgers vector, which is intermittently changing its direction of motion (see Figure and supplementary movies 2 and 3) and corresponds to our in-situ observation of individual alternate jumps along both directions (Figure S5).
Figure 4. (a) Tiling model of a dislocation trailing a (1 0 0) planar defect and sequence of motion along a -[0 0 1] direction (b) and along a -[1 0 1] direction. (d1, d2) Further motion along -[0 0 1] direction and -[1 0 1], respectively.
![Figure 4. (a) Tiling model of a dislocation trailing a (1 0 0) planar defect and sequence of motion along a -[0 0 1] direction (b) and along a -[1 0 1] direction. (d1, d2) Further motion along -[0 0 1] direction and -[1 0 1], respectively.](/cms/asset/bc8930e4-a16d-4adc-b8cb-2a935e409b52/tmrl_a_2155492_f0004_oc.jpg)
Setting up an atomic model of motion is far more complex and goes beyond the tiling model of motion discussed above. Our supplementary movies 5a and 5b are used to illustrate a single step of motion along the [0 0 1] direction using two superimposed HAADF-STEM images of the MD shown in Figure (a) shifted by one lattice constant. The animation illustrates jumps between neighbouring atomic columns within and around the MD core along various crystallographic orientations which are necessary to move the MD by one lattice constant. The large number of atoms in a unit cell and the large size of the defect suggests the involvement and the orchestrated motion of potentially several tens or even hundreds of atoms per unit cell thickness and elementary step of MD motion.
In conclusion, the creation and movement of dislocations in the complex metallic alloy T-Al-Mn-Fe was observed during in-situ heating experiments in the transmission electron microscope. The dislocations could be identified as MDs moving in a mixed glide/climb mode, and trailing (1 0 0) and (1 0 1) planar defects. The temperature during the in-situ experiments was set to control the speed of the dislocations and to allow for observation of motion at high magnification. At high magnifications, discrete jumps of MDs, faceted along the [1 0 −1] and [0 0 −1] direction are directly observed. Jumps by one unit cell occur rapidly between individual frames. No intermediate steps can be resolved, which shows that the incremental processes taking place on a length scale smaller than the unit cell represent higher states of energy and form the activation barrier of MD motion. Subsequent high-resolution STEM imaging allowed for determination of the Burgers vector and characterisation of the planar defects by an arrangement of hexagon and bow-tie shaped tiles. The MDs are found to move in a mixed mode involving glide and climb.
Supplemental Material
Download PDF (1.4 MB)Acknowledgements
The authors thank Dipl.-Ing. C. Thomas for producing the sample material and Dipl.-Ing. M. Kruth for the FIB preparation of the in-situ samples.
Disclosure statement
No potential conflict of interest was reported by the author(s).
References
- Urban K, Feuerbacher M. Structurally complex alloy phases. J Non Cryst Solids. 2004;334–335:143–150.
- Dubois J-M, Belin-Ferré E. Complex Metallic Alloys: Fundamentals and Applications. 2010.
- Dubois J-M. Properties- and applications of quasicrystals and complex metallic alloys. Chem Soc Rev. 2012;41:6760–6777.
- Klein H, Feuerbacher M, Schall P, et al. Novel type of dislocation in an Al-Pd-Mn quasicrystal approximant. Phys Rev Lett 1999;82:3468–3471.
- Feuerbacher M, Heggen M. Chapter 94 Metadislocations. In: Hirth JP, Kubin L, editor. Dislocations in solids [internet]. Elsevier; 2010 [cited 2022 Aug 18]. p. 109–170. Available from: https://www.sciencedirect.com/science/article/pii/S1572485909016039.
- Heggen M, Houben L, Feuerbacher M. Plastic-deformation mechanism in complex solids. Nat Mater. 2010;9:332–336.
- Klein† H, Feuerbacher M. Structure of dislocations and stacking faults in the complex intermetallic ξ′-(Al–Pd–Mn) phase. Philos Mag. 2003;83:4103–4122.
- Feuerbacher M, Balanetskyy S, Heggen M. Novel metadislocation variants in orthorhombic Al–Pd–Fe. Acta Mater. 2008;56:1849–1856.
- Heggen M, Houben L, Feuerbacher M. Metadislocations in the structurally complex orthorhombic alloy Al13Co4. Philos Mag. 2008;88:2333–2338.
- Heggen M, Feuerbacher M. Core structure and motion of metadislocations in the orthorhombic structurally complex alloy Al13Co4. Mater Res Lett. 2014;2:146–151.
- Korte-Kerzel S, Schnabel V, Clegg WJ, et al. Room temperature plasticity in m-Al13Co4 studied by microcompression and high resolution scanning transmission electron microscopy. Scr Mater. 2018;146:327–330.
- Heggen M, Houben L, Feuerbacher M. Metadislocations in the complex metallic alloys T–Al–Mn– (Pd, Fe). Acta Mater. 2011;59:4458–4466.
- Heggen M, Feuerbacher M. Metadislocation core structure and atomic model for metadislocation motion. Acta Mater. 2013;61:3851–3857.
- Heidelmann M, Heggen M, Dwyer C, et al. Comprehensive model of metadislocation movement in Al 13 Co 4. Scr Mater. 2015;98:24–27.
- Balanetskyy S, Meisterernst G, Heggen M, et al. Reinvestigation of the Al–Mn–Pd alloy system in the vicinity of the T- and R-phases. Intermetallics. 2008;16:71–87.