
 ?Mathematical formulae have been encoded as MathML and are displayed in this HTML version using MathJax in order to improve their display. Uncheck the box to turn MathJax off. This feature requires Javascript. Click on a formula to zoom.
ABSTRACT
Improved strength-ductility synergy is not uncommon among metallic materials with gradient structures of grains and twins. In this work, we report that the texture gradient innately created in Al-Mn strips by twin-roll casting is also capable of increasing the material’s ductility without sacrificing its strength. Analyses based on crystal plasticity theory demonstrated that the underlying mechanism of this texture-gradient-induced ductility enhancement lies in the orientation-dependent slip and grain rotation, which generate backstress, alter the local stress triaxiality, and delay the fracture process. These results advocate the integration of texture gradient design into the fabrication of high-performance gradient materials.
GRAPHICAL ABSTRACT

Impact Statement
This work demonstrates for the first time that gradient texture could ductilize Al strips. It provides a new pathway — texture gradient design — to the fabrication of advanced structural materials.
Introduction
Metallic materials with high strength and excellent ductility are the eternal pursuit of materials scientists. However, for their mutual exclusiveness, researchers have been struggling to seek a balance between the two for centuries. In the mid-twentieth century, inspired by natural materials like seashells and teeth, some genuinely proposed the concept of gradient materials [Citation1–3]. In contrast to the conventional material design, which tends to achieve homogeneity, in this new class of materials, microstructures with spatial gradients are deliberately introduced [Citation4]. The strategy, soon after its appearance, has received considerable attention and proved a success in achieving excellent strength-ductility combinations in various metals and alloys [Citation3–12].
Although the details of the underlying mechanisms may differ from one metal/alloy to another, the reported enhanced strength-ductility balance in the gradient materials is believed to originate from the constraint effect between regions/zones with distinct mechanical properties [Citation4,Citation13]. Most often, this mechanical contrast is obtained by fabricating materials with a broad distribution in grain size, ranging from a few nanometers to tens of micrometers, taking full advantage of the Hall-Petch effect [Citation14,Citation15]. The resultant wide strength gap between the fine grains and those coarse ones causes plastic incompatibility during deformation, generating backstress. This is considered responsible for the material’s enhanced strength-ductility balance [Citation3,Citation8].
Despite that in the majority of ever-reported gradient materials, grain size is the most conspicuous microstructural feature that exhibits a spatial variation, it is an idealization/simplification (although reasonable in most cases) to consider the material as being characterized purely by the grain size gradient. Actually, grain refinement occurs during physical metallurgical processes, including solidification, plastic deformation, and recrystallization. Since all these processes involve the evolution of texture and are often related to the precipitation and coarsening of second phase particles, the grain size gradient, almost without any exception, goes together with the gradient in texture and/or second phase particles (although in most publications, the latter two were not as evident therefore were ignored) [Citation16]. Recently, Cheng et al. showed in Cu that complex gradient microstructures with defects in multiple length scales provide better strength-ductility synergy than their counterpart with a single gradient feature [Citation5]. Following their logic, it is reasonable to speculate: if properly controlled, the co-existence of the grain size gradient with other microstructure gradients could offer more impressive strength-ductility improvement than does the grain size gradient alone. In this sense, twins, stacking faults, texture, and the particles could all serve as extra dimensions other than grain size when building the gradient microstructures. However, to date, the emphasis of the gradient design has been placed, in most cases, on the size of grains and the thickness/density of twins [Citation3–15,Citation17–19]. If we plot a pentagon and use its five vertices to represent the grains, twins, stacking faults, texture, and second phase particles, most previous research is limited to the corners representing grains and twins. On the contrary, the wide area close to the other three vertices (especially the one representing texture), and that in the middle of the pentagon, are somewhat untouched. This undoubtedly hinders the development of next-generation metallic materials with complex gradient structures. Thus, at this stage, it is imperative to investigate if/how the gradients in microstructural features other than grain size and twin thickness/density could affect the mechanical properties of materials.
In this work, near single-phase Al-Mn strips with millimeter-scale texture gradient but relatively homogeneous grain size distribution were prepared by an industrially feasible approach. Using a systematic microstructure characterization in combination with crystal plasticity modeling, we for the first time demonstrate that the millimeter-scale texture gradient can significantly improve the elongation of Al-Mn strips without sacrificing their strength. It provides a new pathway with industry scalability to material ductilization.
Materials and methods
Al-1.17 wt% Mn strips with a thickness of ∼8 mm were produced using a sub-rapid solidification horizontal twin-roll caster. The cooling rate was estimated to be 100∼200°C/s. The mechanical properties of the strips were evaluated by uniaxial tensile tests at room temperature. Besides the full-thickness strip, the ∼1.5 mm surface layer (named free-standing surface layer hereafter) and the ∼5 mm center layer (named free-standing center layer hereafter), both sliced from the full-thickness strip using an electrical discharge machine (EDM), were tested as control groups. All these tests were conducted on an MTS universal testing machine at 5 × 10⁻⁴ s−1 following the ASTM E8 standard. Large-area electron backscattered diffraction (EBSD) mapping (∼8.8 mm2) was performed to cover the full thickness of the strip. Nearly 300 grains in the surface region and center region of the strip were further tracked quasi-in-situ using SEM/EBSD to reveal the deformation mechanisms. The dislocation imaging was conducted at 200 kV on an FEI Talos F200s transmission electron microscope (TEM). X-ray diffraction (XRD) experiments (wavelength 0.068879 nm) were performed at beamline BL14B1 of the Shanghai Synchrotron Radiation Facility. The diffraction profiles were used to calculate the dislocation densities based on the Modified Williamson-Hall method [Citation20–23]. The geometrically necessary dislocation (GND) density was calculated based on the EBSD orientation data following Pantleon [Citation24]. The local orientation data was used to determine the five out of the nine components of the dislocation tensor, along with the difference between another two components. Based on these six (five plus one) knowns, the GND contents were extracted by linear optimization. The dislocation slip and grain rotation of the tracked grains were analyzed with the assistance of a dislocation-based viscoplastic self-consistent (VPSC) modeling [Citation25,Citation26].
Results and discussion
The full-thickness EBSD maps are displayed in Figure (a,b). The most striking feature of the present materials is the distinct texture presented by the surface region (from surface to ∼1.5 mm below) and the center region. Regarding the surface region, a shear-type texture is observed, with CubeND () and γ fiber (
//ND) being the predominant components (Figure (c)). Regarding the center region, on the other hand, typical FCC rolling texture is observed, presenting Brass (
), S (
), and Copper (
) components, together with Cube component (
) with slightly weaker intensities (Figure (d)). The fraction of shear-texture grains and β-fiber grains are plotted against the position in the strip thickness direction (ND) (Figure (e)). It is seen that with increasing distance from the surface, the volume fraction of the β-fiber grains increases continuously at the expense of that of the shear-texture grains. Unlike the obvious texture variation along the thickness direction, the grain ize profile of the Al-Mn strip is rather flat: the surface region has an equivalent diameter of ∼51 μm, which is ∼82% of that of the center region (∼62 μm) (Figure S1 in Supplementary Materials). This is in strong contrast to the cases in the literature where the center grains could be 102∼103 times as large as the surface grains [Citation3,Citation17]. Apparently, we have successfully prepared an Al-Mn strip with an evident millimeter-scale texture gradient but no obvious grain size gradient, which is suitable for this study with a focus on the effect of the former.
Figure 1. The microstructure and mechanical properties of the Al strip used in this work: (a) and (b) the full-thickness EBSD IPF map in ND and RD, respectively; (c) and (d) the ODF sections ( = 0°, 45°, 65°) for the surface region and the center region, respectively; (e) the variation in the volume fraction of texture components along ND; (f) engineering stress-strain curves along RD; (g) elongation data correction to rule out the specimen geometry effect on ductility. (h) Ashby map comparing the tensile property improvement conferred by the texture gradient (this work) and the gradient in other microstructural features. These include laminates with different grain sizes [Citation32,Citation33], laminates with different compositions and grain sizes [Citation34–37], gradient in grain size [Citation6,Citation7,Citation17,Citation38,Citation39,Citation40]; gradient in grain size and twin fraction/thickness [Citation5,Citation11]. In (g),
,
, and
represent the gauge length, width, and thickness of the tensile specimen, respectively. The upper bound and lower bound of the n value (−0.2 and −0.3) are determined based on Al-Mn plates with homogeneous microstructures (Figure S2 in Supplementary Materials). In (h), the gradient/laminate materials’ UTS are normalized by the UTS of the ‘hard phase’. The total elongation of the gradient/laminate materials is normalized by the total elongation of the ‘soft/ductile phase’.
![Figure 1. The microstructure and mechanical properties of the Al strip used in this work: (a) and (b) the full-thickness EBSD IPF map in ND and RD, respectively; (c) and (d) the ODF sections (φ2 = 0°, 45°, 65°) for the surface region and the center region, respectively; (e) the variation in the volume fraction of texture components along ND; (f) engineering stress-strain curves along RD; (g) elongation data correction to rule out the specimen geometry effect on ductility. (h) Ashby map comparing the tensile property improvement conferred by the texture gradient (this work) and the gradient in other microstructural features. These include laminates with different grain sizes [Citation32,Citation33], laminates with different compositions and grain sizes [Citation34–37], gradient in grain size [Citation6,Citation7,Citation17,Citation38,Citation39,Citation40]; gradient in grain size and twin fraction/thickness [Citation5,Citation11]. In (g), l0, w0, and t0 represent the gauge length, width, and thickness of the tensile specimen, respectively. The upper bound and lower bound of the n value (−0.2 and −0.3) are determined based on Al-Mn plates with homogeneous microstructures (Figure S2 in Supplementary Materials). In (h), the gradient/laminate materials’ UTS are normalized by the UTS of the ‘hard phase’. The total elongation of the gradient/laminate materials is normalized by the total elongation of the ‘soft/ductile phase’.](/cms/asset/64a76013-c8c2-422c-b0b6-9e97d96747c2/tmrl_a_2178861_f0001_oc.jpg)
Figure (f) shows the stress–strain curves for the full-thickness strip together with that of the two free-standing layers (surface and center) cut from it. The mechanical properties of the three specimens are listed in Table . Due to the fact that the three types of tensile specimens in this work have different thicknesses (∼1.5, ∼5, and ∼8 mm) and that the specimen geometry could affect the total elongation, the measured elongation data was corrected by Oliver’s formula [Citation27] and Barba’s equation [Citation28] to rule out the effect of specimen geometry (Readers are referred to the Supplementary Materials for more information about the procedure and accuracy of this data correction process). The corrected data, given in Figure (g) and Table , represents the elongation of the free-standing layers should they have the same specimen geometry as the full-thickness specimen. It is seen that while the full-thickness specimen presents only a marginally higher UTS and a yield strength somewhere between the values of the two free-standing layers, its elongation (more specifically, the post-uniform elongation) does increase dramatically. This indicates that the texture gradient could provide extra ductilization to the strips without sacrificing their strength. Given the general correlation between the post-uniform elongation and local formability, the texture gradient should benefit the strip’s subsequent forming/machining processes, including bending, punching, and drilling [Citation29–31].
Table 1. Tensile properties of the full-thickness strip and the free-standing layers.
Usually, heterogeneous-structured materials exhibit a ductility not greater than that of their soft domain (Figure (h)) [Citation6–12,Citation17,Citation32–40]. However, a couple of publications (though very rare) do show that the former could have slightly higher uniform elongation compared to the latter [Citation10,Citation33]. The enhancement conferred by the gradient structure in these works is attributed to the backstress that upturns/elevates the decreasing strain hardening rate, which postpones their intersection with the stress–strain curves and delays the onset of plastic instability. At first glance, this seems a plausible explanation as well for the observed ductility improvement achieved here. However, on the second thought, its applicability should be doubted. The bases for the doubt are two: first, in the literature, the elongation improvement reported refers to the uniform elongation [Citation10,Citation33], whereas in this study it is the post-uniform elongation and the total elongation that increase; second, in the literature, the strength/hardness of the surface is usually significantly larger than that of the center [Citation5,Citation6,Citation10,Citation33], but the surface grains and the center grains in the present Al-Mn strip exhibit approximately the same strength. The discrepancies suggest new ductilization mechanisms.
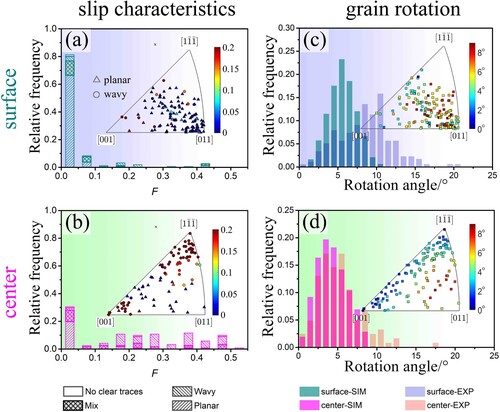
To unravel the underlying physics of the ductilization, we tracked the grains’ morphology and orientation in the surface and center regions using SEM/EBSD. By measuring the size evolution of the tracked areas, we found that the two areas experienced approximately identical shape changes (both ∼0.16 along RD), indicating no obvious strain partitioning between them. This is consistent with the similar strength of the two free-standing layers (Figure (f)). However, note that despite the same strain, the two regions exhibit drastically different slip trace morphology. In the surface region, for example, straight parallel traces are prevalent, and in most cases, they agree with the predictions given by Schmid law (Figure (c–e)). In the center region, by contrast, the grain surface morphology is characterized by wavy traces that even cannot be identified with confidence (Figure (c–e)). The difference in slip trace morphology was further confirmed by the TEM dislocation imaging (Figures (f) and (f)), demonstrating that while extensive cross slips occur in the center grains, most slips in the surface grains are in a planar fashion. Besides the slip characteristics, the grains in the two regions also show dissimilar rotation activities. As revealed in Figures and (g), at , the average grain rotation angle of the surface region is nearly twice as large as that of the center region.
Figure 2. Typical area tracked in the surface region: (a) EBSD RD-IPF map at = 0; (b) EBSD RD-IPF map at
= 0.16; (c) surface morphology under SEM (mosaic of ∼150 SEM images with an overlap of ∼25%); (d) magnified SEM image showing planar slip traces at
= 0.16 in the area highlighted by the white rectangles in (a) and (b); (e) planar slip traces in a representative grain; (f) dislocation image under TEM, zone axis
,
; (g) Statistics on grain rotation angles during tension (from
= 0 to
= 0.16). The blue line and the red arrow in (e) represent the calculated slip trace and the slip direction. The Schmid factors (SF) of the slip systems are given under the corresponding cubes.
![Figure 2. Typical area tracked in the surface region: (a) EBSD RD-IPF map at ϵp = 0; (b) EBSD RD-IPF map at ϵp = 0.16; (c) surface morphology under SEM (mosaic of ∼150 SEM images with an overlap of ∼25%); (d) magnified SEM image showing planar slip traces at ϵp = 0.16 in the area highlighted by the white rectangles in (a) and (b); (e) planar slip traces in a representative grain; (f) dislocation image under TEM, zone axis ≈[110], g=[1¯11¯]; (g) Statistics on grain rotation angles during tension (from ϵp = 0 to ϵp = 0.16). The blue line and the red arrow in (e) represent the calculated slip trace and the slip direction. The Schmid factors (SF) of the slip systems are given under the corresponding cubes.](/cms/asset/641b4dc9-b5ee-490b-b746-0b617a23ce96/tmrl_a_2178861_f0002_oc.jpg)
Figure 3. Typical area tracked in the center region: (a) EBSD RD-IPF map at = 0; (b) EBSD RD-IPF map at
= 0.16; (c) surface morphology under SEM (mosaic of ∼150 SEM images with an overlap of ∼25%); (d) magnified SEM image showing wavy slip traces at
= 0.16 in the area highlighted by the white rectangles in (a) and (b); (e) wavy slip traces in a representative grain; (f) dislocation image under TEM, zone axis
,
; (g) Statistics on grain rotation angles during tension (from
= 0 to
= 0.16).
![Figure 3. Typical area tracked in the center region: (a) EBSD RD-IPF map at ϵp = 0; (b) EBSD RD-IPF map at ϵp = 0.16; (c) surface morphology under SEM (mosaic of ∼150 SEM images with an overlap of ∼25%); (d) magnified SEM image showing wavy slip traces at ϵp = 0.16 in the area highlighted by the white rectangles in (a) and (b); (e) wavy slip traces in a representative grain; (f) dislocation image under TEM, zone axis ≈[110], g=[1¯11¯]; (g) Statistics on grain rotation angles during tension (from ϵp = 0 to ϵp = 0.16).](/cms/asset/77c98aae-2843-4cc1-a274-6fa176e787ac/tmrl_a_2178861_f0003_oc.jpg)
Then, there come two questions. First, what causes the distinction in deformation mechanisms between the two regions? Second, how does this difference contribute to the ductility enhancement? Usually, the slip characteristics are affected by stacking fault energy, solute clusters, and nanoprecipitates [Citation41–44]. However, in the present Al-Mn strip, the variation of all these features along ND is subtle (if nonnegligible). Thus, they are unlikely responsible for the drastically different slip behaviors in the two regions. Instead, the distinct deformation behavior should originate from the texture gradient. The orientation-dependent slip characteristics have been reported earlier that they can be easily understood by imagining two double-slip single crystals [Citation45–47]. Assuming the two crystals have exactly the same properties except for their orientations, then the crystal oriented favorably for two collinear slip systems (forming a potential cross slip system pair) would be more likely to exhibit wavy slip patterns than its counterpart with an orientation that favors two coplanar slip systems. To analyze more complex situations in polycrystals where multi-slip occurs, we construct an orientation factor (a function of dislocation activity) to describe the grain orientation effect on the slip characteristics. Due to the limited space , readers are referred to Supplementary Materials for the details about this factor and the crystal plasticity modeling performed to determine its values. Here we only point out that a greater
means, geometrically, the grain is more favorable to develop wavy slip patterns. Figure (a,b) show the distribution of
for the surface and the center region of the strip, respectively. Compared to the grains in the surface region, more center grains have orientations close to the
and
corners. These grains have higher
values that promote the development of wavy slip patterns. By contrast, in the surface region, as most grains locate either near the
corner or in the center of the triangle, they have rather low
values and thus deform primarily via planar slip. Figure (c,d) show the grain rotation angle distribution predicted by the crystal plasticity simulation. Although the rotation angles are underestimated (particularly for the surface grains), the simulation satisfactorily reproduces the experimental results that the grains in the center region rotate less than those in the surface region (Figures and (g)). This confirms that different grain rotations in the two regions, similar to the distinct slip characteristics, are again the result of different textures.
Figure 4. Analysis of the distinct deformation mechanisms in the surface region and the center region: (a) and (b) the correlation between the slip characteristics, the factor , and the grain orientation; (c) and (d) the correlation between the rotation angle and the grain orientation. (a) and (c) correspond to the surface region, (b) and (d) the center region. Note that (a) and (b) were plotted based on the orientations and slip characteristics of the tracked grains determined experimentally. For clarity, the grains showing mixed slip patterns are included in the bar chats but not in the IPFs. (c) and (d) were plotted based on crystal plasticity modeling considering 10,000 grains generated from the measured ODFs. For easy comparison, the grain rotation angles measured experimentally were also included in the bar charts.
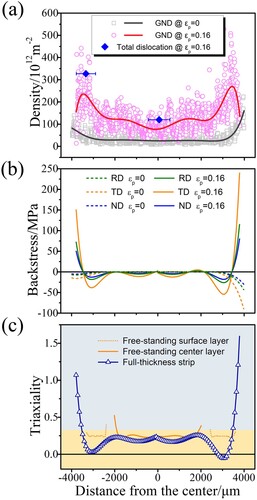
The dissimilar slip and grain rotation behaviors should induce plastic incompatibility between the two regions. This is evidenced by the EBSD orientation-based GND density profile derived following Pantleon’s treatment [Citation24]. From Figure (a), it can be seen that upon loading, large numbers of GNDs accumulated near the interface between the surface region and the center region. It suggests that even with approximately equal strength and thus no obvious strain partitioning, as long as two regions exhibit distinct textures, they could deform in a highly heterogeneous way and induce mutual constraints. According to the gradient strain theory, when the GNDs are inhomogeneously distributed, the gradient of GND density would give rise to backstresses. Bayley [Citation48] and Li et al. [Citation49] have derived the equations that relate the GND density gradient to the corresponding backstress tensor components. Using their method, the backstress variation along ND can be estimated with the GND density profile provided in Figure (a). As shown in Figure (b), the GND profile produces compressive backstress in most places in the full-thickness strip except for the top and bottom surfaces, which are separated from the strip center by a wide high-compressive-backstress zone. Note that although the local backstress at the strip surface reaches over 100 MPa, by integrating the backstress profile along ND, the sample-level Von-Mises backstress of the full-thickness strip is estimated to be only ∼12 MPa. This agrees with our observation that the full-thickness strip shows no apparent hysteresis loop on the stress–strain curves during loading-unloading-reloading experiments. It also explains why the full-thickness strip exhibits no measurable improvement in strength and uniform elongation. An interesting finding of this research is that despite the Al-Mn strips’ negligible sample-level Von-Mises backstress compared to that reported by Wu et al. [Citation7] and Huang et al. [Citation36], the texture-gradient-induced local backstress in the Al-Mn strips is large enough to influence the local stress state and alters the local triaxiality. As shown in Figure (c), in most places, the triaxiality of the material is reduced to less than 0.33, indicating enhanced local ductility compared to the ideal uniaxial tensile stress state. Moreover, there develop two low-triaxiality regions next to the surface, corresponding to the two high-compressive-backstress zones. With these buffer zones on both sides, we speculate that when a microcrack nucleates near the surface (with high triaxiality), its propagation in ND could be decelerated/arrested. This should be why the full-thickness strip exhibits a significantly improved post-uniform elongation compared to its free-standing counterparts.
Figure 5. The influence of the texture-gradient-induced heterogeneous deformation on the ductility of the strip: (a) GND density distribution along ND (measured by EBSD); (b) backstress distribution along ND; (c) local triaxiality distribution along ND. The total dislocation densities (measured by synchrotron XRD) at different depths of the strip are included in (a) for reference.
Before concluding this section, it is worth mentioning that the TRC process in this study is not yet specifically optimized. We expect the strip’s ductility to be further enhanced by tailoring the texture gradient, provided the TRC casting defects such as center segregation can be effectively controlled. Accordingly, future work in this area should focus on the simultaneous achievement of texture gradient modification and defect elimination in advanced Al alloys.
Summary and conclusions
The gradient texture produced in Al-Mn strips by TRC is capable of improving the ductility (more specifically, the post-uniform ductility) of the material without sacrificing its strength. The enhanced ductility is likely to originate from the orientation-dependent slip and grain rotation: while the surface grains with shear textures were usually associated with planar slip and large rotation angles, those in the center, with rolling textures, displayed wavy slip patterns and rotated less during tension. The texture-induced deformation incompatibility generates backstress that decreases the local triaxiality in most places of the strip, in particular for places near the ‘interface’ bordering the surface region and the center region. This modification in local triaxiality is believed to be responsible for the texture-gradient-induced extra ductilization. The finding suggests that integrating texture gradient design into the fabrication of current materials could be a promising strategy to achieve better strength-ductility synergy.
Supplemental Material
Download MS Word (546.8 KB)Acknowledgements
This work was supported by the International Joint Laboratory for Micro/Nano Manufacturing and Measurement Technologies. Staff members at Beamline BL14B1, Shanghai Synchrotron Radiation Facility, are acknowledged for providing beam time and assistance during the XRD experiments. Dr. Jianfeng Wang from General Motors and Mr. Chongle Zhang at XJTU are acknowledged for the fruitful discussions. Boyu Pang is acknowledged for data visualization and proof-reading. Besides, the authors would like to express their gratitude to Dr. Fuxue Yan at XAUT and Wei Wang at XJTU for their help with the electron microscopes, and to Dr. Carlos Tomé at Los Alamos National Laboratory for sharing the VPSC 7d code.
Disclosure statement
No potential conflict of interest was reported by the author(s).
Additional information
Funding
References
- Hughes D, Hansen N. Graded nanostructures produced by sliding and exhibiting universal behavior. Phys Rev Lett. 2001;87(13):135503.
- Suresh S. Graded materials for resistance to contact deformation and damage. Science. 2001;292(5526):2447–2451.
- Wu X, Jiang P, Chen L, et al. Extraordinary strain hardening by gradient structure. Proc Natl Acad Sci U S A. 2014;111(20):7197–7201.
- Ma E, Zhu T. Towards strength–ductility synergy through the design of heterogeneous nanostructures in metals. Mater Today. 2017;20(6):323–331.
- Cheng Z, Zhou H, Lu Q, et al. Extra strengthening and work hardening in gradient nanotwinned metals. Science. 2018;362:6414.
- Wang YF, Wang MS, Fang XT, et al. Extra strengthening in a coarse/ultrafine grained laminate: role of gradient interfaces. Int J Plast. 2019;123:196–207.
- Wu X, Jiang P, Chen L, et al. Synergetic strengthening by gradient structure. Mater Res Lett. 2014;2(4):185–191.
- Yang M, Pan Y, Yuan F, et al. Back stress strengthening and strain hardening in gradient structure. Mater Res Lett. 2016;4(3):145–151.
- Huang H, Wang Z, Lu J, et al. Fatigue behaviors of AISI 316L stainless steel with a gradient nanostructured surface layer. Acta Mater. 2015;87:150–160.
- Hasan MN, Liu YF, An XH, et al. Simultaneously enhancing strength and ductility of a high-entropy alloy via gradient hierarchical microstructures. Int J Plast. 2019;123:178–195.
- Chen G, Qiao JW, Jiao ZM, et al. Strength-ductility synergy of Al0.1CoCrFeNi high-entropy alloys with gradient hierarchical structures. Scr Mater. 2019;167:95–100.
- Fu Z, MacDonald BE, Li Z, et al. Engineering heterostructured grains to enhance strength in a single-phase high-entropy alloy with maintained ductility. Mater Res Lett. 2018;6(11):634–640.
- Wu H, Fan G. An overview of tailoring strain delocalization for strength-ductility synergy. Prog Mater Sci. 2020;113:100675.
- Lee HH, Yoon JI, Park HK, et al. Unique microstructure and simultaneous enhancements of strength and ductility in gradient-microstructured Cu sheet produced by single-roll angular-rolling. Acta Mater. 2019;166:638–649.
- Lu X, Zhang X, Shi M, et al. Dislocation mechanism based size-dependent crystal plasticity modeling and simulation of gradient nano-grained copper. Int J Plast. 2019;113:52–73.
- Zhu Y, Ameyama K, Anderson PM, et al. Heterostructured materials: superior properties from hetero-zone interaction. Mater Res Lett. 2021;9(1):1–31.
- Fang T, Li W, Tao N, et al. Revealing extraordinary intrinsic tensile plasticity in gradient nano-grained copper. Science. 2011;331(6024):1587–1590.
- Wu X, Zhu Y. Heterogeneous materials: a new class of materials with unprecedented mechanical properties. Mater Res Lett. 2017;5(8):527–532.
- Cheng Z, Bu L, Zhang Y, et al. Unraveling the origin of extra strengthening in gradient nanotwinned metals. Proc Natl Acad Sci U S A. 2022;119:3.
- Ungár T, Ott S, Sanders P, et al. Dislocations, grain size and planar faults in nanostructured copper determined by high resolution X-ray diffraction and a new procedure of peak profile analysis. Acta Mater. 1998;46(10):3693–3699.
- Williamson G, Smallman R. Dislocation densities in some annealed and cold-worked metals from measurements on the X-ray Debye-Scherrer spectrum. Philos Mag. 1956;1(1):34–46.
- He B, Hu B, Yen H, et al. High dislocation density–induced large ductility in deformed and partitioned steels. Science. 2017;357(6355):1029–1032.
- Wang M, Xu XY, Wang HY, et al. Evolution of dislocation and twin densities in a Mg alloy at quasi-static and high strain rates. Acta Mater. 2020;201:102–113.
- Pantleon W. Resolving the geometrically necessary dislocation content by conventional electron backscattering diffraction. Scr Mater. 2008;58(11):994–997.
- Lebensohn R, Tomé C. A self-consistent anisotropic approach for the simulation of plastic deformation and texture development of polycrystals: application to zirconium alloys. Acta Metall Mater. 1993;41(9):2611–2624.
- Beyerlein IJ, Tomé CN. A dislocation-based constitutive law for pure Zr including temperature effects. Int J Plast. 2008;24(5):867–895.
- Oliver D. Proposed new criteria of ductility from a new law connecting the percentage elongation with size of test-piece. Proc Inst Mech Eng. 1928;115(1):827–864.
- Mathew M, Mannan S, Rodriguez P. Influence of gage dimensions on elongation values for type 316 stainless steel. J Test Eval. 1985;13(3):191–195.
- Hatakeyama K, Sugawara A, Tojyo T, et al. Factors affecting bend formability of tempered copper alloy sheets. Mater Trans. 2002;43(11):2908–2912.
- Kupke A, Barnett M, Luckey G, et al. Determination of the bendability of ductile materials. IOP Conf Ser Mater Sci Eng. 2018;418:0012077.
- Gong Y, Wu Y, Hua M, et al. Influence of processing factors on the sheared-edge formability of vanadium bearing dual-phase steels produced using continuous galvanizing line simulations. J Mater Sci. 2020;55(13):5639–5654.
- Li D, Fan G, Huang X, et al. Enhanced strength in pure Ti via design of alternating coarse- and fine-grain layers. Acta Mater. 2021;206:116627.
- Wu X, Yang M, Yuan F, et al. Heterogeneous lamella structure unites ultrafine-grain strength with coarse-grain ductility. Proc Natl Acad Sci U S A. 2015;112(47):14501–14505.
- Huang CX, Wang YF, Ma XL, et al. Interface affected zone for optimal strength and ductility in heterogeneous laminate. Mater Today. 2018;21(7):713–719.
- Ojima M, Inoue J, Nambu S, et al. Stress partitioning behavior of multilayered steels during tensile deformation measured by in situ neutron diffraction. Scr Mater. 2012;66(3-4):139–142.
- Huang M, Xu C, Fan G, et al. Role of layered structure in ductility improvement of layered Ti-Al metal composite. Acta Mater. 2018;153:235–249.
- Ma XL, Huang CX, Xu WZ, et al. Strain hardening and ductility in a coarse-grain/nanostructure laminate material. Scr Mater. 2015;103:57–60.
- Wang Y, Wei Y, Zhao Z, et al. Activating dispersed strain bands in tensioned nanostructure layer for high ductility: the effects of microstructure inhomogeneity. Int J Plast. 2022;149:103159.
- Wang Y, Huang C, Li Y, et al. Dense dispersed shear bands in gradient-structured Ni. Int J Plast. 2020;124:186–198.
- Cao R, Yu Q, Pan J, et al. On the exceptional damage-tolerance of gradient metallic materials. Mater Today. 2020;32:94–107.
- Hong SI, Laird C. Mechanisms of slip mode modification in F.C.C. solid solutions. Acta Metall Mater. 1990;38(8):1581–1594.
- Pierce DT, Jiménez JA, Bentley J, et al. The influence of stacking fault energy on the microstructural and strain-hardening evolution of Fe–Mn–Al–Si steels during tensile deformation. Acta Mater. 2015;100:178–190.
- Neeraj T, Mills M. Short-range order (SRO) and its effect on the primary creep behavior of a Ti–6wt.%Al alloy. Mater Sci Eng A. 2001;319-321:415–419.
- Csontos AA, Starke EA. The effect of inhomogeneous plastic deformation on the ductility and fracture behavior of age hardenable aluminum alloys. Int J Plast. 2005;21(6):1097–1118.
- Wang Z. Cyclic deformation response of planar-slip materials and a new criterion for the wavy-to-planar-slip transition. Philos Mag. 2004;84(3-5):351–379.
- Gutierrez-Urrutia I, Raabe D. Dislocation and twin substructure evolution during strain hardening of an Fe–22wt.% Mn–0.6wt.% C TWIP steel observed by electron channeling contrast imaging. Acta Mater. 2011;59(16):6449–6462.
- Li P, Li SX, Wang ZG, et al. Unified factor controlling the dislocation evolution of fatigued face-centered cubic crystals. Acta Mater. 2017;129:98–111.
- Bayley C, Brekelmans W, Geers M. A comparison of dislocation induced back stress formulations in strain gradient crystal plasticity. Int J Solids Struct. 2006;43(24):7268–7286.
- Li J, Weng GJ, Chen S, et al. On strain hardening mechanism in gradient nanostructures. Int J Plast. 2017;88:89–107.