
 ?Mathematical formulae have been encoded as MathML and are displayed in this HTML version using MathJax in order to improve their display. Uncheck the box to turn MathJax off. This feature requires Javascript. Click on a formula to zoom.
Abstract
We report that hardness-to-strength ratio is not correlated with plastic Poisson's ratio in nanoporous gold, arguing against the Shaw–Sata relation. Instead, the hardness-to-strength ratio of nanoporous gold increases consistently with increasing rate of strain hardening. Furthermore, in samples with near-zero hardening in compression, the hardness-to-strength ratio does not deviate much from 1.0 when the plastic Poisson's ratio increases up to 0.27, echoing Miller's simulation. Current study suggests that the hardness-to-strength ratio is not a restraint factor, but an indicator of the strain hardening rate for nanoporous gold, which might apply to other porous materials with low-to-medium relative densities.
IMPACT STATEMENT
A widely used correlation between the hardness-to-strength ratio and the plastic Poisson's ratio is invalid in nanoporous gold; instead, its hardness is sensitive to the strain hardening in compression.
1. Introduction
Indentation hardness (H) of a low-density foam or porous material is about equal to its yield strength () in compression, i.e.
[Citation1–5], unlike fully dense solids which usually show
[Citation6–8]. The distinct difference between two materials lies in their compressibility, which is quantified by the plastic Poisson's ratios (
), i.e. the negative ratio of transverse to longitudinal strain. Fully dense solids are incompressible (
) and show lateral expansion while plastically deformed under compression. Thus plastic deformation underneath indenter of a fully dense solid is constrained by its surroundings, leading to the lateral spread of plastic zone and thus
[Citation7]. On the contrary, low-density porous materials with vanishing
do not expand laterally when plastically deformed in compression [Citation1–4,Citation9]. In consequence, the plastic zone underneath indenter is not constrained by its surroundings, making the hardness test like a uniaxial compression test, and giving rise to
. Thus
is often considered as a restraint factor, which varies between 1 and 3 as
increases from 0 to 0.5 [Citation1]. By plotting the data of foamed polystyrene, porous Al (with or without paraffin-filling) and mild steel, Shaw and Sata [Citation1] proposed that
increases rapidly and then levels off with increasing
, as displayed in Figure . It suggests a strong
-dependence of
in the samples with low-to-medium
, which often correspond to porous materials with low-to-medium relative densities. This empirical relation has been widely accepted and used in the community of porous [Citation1,Citation3] and nanoporous [Citation10–13] materials.
Figure 1. Correlations between a hardness-to-strength ratio and a plastic Poisson's ratio, showing the Shaw–Sata relation [Citation1] and the Miller's curve [Citation14].
![Figure 1. Correlations between a hardness-to-strength ratio and a plastic Poisson's ratio, showing the Shaw–Sata relation [Citation1] and the Miller's curve [Citation14].](/cms/asset/ba75de2c-40ca-4cd4-8d85-f5ab538d2732/tmrl_a_2181717_f0001_oc.jpg)
It should be noted that Shaw–Sata relation was developed without considering rate of strain hardening (θ) under compression. This issue may be irrelevant for low-density porous materials (), whose
is vanishingly small and θ is nearly zero. But for porous materials with a medium-to-high relative density and a non-zero θ, the flow stress may increase with increasing strain under compression. Under this circumstance, the indentation pressure or hardness, which reflects flow stress within the plastic zone underneath indenter, could be way in excess of its yield strength even if a constraint effect is absent. In other words,
may also increase with increasing θ. From this point of view, the
correlation proposed by Shaw and Sata [Citation1] needs to be revisited by ruling out the θ contributions.
Using finite element (FE) simulation, Miller [Citation14] modeledan indentation of porous materials with zero-θ and found that the remains nearly constant at 1.0 when
varies between 0 and 0.25, and then increases rapidly towards 3 as the
increases further and approaches 0.50, as also shown in Figure . In contrast to the widely accepted Shaw–Sata relation [Citation1], Miller's simulation suggests that indentation hardness is insensitive to
in porous materials with low-to-medium
, and the deviation of
from 1.0 in these materials may result from the factors such as strain hardening (nonzero-θ), but not necessarily the lateral restraint arising from a nonzero-
. However,
and θ usually increase simultaneously with increasing relative density in conventional porous materials [Citation15–18], making it challenging to experimentally verify or test the validity of above-mentioned
correlations.
In this paper, we report that the θ- and effects on
can be decoupled by testing coarse-grained nanoporous gold, whose θ (but not
) decreases even vanishes with increasing relative density according to a recent study [Citation19]. Our results argue against Shaw–Sata relation [Citation1], but support Miller's simulation [Citation14], and suggest that hardness is controlled by strain hardening and insensitive to the plastic Poisson's ratio for nanoporous gold (and probably other porous materials as well) with low-to-medium relative densities.
2. Experimental methods
Precursor alloys with nominal compositions of AuAg
(
at.%) and AuAl
were prepared by arc-melting (MAM-1, Edmund Bühler) of high-purity Au, Ag and Al (>99.99 wt.
, China National Gold Group Co., Ltd.) in the Ar atmosphere. Coarse-grained nanoporous gold (CG-NPG-x) was fabricated by dealloying [Citation20,Citation21] or selective dissolution of Ag from Au
Ag
, while nanocrystalline nanoporous gold (NC-NPG) was dealloyed from Al
Au [Citation22]. Some NPGs were annealed for coarsening. More details of sample synthesis can be found in the supplementary materials.
Scanning electron microscope (SEM) imaging was performed on an FEI Verios 460 under an operating voltage of 5 kV, which is equipped with an energy-dispersive X-ray spectroscopy (EDS, Oxford Instruments X-max 150). Electron backscatter diffraction (EBSD) was conducted on FEI Nano SEM Nova 430 using an HKL technology channel 5 EBSD system, under an operating voltage of 20 kV, a working distance of 9.8 mm, and with a step size of 50 nm. Transmission electron microscopy (TEM) was performed on FEI Talos F200X TEM at an accelerating voltage of 200 kV. Procession electron diffraction (PED) was performed on Tecnai G2 F20 TEM with a NanoMEGAS ASTAR system, operating at 200 kV.
Uniaxial mini-compression tests were performed on Shimadzu AG-X 10kN, with force accuracy of and cross-head displacement accuracy of 0.01 mm, at 10
s
. Microcolumns with diameter of ∼15 μm and a height-to-diameter of ∼2 were machined (from CG-NPG-37) by focus ion beam (FEI Helios Nanolab 650), and compressed using a flat diamond punch tip in SEM (SUPRA 55 SAPPHIRE) at
s
. Vickers microhardness was measured using Qness Q10A+ under loads of 0.002 kgf for CG-NPG-25 and 0.005 kgf for other NPGs, with a dwell time of 10 s. Under this circumstance, the indent size (20–50 μm diagonally) is several orders of magnitude larger than porous structure size of NPGs in this study, so that the indentation size effect, i.e. the increase of hardness below a critical indentation depth (or size) as observed in nanoindentation of NPG [Citation23], can be ruled out here [Citation5]. For most materials, Vickers hardness is comparable to Brinell hardness [Citation24]—the latter was used in analysis of Shaw-Sata relation and Miller's simulations.
3. Results and discussion
The microstructure of CG- and NC-NPGs
CG-NPG-x dealloyed from AuAg
precursors show an open uniform nanoporous structure, with small ligament sizes (L: 30–60 nm) as shown in an SEM image in Figure (a), and concurrently large grain sizes (10–100 μm) as revealed by an EBSD image in Figure (b). The relative density φ of as-dealloyed CG-NPGs varies between 0.27 and 0.44, depending on x. Annealing of CG-NPG-35 at 600
C for 0.5 h can enhance L up to 700 nm, while its relative density (φ≈0.36) and grain size remain almost unchanged.
Figure 2. (a) A typical SEM image and (b) an EBSD map (inverse pole figure) of CG-NPG-35. (c) A TEM image and (d) a PED orientation map of the same region of NC-NPG.
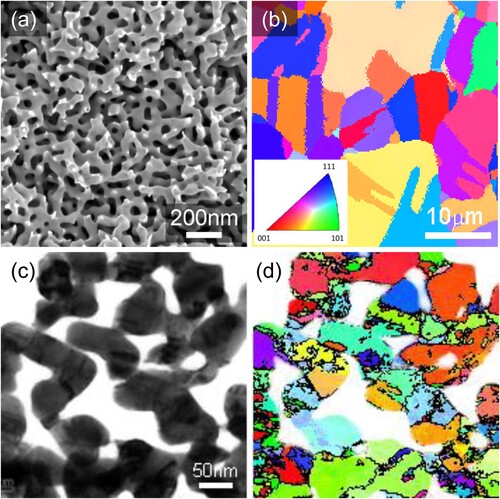
NC-NPG dealloyed from AuAl also shows an open nanoporous structure, as revealed by a TEM image in Figure (c), with L ≈ 45 nm and
0.32. Figure (d) shows that its grain size is equivalent to the ligament size—this relation is maintained in annealed samples because the ligament and grain sizes increase simultaneously in the annealing. Unlike CG-NPGs, the NC-NPG shows slow coarsening but severe sintering (driven by grain boundary diffusion) in annealing. The annealing of NC-NPG at 600
C for 0.5 h increases L from 45 to 99 nm and φ from 0.32 to 0.45.
The compression behaviors of CG- and NC-NPGs
Compression of as-dealloyed CG-NPG-x (see Figure a) reveals that the yield strength increases with increasing φ, which is consistent with previous observations in other porous materials. However, in the compression curves of CG-NPGs, a stress plateau is absent at low φ and starts to emerge at higher φ, leading to a decrease of θ with increasing φ, which is opposite to that of conventional porous materials [Citation3,Citation4]. This anomalous behavior, which is associated with a transition from homogeneous to localized deformation with increasing φ in CG-NPG as explained in more details in Ref. [Citation19], provides an opportunity to decouple -effect from θ-effect on indentation hardness.
Figure 3. Engineering stress–strain () curves of (a) the as-dealloyed CG-NPG, (b) the annealed CG-NPG-35 and (c) the NC-NPGs under compression. L: ligament size. φ: relative density.
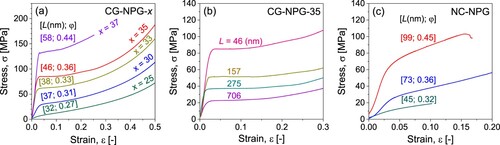
Annealing of CG-NPG with a stress plateau in compression (such as CG-NPG-35 in Figure b) leads to coarse structure size and in consequence the lowered yield strength; however, its compression behavior with a stress plateau is essentially maintained when L is enhanced to submicron scale. CG-NPGs might regain strain hardening behavior in compression if their φ and/or L are sufficiently large [Citation19].
Figure (c) shows that as-dealloyed NC-NPG with exhibits an evident strain hardening in compression. Annealing of this sample leads to concurrent coarsening and enhanced strength—the latter is induced by densification, i.e. an increase of φ in annealing. The annealed NC-NPGs also show evident strain hardening in compression. Generally, despite a high strength arising from nano-size effect, the compression behavior of NC-NPGs is analogous to that of conventional foams of a similar relative density.
The rates of strain hardening in compression
Normalized strain hardening rates, , are summarized in Figure (a) for each group of NPGs. Strain hardening rate is defined as
, where σ and ϵ are flow stress and engineering strain, respectively. Here, the θ is derived from compression curves with ϵ in a range of 0.05–0.20. The yield strength (
) is defined by the stress at intersection of an extended line of elastic region and an extrapolated linear portion of plastic flow (ϵ: 0.05–0.20) region inthe compression curves. Using this method, the yield strength determined from compression curves of conventional low-density foams is equivalent to their plateau stress.
Figure 4. Plots of (a) normalized strain hardening rates (), (b) hardness-to-strength ratios (
) and (c) plastic Poisson's ratios (
) against relative densities (φ) of NPGs. (d) The variation of
with
for NPG. The numbers refer to the ligament size of each sample (unit: nm). The
data of annealed NC-NPGs are missing because these samples shrank significantly in annealing, making it difficult to measure
accurately. The literature data [Citation12,Citation25–30] are included for comparison. Note that some previous studies may underestimate φ and define
differently compared with this work.
![Figure 4. Plots of (a) normalized strain hardening rates (θ/σy), (b) hardness-to-strength ratios (H/σ) and (c) plastic Poisson's ratios (νp) against relative densities (φ) of NPGs. (d) The variation of H/σ with νp for NPG. The numbers refer to the ligament size of each sample (unit: nm). The νp data of annealed NC-NPGs are missing because these samples shrank significantly in annealing, making it difficult to measure νp accurately. The literature data [Citation12,Citation25–30] are included for comparison. Note that some previous studies may underestimate φ and define σy differently compared with this work.](/cms/asset/d9ca2e35-8935-4512-8f2d-7e595cebaf60/tmrl_a_2181717_f0004_oc.jpg)
Figure (a) shows that the of the as-dealloyed CG-NPGs drops rapidly with increasing φ, becomes vanishingly small at
and then slightly increases at
. The annealed CG-NPG-35 samples gain near-zero
, except for the one with
nm. All NC-NPGs show rather large
, which decreases slightly with increasing φ.
Correlation between the hardness-to-strength ratios and relative density
Hardness-to-strength ratio, i.e. , is summarized as a function of φ in Figure (b) for all CG- and NC-NPGs. It shows that as-dealloyed CG-NPG-25 obtains
≈ 2.6, which is consistent with previous reports [Citation27]. Interestingly,
decreases with increasing φ and reaches the minimum value of ∼1.0 in CG-NPG-35 with
, then increases slightly to ∼1.5 as φ rises to 0.44 in CG-NPG-37. The
of annealed CG-NPG-35 remains almost constant at around 1.0 when L increases up to 275 nm, and then goes up to ∼1.7 as L increases to 706 nm. Unlike the CG-NPGs, all NC-NPGs show rather high
at around 2.5, which appears to be φ-insensitive within the range of testing.
Mean of all NPGs in Figure (b) is approximately 1.8, which turns out to be within the range (1.5–1.9) predicted from an empirical relation of high-density conventional foams, i.e.
, proposed by Ashby et al. [Citation4]. However, the large scatter of
(between 1 and 3) in a narrow range of φ does not arise from the uncertainty of measurements, but different behaviors of different types of NPGs. From this point of view, the hardness and the relative density are poorly correlated in this case.
Correlation between hardness-to-strength ratio and plastic Poisson's ratio
Plastic Poisson's ratio () is determined by the negative of the ratio of transverse strain to axial strain in NPGs, when compressed to 0.20–0.25 . At this strain, progressive densification has been extended to the entire sample for those with a stress plateau in compression, so that the measurement of
is not affected by the localized deformation at early stage of compression. The data of all CG- and NC-NPGs are summarized in Figure (c). It shows a general trend of increasing
with increasing φ. Moreover, compared with
and
,
appears to be less sensitive to material type and structure of NPGs investigated in this study. Generally, our
data are consistent with some previous reports [Citation26–28], in view of the fact that
may also be influenced by other factors such as ligament size [Citation26,Citation31] and network connectivity, and φ may be underestimated in some previous studies which ignored residual Ag and dealloying-induced volume contractions.
Now we are able to plot against
for all types of NPGs, as shown in Figure (d). We found that
scatters in a large range between 1.0 and 3.0, when
varies in a narrow range between 0.07 and 0.14. It shows a poor correlation, if there is any, between
and
, which argues against the widely accepted Shaw–Sata relation [Citation1]. This observation strongly suggests that
is not solely, or even not, controlled by
in NPGs.
It is noted that the NPGs whose locates at the bottom of
plot and in the vicinity of Miller's line in Figure (d), are those showing a stress plateau in compression stress–strain curves, despite their large
values, as summarized in Table . This finding is in favor of the Miller's simulation, which uncovers that
does not deviate much from 1.0 when
is increased up to 0.25, as long as compression strain hardening is absent in porous materials.
Table 1. Relative densities (φ), ligament sizes (L), normalized strain hardening rates (), plastic Poisson's ratios (
) and hardness-to-strength ratios (
) of NPGs and conventional porous materials with
.
Roles of plastic Poisson's ratio and strain hardening rate played in indentation
The variation of with φ in Figure (a) and the variation of
with φ in Figure (b) show a similar, if not exactly the same trend for each type of NPGs. This points to a correlation between indentation hardness and strain hardening rate of these materials under compression. This notion is confirmed by a general trend that
increases with increasing
, as plotted in Figure where the data from all types of NPGs are included. Again, all NPGs with a stress plateau in the compression curve are located at the bottom left corner of this plot, regardless of their φ and
, suggesting that the indentation hardness is sensitive to θ but not φ and
in NPGs.
Figure 5. The correlation between and
for NPGs. Comp.: pre-compressed samples.
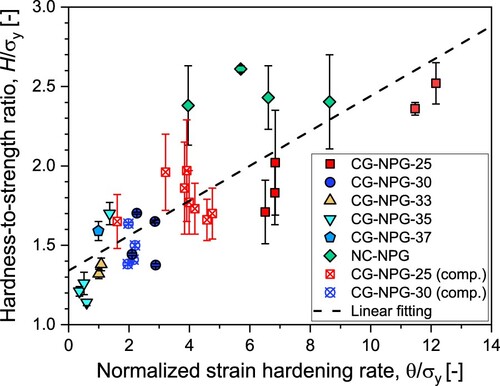
For a material with mean strain hardening rate θ, the flow stress at a compression strain ϵ can be approximated as
. Similarly, the indentation hardness can be expressed as
(1)
(1) or
(2)
(2) since the indentation hardness is more relevant to the flow stress at
than the yield strength. Here,
refers to the mean strain in plastic zone underneath indenter, and
and
are the restraint factors for yield strength and (non-zero) strain hardening rate, respectively. A linear fitting of our data in Figure using Equation (Equation2
(2)
(2) ) gives
and
. The obtained
is close to 1.0, confirming a weak restraint effect on the yield strength of NPGs, agreeing well with Miller's simulation [Citation14]. We note that a recent study [Citation33] also shows a linear relation between
and
of FE-simulated NPGs, which is consistent with this study, except that the simulated
drops to below 1.0 (around 0.41) at
.
The slope of the fitted line in Figure then roughly measures the mean plastic strain involved in indentation, i.e. , which turns out to be ∼ 0.11, if
also does not deviate much from 1.0. The relatively large scatter of
in Figure may arise from difference in
of different NPGs [Citation30] and other factors such as elasticity [Citation34]. Most data in Figure are located in the region between two fitted lines with slopes of 0.05 and 0.29 and
, suggesting that the
of NPGs in this study varies between 0.05 and 0.29. These values, which could be even smaller if
[Citation4,Citation15], are much lower than the initial porosity (1-φ) of NPGs prior to indentation. This suggests that NPGs have undergone a partial densification in the plastic zone under indenter, unlike a near-complete collapsing or crushing of indented low-density foams [Citation2,Citation35–37].
Above analysis is supported by a previous study on a cross-sectional imaging of indented CG-NPG-35 by Briot and Balk [Citation38]. They revealed the partial densification of NP structure beneath indenter, with plastic strain in the range of 0.18–0.34. These values are qualitatively consistent with the current study in view of the fact that the plastic strains were derived indirectly with a large margin of error in both studies. The partial densification during indentation is also consistent with an experimental observation that the plastic zone under indenter extended deeper (if scaled with respect to the indentation size) into NPG samples [Citation38] than in conventional low-density foams. A larger plastic zone is required to accommodate the overall volume change induced by indentation if a smaller strain is involved in the deformed region.
Briot and Balk [Citation38] also found that the plastic zone of NPG with relative density up to 0.35 was confined in the region beneath indenter similar to that of low-density foams [Citation1,Citation2] and did not extend laterally as in fully-dense materials [Citation7]. This also supports the scenario proposed in this study, i.e. a weak restraint of surrounding material on the plastic deformation of NPG under indenter.
It should be noted that the strain hardening mentioned in this study is a macroscopic behavior derived from their compression curves. The presence of a stress plateau does not necessarily mean the material deforms uniformly without hardening in compression. Instead, it is mostly induced by progressive deformation (densification) of NP structure [Citation19] as well as in low-density foams [Citation17,Citation18]. A recent study [Citation32] reveals that unidirectional NPGs deform by progressive kinking and also show a stress plateau in compression, and in consequence, (see Table ), agreeing with the scenario proposed in this study.
It should also be noted that Miller's simulation merely predicts of porous and nanoporous materials with zero strain hardening rate, which is seemingly the lower-bound value of
of porous materials. However, using Miller's curve to predict yield strength from hardness data could be problematic in most cases, if the rate of strain hardening is not taken into account.
We emphasize that this study does not defy the critical roles of compressibility played in indentation, but raise a concern over how varies with
. The low sensitivity of hardness or
to
has been confirmed in the dealloyed NPGs, which might also apply to other low-to-medium density porous materials as well, with
below ∼0.25. But for high-density porous materials with
well exceeding 0.25, the restraint factor
may increase rapidly with increasing
as described by Miller's simulation [Citation14], and the
-effect may then contribute to
on top of θ-effect, leading to
even larger than 3 as observed in a high-φ nanoporous Al (
) [Citation39]. This hints that the Shaw–Sata relation is even not the upper bound of
for porous materials. For high relative density porous materials, the contribution of lateral restraint to hardness, and the validity of Miller's curve as well, need to be tested in the future where the strain hardening contributions should also be quantified and considered similar to this study.
4. Conclusion
We studied the compression behavior and the indentation hardness of two type of NPGs, i.e. CG- and NC-NPGs. We found that the hardness-to-strength ratio and the plastic Poisson's ratio
are not correlated in these NPGs. This observation argues against an empirical relation proposed by Shaw and Sata [Citation1], i.e.
increases rapidly with increasing
, which has been widely used in the community of porous and nanoporous materials. We found that
remains nearly constant at around 1.0 in the NPGs showing a stress plateau in compression curves, regardless of φ and
, which is consistent with Miller's simulation [Citation14] under similar conditions. The finding suggests that
is insensitive to
and not the restraint factor for the deformation of NPGs. The deviation of
from 1.0 can be interpreted by the contribution of strain hardening, or more precisely, the deviation of flow stress (at the strain of indentation) from yield strength. In other words, the
of NPGs reflects the rate of strain hardening under compression, but not a restraint factor as previously thought. This notion might apply to other porous materials with low-to-medium relative densities as well. It raises a concern on numerous previous studies which used the Shaw–Sata relation to derive yield strength from the hardness of porous or nanoporous materials.
Supplemental Material
Download PDF (131.8 KB)Disclosure statement
No potential conflict of interest was reported by the author(s).
Additional information
Funding
References
- Shaw M, Sata T. The plastic behavior of cellular materials. Int J Mech Sci. 1966;8(7):469–478. doi:10.1016/0020-7403(66)90019-1.
- Wilsea M, Johnson K, Ashby M. Indentation of foamed plastics. Int J Mech Sci. 1975;17(7):457–IN6. doi:10.1016/0020-7403(75)90044-2.
- Gibson LJ, Ashby MF. Cellular solids: structure and properties. 2nd ed. Cambridge University Press; 1997. (Cambridge Solid State Science Series). doi:10.1017/CBO9781139878326
- Ashby MF, Evans T, Fleck NA, et al. Metal foams: a design guide. Woburn, USA: Elsevier; 2000.doi:10.1115/1.1421119.
- Andrews E, Gioux G, Onck P, et al. Size effects in ductile cellular solids. part II: experimental results. Int J Mech Sci. 2001;43(3):701–713. doi:10.1016/s0020-7403(00)00043-6
- Tabor D. The hardness of solids. Rev Phys Technol. 1970;1(3):145–179. doi:10.1088/0034-6683/1/3/i01
- Meyers MA, Chawla KK. Mechanical behavior of materials. Cambridge, UK: Cambridge University Press; 2008.
- Zhang P, Li S, Zhang Z. General relationship between strength and hardness. Mater Sci Eng A. 2011;529:62–73. doi:10.1016/j.msea.2011.08.061
- Sypeck DJ, Wadley HNG, Bart-Smith H. Structure and deformation of aluminum foams through computed tomography. In: Thompson D.O., Chimenti D.E., editors. Review of Progress in Quantitative Nondestructive Evaluation Vol. 17. New York: Plenum Press; 1998. p. 1443–1450. doi:10.1007/978-1-4615-5339-7_186.
- Hakamada M, Mabuchi M. Mechanical strength of nanoporous gold fabricated by dealloying. Scr Mater. 2007;56(11):1003–1006. doi:10.1016/j.scriptamat.2007.01.046
- Hodge A, Biener J, Hayes J, et al. Scaling equation for yield strength of nanoporous open-cell foams. Acta Mater. 2007;55(4):1343–1349. doi:10.1016/j.actamat.2006.09.038
- Biener J, Hodge AM, Hayes JR, et al. Size effects on the mechanical behavior of nanoporous au. Nano Lett. 2006;6(10):2379–2382.pMID: 17034115. doi:10.1021/nl061978i
- Briot NJ, Balk TJ. Developing scaling relations for the yield strength of nanoporous gold. Philos Mag. 2015;95(27):2955–2973. doi:10.1080/14786435.2015.1078512
- Miller RE. A continuum plasticity model for the constitutive and indentation behaviour of foamed metals. Int J Mech Sci. 2000;42(4):729–754. https://www.sciencedirect.com/science/article/pii/S0020740399000211. doi:10.1016/s0020-7403(99)00021-1.
- Deshpande V, Fleck N. Isotropic constitutive models for metallic foams. J Mech Phys Solids. 2000;48(6–7):1253–1283. doi:10.1016/s0022-5096(99)00082-4
- Kováčik J, Marsavina L, Linul E. Poisson's ratio of closed-cell aluminium foams. Materials. 2018;11(10):1904. doi:10.3390/ma11101904
- Maiti S, Gibson L, Ashby M. Deformation and energy absorption diagrams for cellular solids. Acta Metall. 1984;32(11):1963–1975. doi:10.1016/0001-6160(84)90177-9
- Ashby MF, Medalist RM. The mechanical properties of cellular solids. Metall Trans A. 1983;14(9):1755–1769. doi:10.1007/bf02645546
- Liu L-Z, Zhang Y-Y, Xie H, et al. Transition from homogeneous to localized deformation in nanoporous gold. Phys Rev Lett. 2021;127(9):095501. doi:10.1103/physrevlett.127.095501
- Erlebacher J, Aziz MJ, Karma A, et al. Evolution of nanoporosity in dealloying. Nature. 2001;410(6827):450–453.doi:10.1038/35068529
- Weissmüller J, Newman RC, Jin H-J, et al. Nanoporous metals by alloy corrosion: formation and mechanical properties. MRS Bull. 2009;34(8):577–586. doi:10.1557/mrs2009.157
- Zhang Y-Y, Xie H, Liu L-Z, et al. Surface triple junctions govern the strength of a nanoscale solid. Phys Rev Lett. 2021;126(23):235501. doi:10.1103/physrevlett.126.235501
- Kim Y-C, Gwak E-J, min Ahn S, et al. Indentation size effect in nanoporous gold. Acta Mater. 2017;138:52–60. doi:10.1016/j.actamat.2017.07.040
- ASTM Standard E140-12b. Hardness Conversion Tables for Metals Relationship Among Brinell Hardness, Vickers Hardness, Rockwell Hardness, Superficial Hardness, Knoop Hardness, Scleroscope Hardness, and Leeb Hardness. ASTM International; 2013. doi:10.1520/E0140-12B
- Mangipudi K, Epler E, Volkert C. On the multiaxial yielding and hardness to yield stress relation of nanoporous gold. Scr Mater. 2018;146:150–153. doi:10.1016/j.scriptamat.2017.11.033
- Lührs L, Soyarslan C, Markmann J, et al. Elastic and plastic Poisson's ratios of nanoporous gold. Scr Mater. 2016;110:65–69. doi:10.1016/j.scriptamat.2015.08.002
- Jin H-J, Kurmanaeva L, Schmauch J, et al. Deforming nanoporous metal: role of lattice coherency. Acta Mater. 2009;57(9):2665–2672. doi:10.1016/j.actamat.2009.02.017
- Volkert CA, Lilleodden ET, Kramer D, et al. Approaching the theoretical strength in nanoporous au. Appl Phys Lett. 2006;89(6):061920. doi:10.1063/1.2240109
- Bürckert M, Briot NJ, Balk TJ. Uniaxial compression testing of bulk nanoporous gold. Philos Mag. 2017;97(15):1157–1178. doi:10.1080/14786435.2017.1292060
- Huber N, Ryl I, Wu Y, et al. Densification of nanoporous metals during nanoindentation: the role of structural and mechanical properties. J Mater Res. 2023;38:853–866. doi:10.1557/s43578-022-00870-1.
- Lührs L, Zandersons B, Huber N, et al. Plastic poisson's ratio of nanoporous metals: a macroscopic signature of tension–compression asymmetry at the nanoscale. Nano Lett. 2017;17(10):6258–6266. doi:10.1021/acs.nanolett.7b02950
- Zhang Y-Y, Zou L, Liu L-Z, et al. Mechanical properties of unidirectional nanoporous gold under compression. Acta Mater. 2022;235:118078. doi:10.1016/j.actamat.2022.118078
- Huber N. A strategy for dimensionality reduction and data analysis applied to microstructure–property relationships of nanoporous metals. Materials. 2021;14(8):1822. doi:10.3390/ma14081822
- Needleman A, Tvergaard V, der Giessen EV. Indentation of elastically soft and plastically compressible solids. Acta Mech Sin. 2015;31(4):473–480. doi:10.1007/s10409-015-0467-9
- Vaz MF, Fortes M. Characterization of deformation bands in the compression of cellular materials. J Mater Sci Lett. 1993;12(17):1408–1410. doi:10.1007/bf00241724
- Jang W-Y, Kyriakides S. On the crushing of aluminum open-cell foams: part i. experiments. Int J Solids Struct. 2009;46(3–4):617–634. doi:10.1016/j.ijsolstr.2008.09.008
- Gibson LJ. Mechanical behavior of metallic foams. Annu Rev Mater Sci. 2000;30(1):191–227. doi:10.1146/annurev.matsci.30.1.191
- Briot NJ, Balk TJ. Focused ion beam characterization of deformation resulting from nanoindentation of nanoporous gold. MRS Commun. 2018;8(1):132–136. doi:10.1557/mrc.2017.138
- Yang W, Luo Z-P, Bao W-K, et al. Light, strong, and stable nanoporous aluminum with native oxide shell. Sci Adv. 2021;7(28):eabb9471. doi:10.1126/sciadv.abb9471.