
 ?Mathematical formulae have been encoded as MathML and are displayed in this HTML version using MathJax in order to improve their display. Uncheck the box to turn MathJax off. This feature requires Javascript. Click on a formula to zoom.
Abstract
Stress annealing is utilized for enhancing the magnetic softness of Fe83–xCoxB10Si3C3P1 (x = 0–16) amorphous alloys with saturation polarization up to 1.75 T. All of the stress-annealed alloys exhibit improved soft-magnetic properties, including low coercivity of 1.8–2.2 A/m, low core loss of 0.09–0.11 W/kg at 1.0 T and 50 Hz, and high permeability of 27,000–33,200 at 5 A/m and 1 kHz. Stress annealing induces longitudinal magnetic anisotropy and facilitates the annihilation of free volume, leading to pinning-free domain wall motion, and thus the enhanced magnetic softness. The induced magnetic anisotropy relates to the constrained elastic elongation introduced by stress annealing.
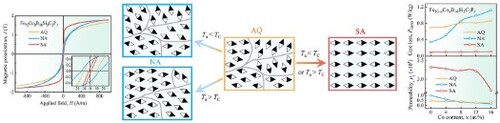
GRAPHICAL ABSTRACT
IMPACT STATEMENT
The stress-annealed Fe83–xCoxB10Si3C3P1 (x = 0–16) amorphous alloys exhibit excellent magnetic softness, sheding light on the designing and processing of amorphous soft magnetic alloys with high saturation polarization.
Introduction
Fe-based amorphous alloys exhibit low core loss and have been widely used in electric-utility and industrial transformers, power electronics, telecommunication, automotive magnetics, etc. [Citation1,Citation2]. However, their saturation polarization (Js) is relatively low compared to that of silicon steel. Developing Fe-based amorphous alloys combined with high Js and low core loss is of great significance to improve the power density and efficiency of advanced electronic devices [Citation3]. Great efforts have been devoted to increasing Js of Fe-based amorphous alloys by modifying compositions [Citation4,Citation5] and nanocrystallization [Citation6–8]. Nevertheless, the composition modulations based on increasing Fe content and adjusting metalloid elements have approached the limit in improving Js, due to the trade-off between amorphous-forming ability and Js [Citation9]. Besides, nanocrystallization of amorphous alloys with high Js by annealing encounters relatively poor manufacturability and grain coarsening [Citation10,Citation11], and the FeSi(B,P,C)Cu nanocrystalline alloys with high Js are hard to be fabricated into application-level wide ribbons because of the low amorphous-forming ability of amorphous precursors [Citation12]. The composition design strategy of Co substitution is found to be effective in increasing the Js without decreasing the amorphous-forming ability [Citation12,Citation13]. However, it tends to increase the magnetic anisotropy and Curie temperature (TC), leading to deteriorated magnetic softness especially when annealed below TC [Citation14,Citation15]. In order to eliminate the negative effect of Co substitution, magnetic field annealing is used, as it induces magneticanisotropy with easy axis parallel to the applied field [Citation14–16]. Nevertheless, as the influence of magnetic field on paramagnetic phase is roughly negligible, magnetic field annealing has little effect on enhancing the magnetic softness of amorphous alloys without Co or with low Co content when conducted above or near TC [Citation14,Citation15]. Due to the high cost of Co element, it is necessary to develop annealing technique that applies to the alloys with a small amount of Co and low TC.
Stress annealing (SA) has been proved to be effective in inducing uniaxial anisotropy with easy axis either parallel or perpendicular to the tensile stress [Citation17,Citation18]. It has been reported that the Metglas® 2605HB1M amorphous alloy subjected to SA treatment exhibits both low coercivity (Hc) and good bending ductility [Citation19]. Besides, SA has been utilized in improving the direct current tolerant characteristics of Finemet nanocrystalline alloys [Citation20]. Therefore, the effectiveness of SA treatment on Fe83-xCoxB10Si3C3P1 (x = 0, 4, 8, 12, 16) amorphous alloys was investigated in this work. The Fe83B10Si3C3P1 amorphous alloy possesses high amorphous-forming ability and good soft-magnetic properties [Citation9]. The influences of SA treatment and Co substitution on soft-magnetic properties, magnetic domain structure, and magnetization process were systematically investigated. Significant improvement of soft-magnetic properties is achieved by SA treatment, and the SA-treated Fe83-xCoxB10Si3C3P1 (x = 0, 4, 8, 12, 16) amorphous alloys exhibit low Hc of 1.8–2.2 A/m, low core loss at 1.0 T and 50 Hz (P10/50) less than 0.11 W/kg, high effective permeability (μe) of 27,000–33,200 at 5 A/m and 1 kHz, and high Js up to 1.75 T. Beneficial effects of SA on magnetic softening are associated with the longitudinal induced magnetic anisotropy, which shows dependence on composition and originates from the magnetoelastic effect due to the constrained elastic strain introduced by the applied stress. This work provides a promising method to modulate the soft-magnetic properties of Fe-based amorphous alloys with high Js.
Materials and methods
Alloy ingots with compositions of Fe83-xCoxB10Si3C3P1 (x = 0, 4, 8, 12, 16) were prepared by induction melting the mixtures of Fe (99.99 wt.%), Co (99.99 wt.%), Si (99.999 wt.%), B (99.99 wt.%), and pre-alloys of Fe-P (26.4 wt.% P) and Fe-C (5 wt.% C) under an argon atmosphere. The as-quenched (AQ) ribbons were fabricated by single-roller melt spinning, and the thickness was 23 ± 1 μm. The schematic image of SA is shown in Fig. S1. The AQ, SA-treated and normal annealed (NA) Fe83-xCoxB10Si3C3P1 (x = 0–16) ribbons are labeled as Cox-AQ, Cox-SA and Cox-NA, respectively. The phases of samples were identified by X-ray diffraction (XRD, Bruker D8-Discover). The thermal properties were analyzed by differential scanning calorimeter (DSC, Netzsch 404 F3). The Js was measured using a vibrating sample magnetometer (VSM, Lake Shore 7407) under a field up to 800 kA/m. The Hc, μe and P10/50 were measured by a DC B-H loop tracer (Riken BHS-40) under a maximum field of 1 kA/m, an impedance analyzer (Keysight, E4990A), and an AC B-H loop tracer (Riken AC BH-100 K), respectively. The magnetic domain was analyzed employing a magneto-optical Kerr microscope (Evico Magnetics GmbH, em-Kerr-highres). The hysteresis loops for estimation of anisotropy energy were measured by Magnetic Property Measurement System (Quantum Design, MPMS3), with field applied transversal to the ribbon axis. The linear thermal expansion was measured by thermomechanical analyzer (TMA, Netzsch 402 F3) with a heating rate of 5 K/min under an argon flow. The structural change was analyzed by synchrotron XRD in transmission with a wavelength of 0.6199 Å and a focused beam size of 3 × 4.5 μm2 at the 15U1 beamline of Shanghai Synchrotron Radiation Facility (SSRF).
Results and discussion
XRD patterns and DSC curves are shown in Figs. S2–S4. The TC of Co0-AQ and Co4-AQ samples are 606 and 662 K, respectively, but cannot be observed in AQ samples with higher Co content, suggesting that the TC may exceed crystallization temperature. Based on DSC results, SA and NA treatments were conducted in the temperature range of 573–673 K. The samples annealed at 633 K for 20 min exhibit optimal magnetic softness and are chosen for investigation.
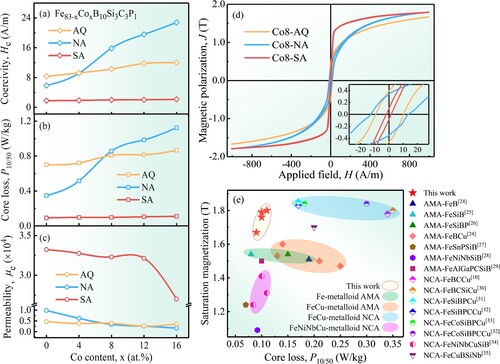
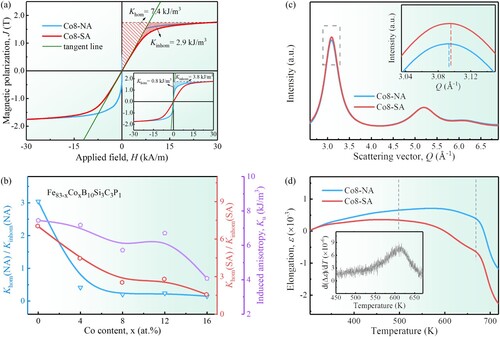
Figure (a-c) shows the Hc, P10/50 and μe of Fe83-xCoxB10Si3C3P1 (x = 0, 4, 8, 12, 16) amorphous alloys with AQ, NA and SA states, and the values are summarized in Table S1. As shown in Figure (a,b), compared with the AQ samples, Co0-NA and Co4-NA exhibit lower Hc and P10/50, whereas Co8-NA, Co12-NA and Co16-NA show higher Hc and P10/50. It is noticeable that all the SA samples have much lower Hc (1.8–2.2 A/m) and P10/50 (0.09–0.11 W/kg) than the corresponding AQ and NA samples. The Co-content dependence of μe is displayed in Figure (c). For Co0 and Co4 alloys, NA treatment brings a slight increase of μe, while for Co8, Co12 and Co16 alloys, NA treatment leads to the deterioration of μe. After SA treatment, the μe of the samples increases to above 27,000, although the μe shows a decreasing tendency with higher Co content. These results indicate that NA treatment deteriorates the soft-magnetic properties of alloys with high Co content, while SA treatment is effective in improving the magnetic softness for all of the alloys. As a typical example, the hysteresis loops measured along the ribbon axis of Co8 alloy are shown in Figure (d). Both Co8-AQ and Co8-NA exhibit round loops, and Co8-NA reveals a presence of steps due to the depinning of domain walls, as can be seen from the enlarged central part in the inset. After SA treatment, the hysteresis loop changes to squared shape characterized by significant reduction in loop area and absence of steps, and thus the core loss primarily caused by hysteretic response has low value. Compared with Co8-AQ sample, the Co8-NA/SA samples exhibit the increase of Js, resulting from the densification effect of structural relaxation on atomic packing density [Citation21]. Besides, the Js of SA samples rises from 1.62 to 1.75 T with increasing Co content (Table S1), which can be interpreted by the increase of average magnetic moment associated with magnetic valence theory [Citation22] and the strong ferromagnetic coupling of Fe-Co pairs [Citation23]. The saturation magnetization and P10/50 of the Fe83-xCoxB10Si3C3P1 (x = 0, 4, 8, 12, 16) amorphous alloys are compared with other typical Fe-based amorphous and nanocrystalline alloys [Citation10,Citation24–35], as shown in Figure (e). The amorphous alloys prepared by SA technique in this work show excellent magnetic softness-magnetization synergy, which makes them promising materials for industrial applications.
Figure 1. Changes in (a) Hc, (b) P10/50, and (c) μe as a function of Co content for samples with AQ, NA and SA states. (d) Hysteresis loops measured longitudinally of Co8-AQ, Co8-NA and Co8-SA. (e) A summary of saturation magnetization and P10/50 of the amorphous alloys prepared in this work and other typical Fe-based amorphous (AMA) and nanocrystalline (NCA) soft magnetic alloys.
To reveal the origin of magnetic property changes upon NA and SA treatments for alloys with different Co contents, the magnetic structure and magnetization process are investigated. The domain structures of AQ and NA/SA-treated Co0, Co8 and Co16 samples in the demagnetized state are shown in Figure . For all of the AQ samples, two types of patterns including wide-curved domains with 180° walls and narrow fingerprint-like domains are observed, which indicates the magnetoelastic anisotropies with in-plane and perpendicular easy axes arising from the coupling between saturation magnetostriction and internal stress. For NA samples, as shown in Figure (d), the Co0-NA exhibits wide strip domains oriented slightly off the ribbon axis, indicating the low domain energy, structure homogenization and internal stress elimination. In comparison, the domain patterns of Co8-NA in Figure (e) show more branches and rugged edges, and tilt towards the transverse direction, exhibiting strong pinning effect. It can be attributed to the magnetic anisotropy induced by local magnetic flux within the domain during NA treatment, which fluctuates on a scale larger than exchange length and causes domain wall stabilization effect [Citation36]. An increased pinning effect on domain wall is found in Co16-NA reflected by the increase of domain branches and pinning sites (Figure (f)). It is consistent with the worsening trend of soft-magnetic properties with increasing Co content. For all of the SA samples, wide strip domains with smooth edges align along the ribbon axis, providing good explanations for the excellent soft-magnetic properties, as shown in Figure (g–i).
Figure 2. Magnetic domains in the demagnetized state for (a) Co0-AQ, (b) Co8-AQ, (c) Co16-AQ, (d) Co0-NA, (e) Co8-NA, (f) Co16-NA, (g) Co0-SA, (h) Co8-SA, and (i) Co16-SA samples.
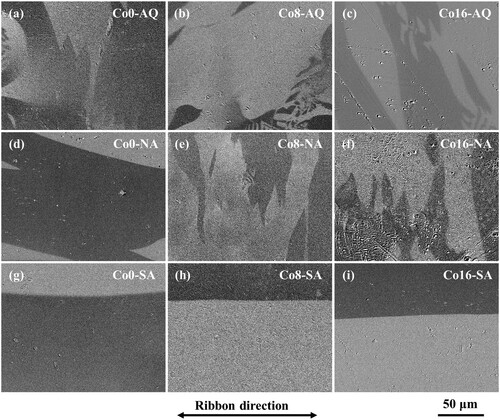
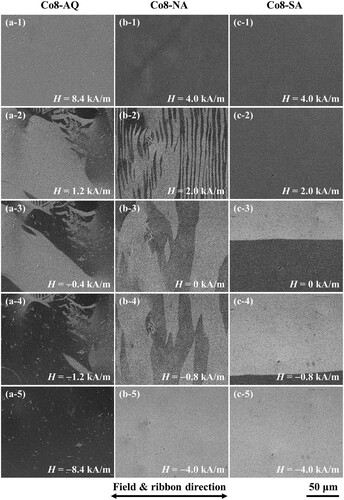
Figure shows the magnetization processes recorded under static field for Co8-AQ, Co8-NA and Co8-SA samples. All of the AQ samples exhibit similar magnetization processes controlled by both the wall motion and moment rotation. Representative results of Co8-AQ are shown in Figure (a). The fingerprint-like domains nucleate early during the magnetization reversal and require higher field to get saturated compared with the wide-curved domains. According to the Kersten’s relation with long-range stress fields [Citation37]:
(1)
(1) where
,
, and
denote the amplitude and wavelength of internal stress, and domain wall thickness, respectively. When the
is comparable to
, the internal stress effectively pins the domain walls and restrains the wall propagation, leading to poor soft-magnetic properties [Citation38]. The domain evolution of Co8-NA is shown in Figure (b). As the field decreases from 4.0 to 2.0 kA/m, the single domain changes into a number of parallel narrow domains resulting from the incoherent rotation, which is indicative of the induced anisotropy with a random fluctuation. In the remanent state, the domains merge together to form larger domains. With further increase of the field in negative direction, slight wall motion is visible, corroborating the strong wall pinning. For SA samples, the magnetization processes proceed via pinning-free wall motion, as shown by the Co8-SA in Figure (c). The wall motions of Co0-SA and Co16-SA are shown in Fig. S5. When the field increases from 0 to 320 A/m, domain walls in both Co0-SA and Co16-SA move smoothly perpendicular to the ribbon axis, but have difference in moving distance, with values of 68 and 35 μm, respectively. The higher moving rate of Co0-SA results in better soft-magnetic properties.
Figure 3. The magnetization processes recorded under static field for (a) Co8-AQ, (b) Co8-NA, and (c) Co8-SA samples.
Representative hysteresis loops measured transversal to ribbon axis of Co8-NA and Co8-SA are corrected for the demagnetization effect and shown in Figure (a). The loop of Co8-SA is strongly sheared and reaches magnetic saturation at relatively high field, revealing the uniaxial anisotropy with longitudinal easy axis. The deviation from linearity toward saturation indicates inhomogeneous rotational processes due to locally varying strength of longitudinal anisotropy [Citation39]. The homogeneous (Khom) and inhomogeneous (Kinhom) anisotropy contributions were estimated by extrapolation of the initial slope. Compared with Co8-NA, Co8-SA exhibits significant increase of longitudinal Khom and decrease of Kinhom, revealing the SA-induced anisotropy energy (Ku) as high as Ku ≈ 6 kJ/m3. The Khom(NA)/Kinhom(NA), Khom(SA)/Kinhom(SA) and Ku as a function of Co content are shown in Figure (b). For NA samples, Co substitution leads to a dramatic drop in the Khom(NA)/Kinhom(NA), confirming the Kinhom induced by local magnetic flux and explaining the strong wall pinning. For SA samples, the Khom(SA)/Kinhom(SA) exhibit higher values than those of Co-substituted NA samples reflecting the dominant contribution from the SA-induced anisotropy, and a gradual decrease with increased Co content. The Ku shows a slight fluctuation and a subsequent decrease with increasing Co content. The compositional dependences of Khom(SA)/Kinhom(SA) and Ku rationalize the differences in wall motion and magnetic softness for SA samples with different Co content.
Figure 4. (a) Hysteresis loops measured transversally and corrected for the demagnetization effect of Co8-NA and Co8-SA. (b) Compositional dependences of Khom(NA)/Kinhom(NA), Khom(SA)/Kinhom(SA) and Ku. (c) Synchrotron XRD patterns of Co8-NA and Co8-SA. (d) The curves of linear thermal expansion for Co8-NA and Co8-SA. Derivative of the defined as the difference between elongation of Co8-NA and Co8-SA is shown as inset.
The relaxation spectra of Co8-AQ, Co8-NA and Co8-SA are shown in Fig. S6. The Co8-SA has a smaller relaxation enthalpy than Co8-AQ and Co8-NA, indicating that SA treatment results in a more relaxed state and promotes the annihilation of quench-in free volume [Citation40]. The free volume acting as quasi-dislocation dipole-type defect is the main source of elastic stress [Citation37,Citation41], and Hc is written as:
(2)
(2) where
and
are the volume and density of ‘quasi-dislocation dipole’, respectively. Therefore, larger reduction in the free volume contributes to the relaxation of inhomogeneous anisotropy and unobstructed wall motion, enhancing the magnetic softness.
Synchrotron XRD and TMA analyses were conducted to uncover the mechanism of SA-induced magnetic anisotropy. As shown in Figure (c), both synchrotron XRD patterns of Co8-NA and Co8-SA are smooth without sharp diffraction peaks, further confirming the amorphous nature. As exhibited in the inset, there is observable difference in the first peak position between the two samples, which has also been observed in some anelastically deformed amorphous alloys and reflects the microscopic strain of intermediate range [Citation42,Citation43]. The first peak position for Co8-NA () and Co8-SA (
) are 3.095 and 3.096 Å−1, respectively, suggesting a constrained strain introduced by the stress applied during annealing. The constrained strain along the direction perpendicular to the applied stress is calculated to be −0.04% using the equation [Citation17]:
(3)
(3) The elastic elongation parallel to the applied stress is 0.12∼0.13% expected from the Poisson ratio of typically 0.31–0.33 in Fe-based amorphous ribbons [Citation17,Citation44]. The second peak position also exhibits difference between Co8-NA and Co8-SA, with Q values of 5.191 and 5.194 Å−1, respectively, indicating differences in the distribution of nearest-neighbor atomic bond [Citation42].
Figure (d) shows the TMA curves of Co8-NA and Co8-SA. Both samples reveal typical thermal expansion up to ∼500 K and crystallization at 674 K, but differ significantly around the annealing temperature (633 K). That is, Co8-SA exhibits a pronounced shrinkage associated with the release of elastic strain introduced by SA treatment. The derivative of elongation difference is plotted in the inset, and it is featured by a peak located near 620 K referring to the maximum rate of strain release, suggesting that the SA sample memorizes the original annealing temperature [Citation43,Citation45]. The constrained elastic strain is 0.11% derived from the peak area, which is basically consistent with the strain determined using synchrotron XRD, indicating that the SA-induced magnetic anisotropy originates from the magnetoelastic effect.
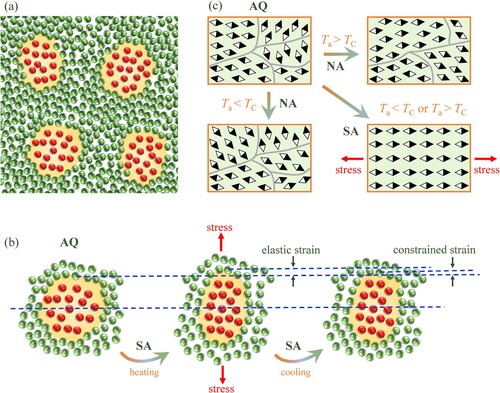
Based on the model proposed by Ohnuma et al. [Citation45] and previous findings [Citation46], the mechanism of constrained elastic strain is illustrated schematically in Figure (a,b). As shown in Figure (a), amorphous alloys are composed of loosely bonded free-volume regions (atoms in red color) embedded in the tightly bonded matrix (atoms in green color). During SA treatment, the matrix deforms elastically, whereas the atoms in loosely bonded region slowly change their positions to release local elastic energy and accommodate to the shape of elongated ‘cage’ (Figure (b)). The atomic rearrangement within free-volume region is frozen after SA treatment, and some part of the elastic elongation in the matrix remains as constrained strain. A schematic diagram of domain structure evolution upon NA and SA treatments is exhibited in Figure (c). The pointers represent the easy magnetization direction of atoms. During NA treatment, the alloys with low TC transit to paramagnetic state and relax unaffectedly by the local spontaneous magnetization, resulting in the decrease of magnetic anisotropy, while the Co-substituted alloys with high TC suffer from stabilization effect on domain wall, resulting in deteriorated magnetic softness. All alloys subjected to SA treatment demonstrate a domain modulation with magnetic moments aligned along the applied stress insusceptible to TC, leading to improved magnetic softness.
Figure 5. Schematic diagrams of (a) atomic structure at AQ state, (b) structural evolution during SA treatment, and (c) magnetic domain evolution upon NA and SA treatments.
Conclusions
The Fe83-xCoxB10Si3C3P1 (x = 0–16) amorphous alloys with low Hc of 1.8–2.2 A/m, low P10/50 of 0.09–0.11 W/kg, high μe of 27,000–33,200, and high Js up to 1.75 T are developed by SA technique. By employing SA treatment, the modulation of magnetic and atomic structures promotes the formation of regular magnetic domain and annihilation of quench-in free volume, giving rise to uniform magnetic anisotropy and pinning-free wall motion. Uniaxial elastic strain is introduced and constrained, resulting in the SA-induced anisotropy with longitudinal easy axis through magnetoelastic interaction.
Supplemental Material
Download MS Word (1.6 MB)Disclosure statement
No potential conflict of interest was reported by the author(s).
Data availability statement
The data that support the findings of this study are available from the corresponding author upon reasonable request.
Additional information
Funding
References
- Hasegawa R. Present status of amorphous soft magnetic alloys. J Magn Magn Mater. 2000;215–216:240–245.
- Silveyra JM, Ferrara E, Huber DL, et al. Soft magnetic materials for a sustainable and electrified world. Science. 2018;362:eaao0195.
- Gutfleisch O, Willard MA, Bruck E, et al. Magnetic materials and devices for the 21st century: stronger, lighter, and more energy efficient. Adv Mater. 2011;23:821–842.
- Ogawa Y, Naoe M, Yoshizawa Y, et al. Magnetic properties of high Bs Fe-based amorphous material. J Magn Magn Mater. 2006;304:e675–e677.
- Zhang JH, Chang CT, Wang AD, et al. Development of quaternary Fe-based bulk metallic glasses with high saturation magnetization above 1.6 T. J Non-Cryst Solids. 2012;358:1443–1446.
- Ohta M, Yoshizawa Y. Magnetic properties of nanocrystalline Fe82.65Cu1.35SixB16−x alloys (x = 0–7). Appl Phys Lett. 2007;91:062517.
- Makino A, Men H, Kubota T, et al. FeSiBPCu nanocrystalline soft magnetic alloys with high Bs of 1.9 tesla produced by crystallizing hetero-amorphous phase. Mater Trans. 2009;50:204–209.
- Yodoshi N, Ookawa S, Yamada R, et al. Effects of nanocrystallisation on saturation magnetisation of amorphous Fe76Si9B10P5. Mater Res Lett. 2018;6:100–105.
- Shi LX, Yao KF. Composition design for Fe-based soft magnetic amorphous and nanocrystalline alloys with high Fe content. Mater Des. 2020;189:108511.
- Fan XD, Men H, Ma AB, et al. Soft magnetic properties in Fe84−xB10C6Cux nanocrystalline alloys. J Magn Magn Mater. 2013;326:22–27.
- Sharma P, Zhang X, Zhang Y, et al. Competition driven nanocrystallization in high Bs and low coreloss Fe–Si–B–P–Cu soft magnetic alloys. Scr Mater. 2015;95:3–6.
- Setyawan AD, Takenaka K, Sharma P, et al. Magnetic properties of 120-mm wide ribbons of high Bs and low core-loss NANOMET® alloy. J Appl Phys. 2015;117:17B715.
- Hou L, Fan XD, Wang QQ, et al. Microstructure and soft-magnetic properties of FeCoPCCu nanocrystalline alloys. J Mater Sci Technol. 2019;35:1655–1661.
- Luo Q, Li DH, Cai MJ, et al. Excellent magnetic softness-magnetization synergy and suppressed defect activation in soft magnetic amorphous alloys by magnetic field annealing. J Mater Sci Technol. 2022;116:72–82.
- Zhao C, Wang A, He A, et al. Nano-heterogeneity-stabilized and magnetic-interaction-modulated metallic glasses. Sci China Mater. 2021;64:1813–1819.
- Škorvánek I, Marcin J, Turčanová J, et al. Improvement of soft magnetic properties in Fe38Co38Mo8B15Cu amorphous and nanocrystalline alloys by heat treatment in external magnetic field. J Alloys Compd. 2010;504S:S135–S138.
- Ohnuma M, Herzer G, Kozikowski P, et al. Structural anisotropy of amorphous alloys with creep-induced magnetic anisotropy. Acta Mater. 2012;60:1278–1286.
- Corte-León P, Blanco JM, Zhukova V, et al. Engineering of magnetic softness and domain wall dynamics of Fe-rich amorphous microwires by stress-induced magnetic anisotropy. Sci Rep. 2019;9:12427.
- Azuma D, Ito N, Ohta M. Recent progress in Fe-based amorphous and nanocrystalline soft magnetic materials. J Magn Magn Mater. 2020;501:166373.
- Pan Y, Liu T, Li G, et al. Direct current tolerant characteristics of FeCuNbSiB nanocrystalline in tensile stress annealing. J Mater Sci Mater Electron. 2021;32:473–484.
- Yang Y, Zeng JF, Volland A, et al. Fractal growth of the dense-packing phase in annealed metallic glass imaged by high-resolution atomic force microscopy. Acta Mater. 2012;60:5260–5272.
- Williams AR, Moruzzi VL, Malozemoff AP, et al. Generalized slater-pauling curve for transition-metal magnets. IEEE Trans Magn. 1983;19:1983–1988.
- Gallagher KA, Willard MA, Zabenkin VN, et al. Distributed exchange interactions and temperature dependent magnetization in amorphous Fe88−xCoxZr7B4Cu1 alloys. J Appl Phys. 1999;85:5130–5132.
- Warski T, Wlodarczyk P, Polak M, et al. Influence of Cu content on structure and magnetic properties in Fe86-xCuxB14 alloys. Materials. 2020;13:1451.
- Makino A, Hatanai T, Inoue A, et al. Nanocrystalline soft magnetic Fe-M-B (M = Zr, Hf, Nb) alloys and their applications. Mater Sci Eng A. 1997;226–228:594–602.
- Li Z, Zhou S, Zhang G, et al. Highly ductile and ultra-thick P-doped FeSiB amorphous alloys with excellent soft magnetic properties. Materials. 2018;11:1148.
- Chin TS, Chao CK, Lin CY, et al. Novel tin-containing Fe-base glassy alloys. IEEE Trans Magn. 2003;39:3016–3018.
- Hawelek L, Warski T, Wlodarczyk P, et al. The structure and magnetic properties of rapidly quenched Fe72Ni8Nb4Si2B14 alloy. Materials. 2021;14:1–10.
- Mizushima T, Makino A, Yoshida S, et al. Low core losses and soft magnetic properties of Fe–Al–Ga–P–C–B–Si glassy alloy ribbons with large thicknesses. J Appl Phys. 1999;85:4418–4420.
- Fan XD, Shen BL. Crystallization behavior and magnetic properties in high Fe content FeBCSiCu alloy system. J Magn Magn Mater. 2015;385:277–281.
- Takenaka K, Nishijima M, Makino A. Effect of metalloid elements on the structures and soft magnetic properties in Fe85.2SixB14-x-yPyCu0.8 alloys. IEEE Trans Magn. 2014;50:2004704.
- Liu T, Kong F, Xie L, et al. Fe(Co)SiBPCCu nanocrystalline alloys with high Bs above 1.83 T. J Magn Magn Mater. 2017;441:174–179.
- Takenaka K, Setyawan AD, Sharma P, et al. Industrialization of nanocrystalline Fe–Si–B–P–Cu alloys for high magnetic flux density cores. J Magn Magn Mater. 2016;401:479–483.
- Warski T, Radon A, Zackiewicz P, et al. Influence of Cu content on structure, thermal stability and magnetic properties in Fe72-xNi8Nb4CuxSi2B14 alloys. Materials. 2021;14:1–13.
- Zhang J, Wan F, Li Y, et al. Effect of surface crystallization on magnetic properties of Fe82Cu1Si4B11.5Nb1.5 nanocrystalline alloy ribbons. J Magn Magn Mater. 2017;438:126–131.
- Suzuki K, Herzer G. Magnetic-field-induced anisotropies and exchange softening in Fe-rich nanocrystalline soft magnetic alloys. Scr Mater. 2012;67:548–553.
- Bitoh T, Makino A, Inoue A. Origin of low coercivity of Fe-(Al, Ga)-(P, C, B, Si, Ge) bulk glassy alloys. Mater Trans. 2003;44:2020–2024.
- Fujimori H, Obi Y, Masumoto T, et al. Soft ferromagnetic properties of some amorphous alloys. Mater Sci Eng. 1976;23:281–284.
- Lopatina E, Soldatov I, Budinsky V, et al. Surface crystallization and magnetic properties of Fe84.3Cu0.7Si4B8P3 soft magnetic ribbons. Acta Mater. 2015;96:10–17.
- Di SY, Wang QQ, Zhou J, et al. Enhancement of plasticity for FeCoBSiNb bulk metallic glass with superhigh strength through cryogenic thermal cycling. Scr Mater. 2020;187:13–18.
- Han LL, Maccari F, Souza Filho IR, et al. A mechanically strong and ductile soft magnet with extremely low coercivity. Nature. 2022;608:310–316.
- Yan X, Hirscher M, Egami T, et al. Direct observation of anelastic bond-orientational anisotropy in amorphous Tb26Fe62Co12 thin films by X-ray diffraction. Phys Rev B. 1991;43:9300–9303.
- Kozikowski P, Ohnuma M, Herzer G, et al. Relaxation studies of amorphous alloys with creep induced magnetic and structural anisotropy. Scr Mater. 2012;67:763–766.
- Gu XJ, Poon SJ, Shiflet GJ. Mechanical properties of iron-based bulk metallic glasses. J Mater Res. 2007;22:344–351.
- Kozikowski P, Ohnuma M, Hashimoto R, et al. Temperature memory effect of stress annealing-induced anisotropy in metallic glasses. Phys Rev Mater. 2020;4:095604.
- Wang DP, Qiao JC, Liu CT. Relating structural heterogeneity to β relaxation processes in metallic glasses. Mater Res Lett. 2019;7:305–311.