
 ?Mathematical formulae have been encoded as MathML and are displayed in this HTML version using MathJax in order to improve their display. Uncheck the box to turn MathJax off. This feature requires Javascript. Click on a formula to zoom.
Abstract
Tailoring recrystallization via particle-stimulated nucleation (PSN) and pinning effects from secondary phase particles effectively weakens textures, which is still challenging for low-alloyed rare earth-free Mg alloys. Herein, the texture of a dilute cold-rolled Mg-2.2Al-0.33Ca (wt.%) alloy is found to reduce with the appearance of transverse direction (TD) texture components during static recrystallization. The texture transition is mainly attributed to the preferential growth of TD-oriented recrystallized grains, resulting from the preferential segregation of Al and Ca atoms on basal-oriented grain boundaries with low misorientation angles. The findings provide an in-depth understanding of texture modification in Mg alloys.
GRAPHICAL ABSTRACT
IMPACT STATEMENT
The anisotropic co-segregation of Al and Ca on grain boundaries is responsible for the texture weakening of a dilute Mg-Al-Ca alloy, which provides a strategy for texture modification in such alloys.
For magnesium (Mg) alloys, strong basal textures tend to form during rolling deformation, resulting in poor formability at room temperature [Citation1,Citation2]. To improve formability, weakening or tilting basal textures has been shown to be strongly required [Citation3–5]. In some cases, static recrystallization (SRX) can effectively lead to non-basal or weak basal textures of Mg alloys [Citation6–8], which plays a critical role in controlling the formability and mechanical properties. For the discontinuous SRX process, opinions differ on the specific effect from nucleation and growth of grains on texture evolution. Generally, recrystallized grain nuclei with random orientations can be induced by twins [Citation9–11], secondary phase particles [Citation12,Citation13], and shear bands [Citation14]. Meanwhile, recrystallized grain nuclei with a c-axis close to the rolling direction (RD) or transverse direction (TD) have also been reported and are related to the characteristics of the nucleation sites, such as twin orientation and dislocation type [Citation15]. Nevertheless, the underlying mechanisms are still controversial [Citation16,Citation17]. Following nucleation, the uniform growth of recrystallized grains can effectively retain the superiority of randomized/oriented nucleation, resulting in weakened textures [Citation18–20]. However, the preferential growth of basal-orientated grains tends to occur in certain cases, due to the energy and size advantages of basal-orientated grains [Citation21,Citation22]. The growth behavior of recrystallized grains is related to grain boundary (GB) migration rates [Citation23,Citation24], which are affected by complex factors, such as GB segregation. If GB segregation can inhibit the growth of basal-oriented grains more effectively than non-basal-oriented grains, the preferential growth of non-basal grains dominates and leads to weakened basal textures [Citation25,Citation26]. Accordingly, the weakening and/or modification of deformation textures during recrystallization, whether through randomized/oriented nucleation or preferential growth of recrystallized grains, are diverse for different Mg alloys [Citation21,Citation27].
Recently, the Ca element has been found to be effective in weakening textures during the recrystallization of rare earth-free Mg alloys [Citation28–30]. It has been indicated that the co-segregation of Zn and Ca atoms at GBs is crucial to restrict the growth of basal-oriented grains in Mg-Zn-Ca and Mg-Al-Zn-Ca alloys [Citation31,Citation32,Citation26]. Notably, for Mg-Al-Ca based Mg alloys without Zn, basal texture weakening during annealing is ascribed to recrystallization induced by Al2Ca particles via the particle-stimulated nucleation (PSN) mechanism [Citation33]. However, the PSN mechanism can only work in high-alloyed Mg-Al-based alloys containing large amounts of secondary phases [Citation34,Citation12]. Recently, dilute or low alloyed Mg alloys have attracted considerable attention for their great potential in obtaining an excellent combination of strength and ductility by avoiding the formation of coarse eutectic phases and introducing the G.P. zone strengthening. Dilute Mg alloys also show high room-temperature formability, which is suitable for fast extrution. The low content of alloying elements and the fast extrusion process render dilute Mg alloys low-cost. Nevertheless, the texture evolution of dilute Mg-Al-Ca alloys has not been fully explored [Citation35,Citation36]. The focus lies upon the following aspects for dilute Mg-Al-Ca alloys: (1) whether non-basal or weak basal textures could be induced by SRX? (2) If this occurs, what is the underlying mechanism?
To address these issues, the nucleation and growth of recrystallized grains, as well as the corresponding texture evolution in a cold-rolled dilute Mg-2.2Al-0.33Ca (wt.%) alloy during isothermal annealing (IA), have been tracked systematically using the quasi in-situ electron backscatter diffraction (EBSD) method. The underlying mechanisms for the texture evolution associated with recrystallization have been investigated.
The as-extruded Mg-2.2Al-0.33Ca (wt.%, AX20) alloy was solution treated at 400 °C for 1 h followed by water quenching, after which nearly all intermetallic compounds were dissolved into the Mg matrix (Figure S1). Hence, the role of PSN mechanism on texture evolution could be ignored in this study. The as-solutionized alloy was subjected to one-pass cold rolling with a thickness reduction of ∼17% along the extrusion direction. To track the texture evolution during static annealing, quasi in situ EBSD characterization (scan step size: 0.6 µm) was conducted on the same region the middle of the RD-ND plane, using a ZEISS Sigma 500 scanning electron microscope (SEM) at 20 kV. However, for better describing the characteristic of basal textures, the projective plane for (0001) pole figures (PFs) is the RD-TD plane. High-angle annular dark-field scanning transmission electron microscopy (HAADF-STEM) and energy dispersive X-ray (EDX) spectroscopy were performed using a JEM-2100F TEM (JEOL, Japan) at 200 kV.
Figure shows quasi in-situ EBSD results for the cold-rolled and the annealed AX20 alloys with three different durations, i.e. 2578, 3178 and 4798 s. The cold-rolled AX20 alloy shows the coexistence of twins and shear bands (Figure (a) and (b)). Statistics indicate that the main twin types are tensile twins (TTWs) and
-
double twins (DTWs), with the area fractions being ∼12.7% and ∼3.8%, respectively. It should be mentioned that very few
compression twins (CTWs) have also formed (∼1.4%). The highly strained band-like regions, such as R1 and R2 (white dotted rectangles) in Figure (a) and (b), are considered to be shear bands, which may have undergone
twinning followed by
secondary twinning [Citation37]. Additionally, as shown in Figure (c), the cold-rolled AX20 alloy exhibits a strong basal texture with a peak intensity of ∼12.8 mrd (multiple of a random distribution). The position of peak intensity tilts away from ND by ∼7°, with large amounts of basal poles distributed in the circle having an angle of ∼30° to ND.
Figure 1. Quasi in-situ EBSD results showing the microstructure and texture evolution of the cold-rolled AX20 alloy during IA at 300 °C. (a, b, c) Cold-rolled, (d, e, f) 2578 s, (g, h, i) 3178 s and (j, k, l) 4798 s. (a, d, g, j) inverse pole figure (IPF) maps, (b, e, h, k) kernel average misorientation (KAM) maps, and (c, f, i, l) (0001) pole figures (PFs). The white dotted rectangles and white solid rectangles highlight the recrystallization induced by shear bands and GBs, respectively.
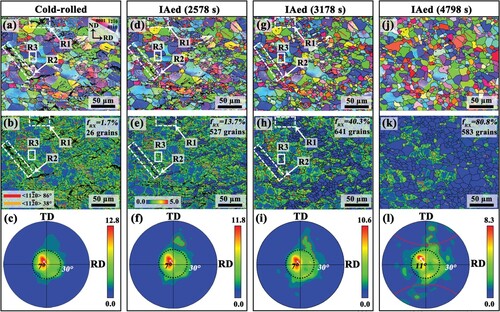
After annealing at 300 °C for 2578 s (Figure (d) and (e)), some new fine recrystallized grains are readily observed inside shear bands (such as R1 and R2) with an area fraction of ∼13.7%. Figure (f) indicates that recrystallization results in a slight change of texture components and the maximum intensity (∼11.8 mrd). With increasing the annealing time to 3178 s (Figure (g) and (h)), a large number of recrystallized grains appear, i.e. the number of recrystallized grains increass from ∼527 to ∼641. As indicated by the white-solid rectangle (R3) in Figure (g) and (h), recrystallized grains nucleate at GBs can occasionally be observed. Compared to the 2578 s, the tilt angle of peak intensity shows a negligible change with the peak intensity decreasing to 10.6 mrd, while more basal poles tend to move towards TD (Figure (i)).
Subsequently, recrystallized grains show an obvious growth behavior. The area fraction of recrystallized grains in the alloy annealed for 4798 s (Figure (j, k)) further increases to ∼80.8%, while the number of recrystallized grains decreases to ∼583. Meanwhile, the peak texture intensity remarkably decreases to ∼8.3 mrd, with the tilt angle located at ∼11° to ND (Figure (l)). It is interesting that new discernible TD texture components (orientations within 45° to TD) emerge, as highlighted by red dotted circles in Figure (l). Accordingly, it is crucial to understand the underlying mechanisms for the formation of TD texture components and texture weakening during IA.
As aforementioned, TTWs, DTWs and CTWs have formed in the cold-rolled AX20 alloy, which could serve as recrystallization sites during IA. Figure (a) and (b) show three parent grains P1, P2 and P3, containing TTWs, DTWs and CTWs, respectively. Although CTWs in the grain P3 cannot be fully indexed due to the accumulation of strains, they have been confirmed by the orientation relationship between the indexed band-like regions and parent grain matrix in Figure S2. After annealing for 1978 s (Figure (d) and (e)), fine recrystallized grains G1-G6 have formed at CTWs, with non-basal orientations that are different from the orientation of the parent grain P3. Another feature is that recrystallization at DTWs can also be observed (such as G7). However, recrystallized grains are rarely observed at TTWs, which can be attributed to insufficient stored energy [Citation38]. After annealing for 2578 s (Figure (g) and (h)), recrystallized grains (G1-G7) gradually grow and consume part of the host twins and adjacent grains.
Figure 2. Twin-induced recrystallization during IA. (a, d, g, j) IPF maps, (b, e, h, k) grain orientation spread (GOS) maps. The threshold of GOS value for distinguishing deformed and recrystallized grains is 1.5°, with recrystallized grains marked in blue. (c, f, i, l) corresponding (0001) PFs for grains G1-G9, P1-P3 and the TTW in (b, e, h, k).
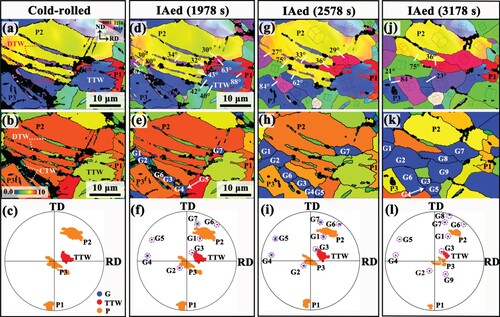
With further increasing the annealing time to 3178 s (Figure (j) and (k)), inhomogeneous grain growth occurs. For example, the grain sizes of G6, G7 and G8 are larger than G3, G4 and G5. It is worth mentioning that some larger recrystallized grains are with TD orientations (Figure (l)), implying the possible preferential growth of TD-oriented grains. Nevertheless, after 4798 s of annealing, the area fraction of recrystallized grains originating from DTWs and CTWs among total recrystallized grains is determined to be ∼10%, with a limited contribution to the texture evolution.
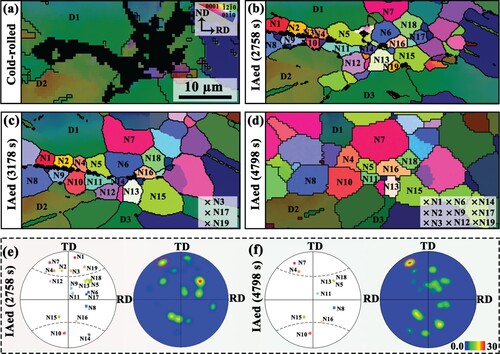
In the present work, shear bands are the major nucleation sites for recrystallization compared to twins and GBs (Figure ). Thus, the shear band R1 in Figure (a) is enlarged in Figure to investigate the nucleation and growth of recrystallized grains. The comparison between Figure (a) and (b) reveals the nucleation of fine recrystallized grains (N1-N19) aggregating within shear band R1, some of which even expand into the adjacent deformed grains (such as D1, D2, and D3). Orientations of these recrystallized grains are collected in the (0001) pole figure (PF) in Figure (e), which suggests that some recrystallized grains show TD orientations that are far away from ND. It is generally believed that shear bands are narrow zones of intensive shear strains, which could induce nucleation of recrystallization with a wide spectrum of orientations during annealing [Citation39,Citation40]. However, the TD-oriented nucleation induced by shear bands appears to be observed in this work. As the annealing time increases to 3178 s (Figure (c)), some small recrystallized grains (such as N3, N17, and N19) are consumed by adjacent larger recrystallized grains. After annealing for 4798 s (Figure (d)), more grains are consumed (as denoted in the inset) and the average size of recrystallized grains increases. Particularly, the recrystallized grains with near basal orientations (such as N6, N9 and N17) are more rapidly consumed by adjacent TD-oriented recrystallized grains (such as N7, N10 and N16). The recrystallized grains with their c-axes almost parallel to ND remain relatively small (such as grains N5, N11 and N13). In contrast, the recrystallized grains with their c-axes nearly parallel to TD grow preferentially. These observations indicate that the preferential growth of TD-oriented recrystallized grains occurs and agrees well with the results in Figure (k).
Figure 3. Shear band-induced recrystallization of AX20 alloys. (a-d) IPF maps of the (a) Cold-rolled, (b) annealed for 2578 s, (c) 3178 s and (d) 4798 s. The recrystallized grains are highlighted in bright colors. The recrystallized grains that are consumed during grain growth are indicated in the insets of IPFs. (e) (0001) PFs for grains N1-N19 in (b), and (f) (0001) PFs for grains N1-N19 in (d).
To validate the correlation between the preferential growth of recrystallized grains and texture weakening, recrystallized grains are divided into three groups roughly according to the feature of texture components in the (0001) PF (Figure (a)), namely basal texture component: tilting 0-20° from ND, TD texture component: tilting 0-45° from TD, and RD texture component: tilting 0-45° from RD. Figure (b) and (c) illustrate the number fractions and average grain sizes of recrystallized grains belonging to various texture components. After annealing for 2578 s, grains corresponding to the TD texture component occupy the largest number fraction (Figure (b)), implying the occurrence of TD-oriented nucleation. Meanwhile, the average size of TD-oriented grains is the smallest (∼3.7 µm) compared to the recrystallized grains belonging to the ND or RD texture components (Figure (c)). However, the growth rate of TD-oriented grains is the highest (the average grain size increases from ∼3.7 to ∼8.8 µm). Furthermore, a comparison of the angles of basal poles tilting away from ND after cold rolling and subsequent annealing indicates the preferential growth of non-basal grains (Figure S3).
Figure 4. (a) The (0001) PF shows the definition of different texture components. (b) Number fractions, (c) average grain sizes of the ND-oriented, RD-oriented and TD-oriented recrystallized grains according to (a) and (d) misorientation angle distributions of boundaries between recrystallized grains under various annealing times. Fractions of boundaries delineating ND-oriented, RD-oriented and TD-oriented grains in alloys annealed for (e) 2578 s and (f) 4798 s.
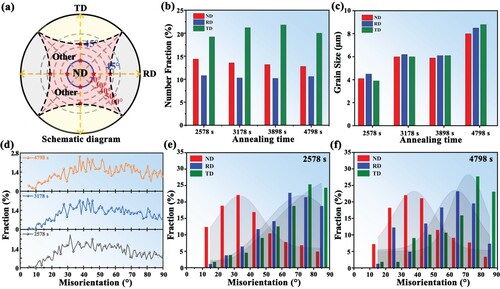
Moreover, the misorientation angle distributions of boundaries between recrystallized grains are presented in Figure (d). After annealing for 2578 s, the misorientation angle distributions exhibit a peak at ∼30°. As the annealing time increases, the frequency of boundaries with relatively low misorientation angles (<45°) decreases, indicating that boundaries with high misorientation angles are more mobile. Figure (e) and (f) further display the misorientation angle distributions of boundaries delineating recrystallized grains belonging to various texture components. For the ND-oriented recrystallized grains, misorientation angles are generally concentrated in the low angle range. In contrast, relatively high misorientation angles for the RD- and TD-oriented grains show higher fractions, especially for TD-oriented grains.
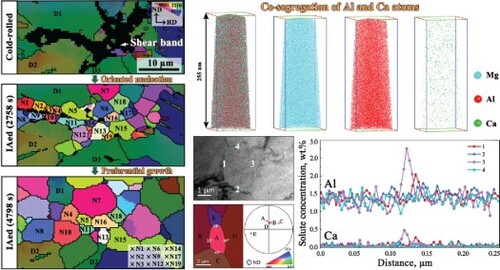
In the present work, the preferential growth is independent of the grain size advantage [Citation41], since the size of TD oriented grains is smaller in comparison to grains with other orientations during the early stage of recrystallization (Figure (c)). To understand the relationship between the preferential growth of TD-oriented grains with high boundary misorientation angles and solute atoms, 3D atom probe tomography (3D-APT) and STEM are performed on the alloy annealed at 300 °C for 3178 s (Figure ). It can be seen that Al and Ca solute atoms uniformly distributed in the bulk with a concentration of 1.59 and 0.05 wt.%, respectively (Figure (a) and (b)), which are lower than the measured values for the Mg-2.2Al-0.33Ca (wt.%) alloy. As presented in Figure (c)-(e), GBs 1 and 3 exhibit relatively higher localized enrichments of Al and Ca atoms, while GBs 2 and 4 are without obvious solute segregation. Particularly, the local concentrations of Al and Ca atoms at GB 3 are up to 2.5 and 0.5 wt.%, respectively. In comparison to the individual segregation of Al or Ca atoms, such a co-segregation of Al or Ca atoms is expected to result in a greater reduction of boundary energy and a larger dragging effect, making the GB much less mobile [Citation26].
Figure 5. 3D-APT and STEM results of the alloy annealed at 300 °C for 3178 s. (a, b) 3D atom maps showing the distribution of Mg, Al and Ca. (c) Bright-field (BF) images and (d) HAADF-STEM images of the boundaries highlighted by the blue dashed line in (c), (e) EDX results displaying the distribution of Ca and Al solute atoms along GBs in (d), and (f) Transmission kikuchi diffraction (TKD)-IPF and (0001) PF of the area highlighted by the yellow rectangle in (c).
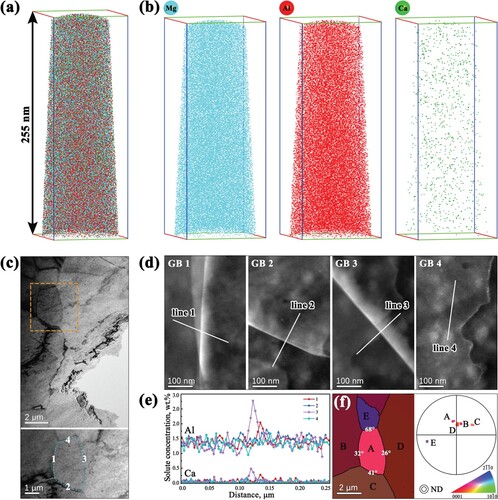
Further, the TKD-IPF map and (0001) PF shown in Figure (f) suggest that the orientations of grains A, B, and D are close to basal orientations, with the boundaries (GBs 1 and 3) between them having low misorientation angles of 32° and 26°, respectively. By contrast, grains C and E belong to the non-basal orientations, with higher misorientation angles (41° and 68°). It is evident that boundaries with relatively low misorientation angles tend to exhibit higher solute concentrations (Figure S4). In other words, the boundary segments between basal-oriented grains are more susceptible to inducing solute segregation. i.e. anisotropic segregation has occurred. The segregation depends on the boundary energy and the corresponding grain boundary excess volume [Citation42,Citation43]. According to G. Gottstein and L. Shvindlerman [Citation44], the segregation at grain boundaries is determined by the structure of the grain boundary, i.e. different GB structures show distinct sensitivity to GB segregation due to their different energies. Zeng et al. [Citation26] proposed that segregation strongly tends to occur at the high-energy boundaries of recrystallized grains with the basal orientation that would otherwise grow preferentially. Furthermore, the non-basal grains gain a growth advantage by tailoring the type and level of co-segregation, thereby achieving annealing texture weakening [Citation43]. Accordingly, it can be deduced that the co-segregation of Al and Ca atoms suppresses the growth of basal-oriented grains delineated by boundaries with relatively low misorientation angles. However, the underlying mechanisim for the preferential co-segregation of Al and Ca atoms to boundaries of basal-oriented grains needs further investigation. In contrast, the TD-oriented grains with high misorientation angles grow faster relatively, i.e. showing a preferential growth behavior, which contributes to the formation of ‘TD’ texture components.
In summary, texture weakening together with the formation of TD texture components is triggered in a dilute cold-rolled AX20 alloy during post-rolling IA, which is mainly attributed to the preferential growth of TD-oriented recrystallized grains following the TD-oriented nucleation within shear bands. Specifically, the co-segregation of Al and Ca atoms at boundaries delineating basal-oriented grains with low misorientation angles restricts the growth of basal-oriented grains and effectively facilitates the preferential growth advantage for TD-oriented grains. The findings provide an in depth understanding of texture transition in dilute Mg-Al-Ca alloys, which is potentially useful in controlling textures of dilute Mg alloys.
Supplemental Material
Download MS Word (3.9 MB)Disclosure statement
No potential conflict of interest was reported by the author(s).
Additional information
Funding
References
- Bian MZ, Sasaki TT, Nakata T, et al. Effects of rolling conditions on the microstructure and mechanical properties in a Mg-Al-Ca-Mn-Zn alloy sheet. Mater Sci Eng: A. 2018;730:147–154.
- Hua ZM, Li MX, Wang C, et al. Pre-strain mediated fast natural aging in a dilute Mg-Zn-Ca-Sn-Mn alloy. Scr Mater. 2021;200:113924.
- Chen W, Wu W, Wang W, et al. Adjusting approaches of basal texture for improvement of tension-compression asymmetry in extruded magnesium alloys. Mater Res Lett. 2023;11(7):563–570.
- Huang XS, Bian MZ, Chino Y. Improvement of deep drawing formability of Mg-6Al-1Zn magnesium alloy sheets with high strength utilizing aging precipitation. Scr Mater. 2022;215:114709.
- Li YK, Zha M, Rong J, et al. Effect of large thickness-reduction on microstructure evolution and tensile properties of Mg-9Al-1Zn alloy processed by hard-plate rolling. J Mater Sci Technol. 2021;88:215–225.
- Nakata T, Li ZH, Sasaki TT, et al. Role of grain boundary segregation on microstructural development in basal-textured Mg-Al-Zn alloy sheet. Scr Mater. 2022;218:114828.
- Robson JD, Haigh SJ, Davis B, et al. Grain boundary segregation of rare-earth elements in magnesium alloys. Metall Mater Trans A. 2016;47(1):522–530.
- Zhao LY, Yan H, Chen RS, et al. The preferential growth and related textural evolution during static recrystallization in a cold-rolled Mg–Zn–Gd alloy. J Magnes Alloy. 2021;9(3):818–828.
- Guan DK, Rainforth WM, Gao JH, et al. Individual effect of recrystallisation nucleation sites on texture weakening in a magnesium alloy: Part 1- double twins. Acta Mater. 2017;135:14–24.
- Guan DK, Rainforth WM, Ma L, et al. Twin recrystallization mechanisms and exceptional contribution to texture evolution during annealing in a magnesium alloy. Acta Mater. 2017;126:132–144.
- Peng R, Xu C, Li Y, et al. Multiple-twinning induced recrystallization and texture optimization in a differential-temperature-rolled AZ31B magnesium alloy with excellent ductility. Mater Res Lett. 2022;10(5):318–326.
- Robson JD, Henry DT, Davis B. Particle effects on recrystallization in magnesium-manganese alloys: Particle-stimulated nucleation. Acta Mater. 2009;57(9):2739–2747.
- Robson JD, Henry DT, Davis B. Particle effects on recrystallization in magnesium-manganese alloys: Particle pinning. Mater Sci Eng: A. 2011;528(12):4239–4247.
- Yan H, Xu SW, Chen RS, et al. Twins, shear bands and recrystallization of a Mg-2.0%Zn-0.8%Gd alloy during rolling. Scr Mater. 2011;64(2):141–144.
- Zhao LY, Yan H, Chen RS, et al. Orientations of nuclei during static recrystallization in a cold-rolled Mg-Zn-Gd alloy. J Mater Sci Technol. 2021;60:162–167.
- Kim YM, Mendis C, Sasaki T, et al. Static recrystallization behaviour of cold rolled Mg-Zn-Y alloy and role of solute segregation in microstructure evolution. Scr Mater. 2017;136:41–45.
- Zeng X, Minárik P, Dobroň P, et al. Role of deformation mechanisms and grain growth in microstructure evolution during recrystallization of Mg-Nd based alloys. Scr Mater. 2019;166:53–57.
- Basu I, Al-Samman T. Triggering rare earth texture modification in magnesium alloys by addition of zinc and zirconium. Acta Mater. 2014;67:116–133.
- Choi SW, Won JW, Lee S, et al. Deformation twinning activity and twin structure development of pure titanium at cryogenic temperature. Mater Sci Eng: A. 2018;738:75–80.
- Guan D, Rainforth WM, Gao J, et al. Individual effect of recrystallisation nucleation sites on texture weakening in a magnesium alloy: Part 2- shear bands. Acta Mater. 2018;145:399–412.
- Bhattacharyya JJ, Agnew SR, Muralidharan G. Texture enhancement during grain growth of magnesium alloy AZ31B. Acta Mater. 2015;86:80–94.
- Mackenzie L, Pekguleryuz M. The recrystallization and texture of magnesium-zinc-cerium alloys. Scr Mater. 2008;59(6):665–668.
- Lee SW, Park SH. Static recrystallization mechanism in cold-rolled magnesium alloy with off-basal texture based on quasi in situ EBSD observations. J Alloy Compd. 2020;844:156185.
- Li X, Li X, Kure-Chu S-Z, et al. A comparative study on the static recrystallization behavior of cold-rolled Mg-3Al-1Zn alloy stimulated by electropulse treatment and conventional heat treatment. Metall Mater Trans A. 2018;49(2):613–627.
- Pei R, Zou Y, Wei D, et al. Grain boundary co-segregation in magnesium alloys with multiple substitutional elements. Acta Mater. 2021;208:116749.
- Zeng ZR, Zhu YM, Xu SW, et al. Texture evolution during static recrystallization of cold-rolled magnesium alloys. Acta Mater. 2016;105:479–494.
- Steiner MA, Bhattacharyya JJ, Agnew SR. The origin and enhancement of {0001} <11-20> texture during heat treatment of rolled AZ31B magnesium alloys. Acta Mater. 2015;95:443–455.
- Bian M, Nakatsugawa I, Matsuoka Y, et al. Improving the mechanical and corrosion properties of pure magnesium by parts-per-million-level alloying. Acta Mater. 2022;241:118393.
- Wang QH, Jiang B, Tang AT, et al. Unveiling annealing texture formation and static recrystallization kinetics of hot-rolled Mg-Al-Zn-Mn-Ca alloy. J Mater Sci Technol. 2020;43:104–118.
- Zeng ZR, Bian MZ, Xu SW, et al. Texture evolution during cold rolling of dilute Mg alloys. Scr Mater. 2015;108:6–10.
- Guan DK, Liu XG, Gao JH, et al. Exploring the mechanism of “Rare Earth” texture evolution in a lean Mg-Zn-Ca alloy. Sci Rep-Uk. 2019;9:1–11.
- Li LC, Suh BC, Suh JS, et al. Static recrystallization behavior of the cold-rolled Mg-1Al-1Zn-0.1Ca-0.2Y magnesium alloy sheet. J Alloy Compd. 2023;938:168508.
- Zhang Y, Jiang H, Kang Q, et al. Microstructure evolution and mechanical property of Mg-3Al alloys with addition of Ca and Gd during rolling and annealing process. J Magnes Alloy. 2020;8(3):769–779.
- Huang XD, Xin YC, Cao Y, et al. Understanding the mechanisms of texture evolution in an Mg-2Zn-1Ca alloy during cold rolling and annealing. Int J Plast. 2022;158:103412.
- Hua ZM, Zha M, Meng ZY, et al. Rapid dislocation-mediated solute repartitioning towards strain-aging hardening in a fine-grained dilute magnesium alloy. Mater Res Lett. 2022;10(1):21–28.
- Jin ZZ, Zha M, Wang SQ, et al. Alloying design and microstructural control strategies towards developing Mg alloys with enhanced ductility. J Magnes Alloy. 2022;10(5):1191–1206.
- Barnett MR, Nave MD, Bettles CJ. Deformation micro-structures and textures of some cold rolled Mg alloys. Mater Sci Eng: A. 2004;386(1-2):205–211.
- Levinson A, Mishra RK, Doherty RD, et al. Influence of deformation twinning on static annealing of AZ31 Mg alloy. Acta Mater. 2013;61(16):5966–5978.
- Bian M, Huang X, Chino Y. Substantial improvement in cold formability of concentrated Mg–Al–Zn–Ca alloy sheets by high temperature final rolling. Acta Mater. 2021;220:117328.
- Stanford N, Barnett MR. The origin of “rare earth” texture development in extruded Mg-based alloys and its effect on tensile ductility. Mat Sci Eng a-Struct. 2008;496(1-2):399–408.
- Abrivard G, Busso EP, Forest S, et al. Phase field modelling of grain boundary motion driven by curvature and stored energy gradients. Part II: Appl Recrystallisation Philos Mag. 2012;92(28-30):3643–3664.
- Dillon SJ, Rohrer GS. Mechanism for the development of anisotropic grain boundary character distributions during normal grain growth. Acta Mater. 2009;57(1):1–7.
- Pei R, Zou Y, Zubair M, et al. Synergistic effect of Y and Ca addition on the texture modification in AZ31B magnesium alloy. Acta Mater. 2022;233:117990.
- Gottstein G, Shvindlerman LS. Grain boundary migration in metals: thermodynamics, kinetics, applications, Second Edition. Boca Raton: Materials Science and Technology; 1999.