
 ?Mathematical formulae have been encoded as MathML and are displayed in this HTML version using MathJax in order to improve their display. Uncheck the box to turn MathJax off. This feature requires Javascript. Click on a formula to zoom.
Abstract
A multi-physics simulation model has been established to investigate the influence of Laser powder bed fusion parameters on the spatial composition distribution and grain growth mechanism of the single-track printed dissimilar alloys. Our study shows that alloy composition gradient isosurfaces can be used to visualize the spatial distribution of alloy composition for miscible dissimilar alloys. When the melt pool aspect ratio changes from large to small, the grain growth transitions from the temperature gradient mode to composition gradient mode and then to the mixed mode. Our experimental observations show that in extreme cases, the curved grain angle can reach 272°.
GRAPHICAL ABSTRACT

IMPACT STATEMENT
The study found that the composition gradient of dissimilar alloys can dominate grain growth, which is entirely different from the conventional temperature gradient-dominated grain growth mechanism.
1. Introduction
Laser powder bed fusion (LPBF) uses laser beams to selectively melt microscopic metal/alloy powder on a flat powder bed [Citation1–3]. This technology can also be used for joining or cladding two dissimilar metals/alloys. However, in the process of printing one metal/alloy layer onto another dissimilar metal/alloy base using LPBF, the mismatch of thermophysical and chemical properties may lead to interface cracks [Citation4,Citation5] or detachment [Citation6,Citation7]. Studies have shown that the interlocking wavy interface (or transition range) between dissimilar alloys can help improve the interface bonding strength [Citation8–10], and produce curved grains. Compared with typical grain morphologies, curved grains have the potential to increase high-temperature creep and fatigue life [Citation11,Citation12].
Cladding one alloy onto another using laser powder bed fusion produces many interesting physical phenomena, such as exotic alloy composition distributions and grain (grain boundary) shapes [Citation13–15]. Behind these physical phenomena lie many fundamental physics problems to be explained and studied, but there are still few related types of research. Some research tries to construct a complex spatial composition distribution of alloys to improve the bonding strength of the dissimilar alloy joining regions [Citation16–18]. To obtain the composition distribution characteristics with composition diffusion, it is necessary to understand the flow and solidification process of the dissimilar alloys’ melt pool through computational simulation. Tang et al. [Citation19] proposed an LPBF computational framework for simulating multiple materials, accounting for the physical details of multi-physics and multi-materials such as composition diffusion, etc. Through simulation and experiments, Yao et al. [Citation20] found that when IN718 powder is laser cladded on 316L substrate, the interface between IN718 and SS316 appears a ‘fish scale' structure and produces curved grains. They found that the degree of alloying (DoA) between two dissimilar alloys affects grain growth. It is worth noting that the study by Yusuf et al. [Citation12] showed that there are curved grains in the transition region between IN718 powder and SS316 substrate. But they did not explain the reason for the formation of curved grains. So far, only Yao et al. have conducted a preliminary analysis of the reasons for the formation of curved grains, and few other researchers have studied this mechanism in depth.
In our current study, a multi-material model has been developed. Through the multi-material simulations and various experimental tests, we can better grasp the 3D spatial characteristics of the dissimilar alloy composition distributions and the influence of alloy composition on the microstructure.
2. Theoretical background
To reasonably describe the thermophysical phenomena in the LPBF process, the buoyancy flow, thermal radiation, microfluidic forces (recoil pressure and Marangoni force etc.) and diffusion of alloy components are taken into consideration [Citation21]. The alloy melt is assumed to be a Newtonian incompressible fluid. The model does not consider the mass loss caused by evaporation, and the dissimilar alloys’ composition diffusion follows Fick's diffusion law. The thermophysical properties of the two dissimilar alloys after the mixing are calculated by mixture rule (i.e. solidus and liquidus temperatures). See the Supplementary for specific equations and details. The physical properties of dissimilar alloys are listed in Supplementary Table 1. The simulated laser power (L) is 100, 200 and 300 W, respectively. The laser scan velocity (V) ranges from 900, 1200 and 1500 mm/s.
We use Inconel718 (IN718) powder to print a single track on a SS316L (316L) substrate. IN718 powder was manufactured by Coatecs Pte Ltd using the aerosolization method. In our experimental analysis, the single tracks were cut to reveal the cross-sections of interest. Energy dispersive X-Ray spectroscopy (EDS) and Electron backscattering diffraction (EBSD) mapping were performed on the polished single-track cross-sections to obtain the alloys composition distribution and grain orientation maps. See the Supplementary for more details. Further comparison between the simulations and experiments on single-track width (Wm) and depth (Dm) shows a relative error of less than 10.8% (see Supplementary Table 2), indicating good conformance of simulation to the experiment.
3. Results and discussion
3.1. Spatial distribution characteristics of dissimilar alloys
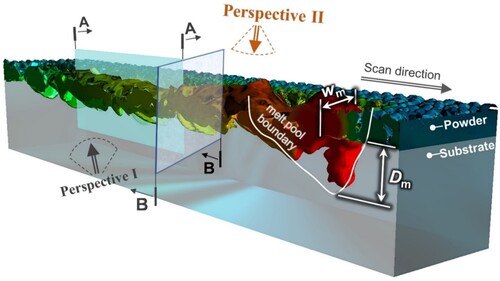
It is challenging to characterize the spatial distribution of components in miscible alloys (IN718/316L) during additive manufacturing of dissimilar alloys. We take the cross-sections A-A and B-B in the melt pool to analyze the movement and distribution of IN718 powder and 316L substrate, see Figure .
Figure 1. Schematic diagram of a single track. The cross-section A-A is parallel to the scan direction and perpendicular to the substrate. The cross-section B-B is perpendicular to the scan direction and the substrate. The melt pool depth (Dm) is the distance from the melt pool bottom to the substrate top. The melt pool width (Wm) is the track width on the substrate top.
To verify the accuracy of the dissimilar alloy composition distribution obtained by the simulation, we extracted the composition distribution on the cross-section A-A [in Figure ] of the single-track in the experiment and compared it with the numerical simulation. The experimental and simulation results show that the IN718 composition distribution takes on the shape of a curved strip due to the Marangoni force. We took 3 points (A, B, C) at the approximate corresponding positions in Figure (a,b) to extract the Ni element content and compare the difference between EDS and simulation. The error of Ni element content obtained by EDS and simulation at points A, B and C is less than 6%. The numerical simulation results of the diffusion trend are very close to the experimental results [Figure (a,b)], indicating that the numerical method in this paper can accurately simulate the complex composition distribution caused by microfluidic forces and composition diffusion.
Figure 2. Alloy composition distributions obtained from single-track experiments (a) and simulations (b) on cross-sections A-A with L = 100 W and V = 300 mm/s. Fe and Ni are the principal elements in 316L (Fe 65.5%, Ni 12.5%) and IN718 (Fe 16.9%, Ni 52.5%) respectively. For the clarity purpose, we refer to Fe (in red brown) rich area as the representation of 316L, and Ni (green) rich area as the representation of IN718. The 2D component gradient distribution (c) and their corresponding 3D component gradient isosurface shape (d) of 316L/IN718 is obtained from our numerical simulations. Figure (d) is viewed from viewing angle I in Figure . In Figures (a) and (b), the positions of points A, B and C, indicated by the arrows, are used for extracting the Ni element content.
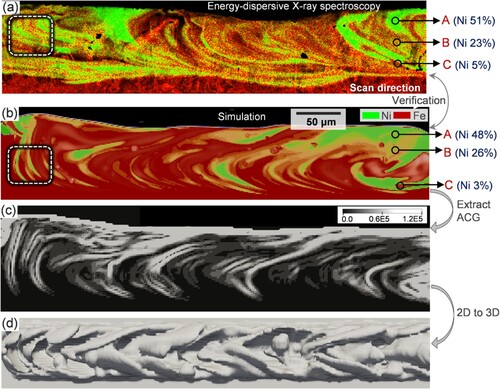
From the experiments conducted, we observed the alloy composition distribution characteristics from a 2D perspective [Figure (a)], but the spatial characteristics of the alloy composition distribution cannot be observed from a 3D perspective. Notably, the dissimilar alloy composition gradients exhibit a curved stripe shape from the simulated 2D perspective [Figure (c)]. Comparing Figure (c) with (b), it can be observed that the composition gradient (the rate at which the mass fraction of alloy composition increases/decreases per unit length) and composition distribution are well connected, with 316L and IN718 being the main components on both sides of the composition gradient, respectively. It is observed that the composition gradient isosurface of the dissimilar alloys can reflect the spatial characteristics of the main component distribution. To this end, we choose the composition gradient isosurface of dissimilar alloys to describe the 3D spatial characteristics of the composition distribution. Here, an isosurface with an alloy composition gradient (ACG) of 100 000 wt%/m is used to illustrate the 3D spatial characteristics of the dissimilar alloy composition distribution. It is found that the spatial distribution of alloy components presents a staggered and overlapped shape [Figure (d)]. The observed isosurface shape closely resembles the ‘fish scale' interface proposed previously [Citation20]. The difference lies in the fact that the numerical simulation method used here takes into account component diffusion. Therefore, the composition gradient isosurface utilized to describe the main component distribution of the alloy, which provides a closer representation of the actual situation.
3.2. Alloy composition gradient dominates grain growth and grain characteristics
Our research from two years ago revealed that the degree of alloying (DoA) between two dissimilar alloys affects grain growth, leading us to an important conclusion that the alloy composition dominates grain growth [Citation20]. After further research in this paper, it is found that the alloy composition is an essential factor affecting grain growth, and the alloy composition gradient (ACG) is the essential reason for the dominant grain growth. For example, the dissimilar alloy composition distribution on the cross-section B-B [Figure ] shows that, although there is interdiffusion between the dissimilar alloys [Figure (a)], it can be observed that the position of the larger alloy composition gradient coincides with the grain boundaries of the curved grains. Therefore, the alloy composition gradient (ACG) serves as an index to evaluate the influence of alloy composition on the alloy microstructure. Figure (b) showcases the microstructure and composition distribution of the dissimilar alloy on cross-section A-A. A data extraction line was selected in the EDS image, with the reddish-brown and green colors representing pure 316L and pure IN718, respectively. The alloy composition gradient (ACG) values are indicated by the yellow line below the data extraction line. Comparing the EBSD and EDS in Figure (b), it is found that grain boundaries appear at the positions where |ACG| ≥ 100 000 along the data extraction line, leading to the formation of curved grains in various shapes. This confirms that the alloy composition gradient is the main factor affecting the grain shape.
Figure 3. Composition distribution, composition gradient and microstructure of dissimilar alloys obtained using EDS and EBSD under L = 200 W and V = 1500 mm/s, see (a). Composition distribution, composition gradient and microstructure under L = 100 W and V = 300 mm/s, see (b). Schematic diagram of curved grain angle, see (c). Curved grain shape characteristics under different process parameters, see (d). Figures (a) and (d) are extracted from the cross-section B-B. Figure (b) is extracted from the cross-section A-A. In Figure (b), EDS images are displayed in black and white, where the white and black areas represent 316L and IN718, respectively. A data extraction line is selected in the EDS image, and the positions of pure 316L and pure IN718 are represented by reddish-brown and green colors, respectively.
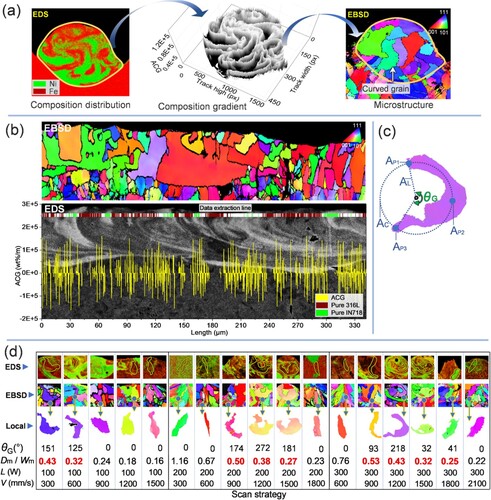
In order to quantify the shape characteristics and the generation conditions of curved grains in the dissimilar alloy LPBF process, the curved grain angle () is defined here to describe the curved grain shape. Three auxiliary points are constructed at the head (
), middle (
) and tail (
), positions curved grain. Then, the auxiliary circle (
) is determined based on these three auxiliary points. By connecting the head and tail auxiliary points (
and
) through the center of the auxiliary circle (
), two auxiliary lines (
) are obtained, and the angle between these lines is measured to determine the curved grain angle (
) [see Figure (c)]. Figure (d) is provided to illustrate the influence of different process parameters on curved grains. We selected one curved grain from each combination of processing parameters, representing the grain with the most significant curved angle in the current parameter combination. This allows us to determine the angle limit of curved grains that each process parameter can produce.
Our previous research has found that the aspect ratio (Dm/Wm) of the melt pool provides a better description of its shape characteristics. Dm/Wm is also an important index that affects the shape of the composition gradient isosurface shape and diffusion [Citation19,Citation20]. Although process parameters can control the value of Dm/Wm, different combinations of process parameters may produce the same value of Dm/Wm. This implies that distinct process parameters may yield the same shape isosurface of the alloy composition gradient. Therefore, we will use Dm/Wm as a variable to study the influence of alloy composition gradient and temperature gradient on grain shape in Figure .
Figure 4. Schematic illustration of the mechanism by which temperature gradient (a), composition gradient (b) and mixed (c) modes dominate the growth of curved grains, respectively. (a) is 200 W and 300 mm/s, (b) is 300 W and 1200 mm/s and (c) is 200 W and 1800 mm/s.
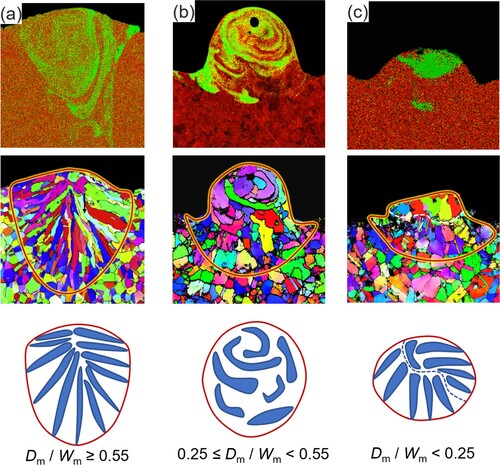
When Dm/Wm ≥ 0.55, the Marangoni force leads to a strong interdiffusion tendency of the dissimilar alloys [Dm/Wm is 1.16, 0.67 and 0.76 in Figure (d)]. Since |ACG| < 100 000 indicates no significant composition transition resulting in a temperature gradient dominating the grain growth, most grains are perpendicular to the melt pool boundary [Citation22], see Figure (a).
When 0.25 ≤ Dm/Wm < 0.55 [Figure (d)], the Marangoni force causes the dissimilar alloys in the melt pool to exhibit moderate interdiffusion tendencies. The alloy composition distribution takes on a curved strip shape a thickness of about 15 μm. It is not easy to generate multiple crystal nuclei in the 15 μm region, coupled with a large alloy composition gradient (|ACG| ≥ 100,000) that dominates the grain growth, resulting in independent curved grains with an angle of up to 272°. It is worth noting that the temperature gradient still plays a role in the grain growth process at this stage, but the influence of the composition gradient on the grain growth is more potent than that of the temperature gradient. It can also be understood that the large alloy composition gradient acts as an energy barrier in the grain growth process, and the ability of the temperature gradient to dominate the grain growth is generally insufficient to overcome this energy barrier [Figure (b)].
When Dm/Wm < 0.25, the IN718 melt has a short convective flow distance, and the recoil pressure and Marangoni force are insufficient to promote interdiffusion of the dissimilar alloys. The IN718 melt concentrates above a single track, and the alloy composition does not form narrow curved strips but rather a region of alloy aggregation (IN718 or 316L) with an equivalent diameter > 45 μm [Dm/Wm is 0.24 and 0.18 in Figure (d)]. Although |ACG| ≥ 100 000, indicating a sharp chemical transformation between dissimilar alloys, an energy barrier is still formed for grain growth, causing the grain boundaries to coincide with locations of large alloy composition gradient. However, due to the wide range of independent alloy compositions (45 μm), it is easy to form multiple crystal nuclei, resulting in the formation of large-sized grains (Dm/Wm = 0.18) in the region of self-similar composition or the appearance of small-sized grains (Dm/Wm = 0.24) dominated by temperature gradients [Figure (c)]. This is a typical mixed mode in which the composition and temperature gradient simultaneously dominate the grain growth.
4. Conclusion
Alloy composition gradient isosurfaces are essential to visualize the spatial distribution of miscible dissimilar alloy compositions. The study found that when Dm/Wm ≤ 0.55, the dissimilar alloy's composition gradient is a critical factor affecting grain growth. It is concluded that the alloy composition gradient can dominate the grain growth. It is worth noting that even when the grain growth is predominantly influenced by the alloy composition gradient, the temperature gradient still contributes to the process. However, the impact of the composition gradient on grain growth is more potent than that of the temperature gradient. In extreme cases, the curved grain angle can reach up to 272°.
Supplemental Material
Download MS Word (35.6 KB)Additional information
Funding
References
- Loterie D, Delrot P, Moser C. High-resolution tomographic volumetric additive manufacturing. Nat Commun. 2020;11(1):852. doi:10.1038/s41467-020-14630-4
- Hayat MD, Singh H, He Z, et al. Titanium metal matrix composites: an overview. Compos Part A Appl Sci. 2019;121:418–438. doi:10.1016/j.compositesa.2019.04.005
- Tan C, Chew Y, Duan R, et al. Additive manufacturing of multi-scale heterostructured high-strength steel. Mater Res Lett. 2021;9(7):291–299. doi:10.1080/21663831.2021.1904299
- Dovgyy B, Simonelli M, Pham MS. Alloy design against the solidification cracking in fusion additive manufacturing: an application to a FeCrAl alloy. Mater Res Lett. 2021;9(8):350–357. doi:10.1080/21663831.2021.1922945
- Yao LM, Xiao ZM, Huang S, et al. The formation mechanism of metal-ceramic interlayer interface during laser powder bed fusion. Virtual Phys Prototyp. 2023;18(1):2235324. doi:10.1080/17452759.2023.2235324
- Yan L, Chen Y, Liou F. Additive manufacturing of functionally graded metallic materials using laser metal deposition. Addit Manuf. 2020;31:100901.
- Zhang Y, Bandyopadhyay A. Direct fabrication of compositionally graded Ti-Al2O3 multi-material structures using laser engineered net shaping. Addit Manuf. 2018;21:104–111.
- Laurençon M, De Resseguier T, Loison D, et al. Effects of additive manufacturing on the dynamic response of AlSi10Mg to laser shock loading. Mater Sci Eng A. 2019;748:407–417. doi:10.1016/j.msea.2019.02.001
- Jeyaprakash N, Kumar MS, Yang CH. Enhanced nano-level mechanical responses on additively manufactured Cu-Cr-Zr copper alloy containing Cu2O nano precipitates. J Alloys Compd. 2023;930:167425.
- Lopes LR, Silva AF, Carneiro OS. Multi-material 3D printing: the relevance of materials affinity on the boundary interface performance. Addit Manuf. 2018;23:45–52.
- Hu Z, Gao S, Tai J, et al. Columnar grain width control for SS316L via hatch spacing manipulation in laser powder bed fusion. Mater Res Lett. 2023;11(3):231–238. doi:10.1080/21663831.2022.2140018
- Yusuf SM, Zhao X, Yang S, et al. Interfacial characterisation of multi-material 316L stainless steel/Inconel 718 fabricated by laser powder bed fusion. Mater Lett. 2021;284:128928.
- Kim ES, Park JM, Karthik GM, et al. Local composition detouring for defect-free compositionally graded materials in additive manufacturing. Mater Res Lett. 2023;11(7):586–594. doi:10.1080/21663831.2023.2192244
- Zou B, Wang L, Zhang Y, et al. Enhanced strength and ductility of metal composites with intragranularly dispersed reinforcements by additive manufacturing. Mater Res Lett. 2023;11(5):360–366. doi:10.1080/21663831.2022.2153630
- Vu IQ, Bass LB, Williams CB, et al. Characterizing the effect of print orientation on interface integrity of multi-material jetting additive manufacturing. Addit Manuf. 2018;22:447–461.
- Hahnlen R, Dapino MJ. NiTi-Al interface strength in ultrasonic additive manufacturing composites. Compos B Eng. 2014;59:101–108. doi:10.1016/j.compositesb.2013.10.024
- Huang J, Li W, He J, et al. Dual heterogeneous structure facilitating an excellent strength-ductility combination in an additively manufactured multi-principal-element alloy. Mater Res Lett. 2022;10(9):575–584. doi:10.1080/21663831.2022.2067790
- Zafari A, Xia K. Nano/ultrafine grained immiscible Fe-Cu alloy with ultrahigh strength produced by selective laser melting. Mater Res Lett. 2021;9(6):247–254. doi:10.1080/21663831.2021.1884620
- Tang C, Yao LM, Du HJ. Computational framework for the simulation of multi material laser powder bed fusion. Int J Heat Mass Transf. 2022;191:122855.
- Yao LM, Huang S, Ramamurty U, et al. On the formation of “Fish-scale” morphology with curved grain interfacial microstructures during selective laser melting of dissimilar alloys. Acta Mater. 2021;220:117331.
- Yao LM, Xiao ZM, Ramesh A, et al. On the melt pool flow and interface shape of dissimilar alloys via selective laser melting. Int Commun Heat Mass Transf. 2023;145:106833.
- Yao LM, Ramesh A, Xiao ZM, et al. Multimetal research in powder bed fusion: a review. Materials (Basel). 2023;16(12):4287. doi:10.3390/ma16124287