
 ?Mathematical formulae have been encoded as MathML and are displayed in this HTML version using MathJax in order to improve their display. Uncheck the box to turn MathJax off. This feature requires Javascript. Click on a formula to zoom.
Abstract
Micro-laser beam powder-bed-fusion (µL-PBF) technique offers the capability to fabricate metallic components with enhanced surface quality and geometrical accuracy through refinement of processing parameters. Here, we elucidate the interrelated nature governing the scale-down of processing parameters and the evolution of solidification microstructures in a µL-PBF fabricated 316L stainless steel. We reveal the formation of two distinct cellular structures displaying different chemical segregations and dislocation arrangements within molten pools. Our findings underline the importance of chemical heterogeneity in modulating the evolution of dislocation structures, a phenomenon attributed to the intrinsic thermal gradients and unique thermal histories associated with the µL-PBF technique.
GRAPHICAL ABSTRACT
1. Introduction
The laser beam powder-bed-fusion (L-PBF) technique offers great advantages in fabricating innovative products with superior mechanical properties [Citation1–3]. However, with the increasing demand for product miniaturization, e.g. micro-mechanical devices, conventional PBF-LB (cL-PBF) techniques can no longer meet the high requirements on the feature resolution, surface quality, and geometrical accuracy [Citation4,Citation5]. Therefore, micro L-PBF (μL-PBF) techniques were developed to satisfy the above-mentioned requirements [Citation6–9]. μL-PBF techniques take the strategy of refining processing parameters, such as the beam size (<25 μm), layer thickness (<10 μm), and particle size (<25 μm) [Citation10]. It is noteworthy that the finer processing parameters could lead to significant variations in microstructures, e.g. smaller molten pool geometry, higher temperature gradient, and longer thermal history, from that in the conventional process [Citation8,Citation10–12].
As one of the most widely used engineering alloys, 316L stainless steel (SS) is often selected as a model material for AM processing studies. Similar to the cL-PBF counterparts, the solidification cellular structures of μL-PBF 316L SS samples also possess high-density dislocations and chemical segregations [Citation8]. Besides, μL-PBF samples show higher strength compared with cL-PBF counterparts due to the finer cellular structures [Citation8]. Nevertheless, Fu et al. [Citation11] reported that the yield strength of μL-PBF samples is slightly lower than the conventionally manufactured ones, which is ascribed to the micro-segregation difference in the cellular structures. Such contradictory results indicate that the established relationships between microstructure and mechanical properties for the cL-PBF samples cannot be directly equated to that of μL-PBF parts. As a crucial step towards the engineering application, the effects of refining processing parameters on the resultant microstructures should be comprehensively investigated.
In this work, we performed dedicated characterizations of the solidification microstructures in 316L SS manufactured by μL-PBF. Results reveal that two distinct cellular structures, exhibiting different dislocation arrangements and chemical heterogeneity, are formed within the molten pool (MP), which were seldom reported in the cL-PBF counterparts. We further explored the underlying mechanisms responsible for such distinct microstructures. Our findings extend the current understanding of solidification microstructure evolution in μL-PBF 316L SS, which could provide crucial knowledge on tailoring the microstructure and enhancing the mechanical properties of μL-PBF components.
2. Materials and methods
The 316L SS plate was manufactured by the μL-PBF technique in a high-purity argon environment using a Precision 100 instrument (Aixway3d, Germany). A focused laser beam with a spot size of 20 μm, particle size ranging from 2 to 15 μm (D50 = 12.6 μm), and a small layer thickness (10 μm) were employed to obtain high feature resolution. After the optimum processing parameters (laser power: 50 W, scanning speed: 1000 mm/s, hatch spacing: 40 μm), bulk samples with high density, good surface quality, and exceptional mechanical properties were obtained, as listed in Table . The surface roughness was probed by the Alpha-Step D-600 Stylus Profiler. Tensile tests were performed on dog-bone-shaped samples (gauge dimensions of 8 × 2 × 1.5 mm3) using the ZwickRoell Z020 instrument. Besides, the chemical composition of the μL-PBF sample, measured by an X-ray fluorescence spectrometer (ARL Perform’X), is Fe-17.02Cr-11.02Ni-2.13Mn-2.36Mo-2.72Si (in wt.%).
Table 1. Density, top surface roughness, and mechanical properties of μL-PBF samples.
The microstructural characterizations were conducted using a Zeiss Axiolab 5 optical microscope (OM), and a Zeiss Gemini 460 scanning electron microscope (SEM) including electron backscatter diffraction (EBSD) and electron channeling contrast imaging (ECCI). High-angular resolution EBSD (HR-EBSD) was performed to measure the distributions of residual stress and geometrically necessary dislocation (GND). Detailed information on ECCI and HR-EBSD can be found elsewhere [Citation13,Citation14]. To enhance the image contrast, the samples were etched using a Glaenzer solution (HF and H2O2 in 1:9) for 25 mins. The topographies of etched samples were measured using a Dimension Icon atomic force microscope (AFM). The chemical information of cellular structures was probed by energy-dispersive X-ray spectroscopy (EDS) using a Talos F200i transmission electron microscopy (TEM) at 200 kV, equipped with a Bruker X-flash detector. TEM samples were prepared by focused ion beam (FIB) via Thermo Fisher Helios 5UX.
3. Results and discussion
The dimensions of MPs in the μL-PBF sample, measured from the top surface (Figure (a)), are 45-55 µm in depth and 25-35 µm in half width, which are much smaller than the cL-PBF samples (e.g. 90 µm in depth and 72.5 µm in half width [Citation15]). Figure (b) displays EBSD-inverse pole figure (IPF) maps from three normal planes. Grains exhibit a chessboard pattern in the surface perpendicular to the building direction (BD) (┴BD), while both columnar and Chevron-shaped grains are observed in the surfaces parallel to BD (∥BD). The average grain size, defined by high-angle grain boundaries (HAGBs, > 10°), is estimated to be 16.36 µm based on IPF maps of three normal planes. Additionally, a stronger <110>∥BD texture is detected in the studied μL-PBF sample, compared with the cL-PBF samples [Citation16,Citation17]. The stronger texture could be attributed to the finer MP size and smaller layer thickness [Citation11], which result in a high cooling rate, weak Marangoni effect, and low recoil pressure. These factors altogether promote the epitaxial growth of grains with similar orientations.
Figure 1. Microstructure overview of the 316L stainless steel (SS) sample manufactured by micro-laser beam powder-bed-fusion (μL-PBF). (a) Vertical-sectional optical microscope (OM) image of the etched sample, (b) A 3D reconstruction of EBSD inverse-pole figure (IPF) maps. (c) Secondary electron (SE) images of the etched sample from (c1) ∥BD and (c2) ┴BD surfaces. (d) Backscattered electron (BSE) images and (e) the corresponding IPF maps displaying representative microstructure of MP. (f1-f3) BSE images showing the cellular structures after etching. Black dashed lines highlighting the molten pool boundaries (MPBs) and white dashed lines indicating the inner pool boundaries (IPBs). Red dashed lines in (e1) and (e2) highlighting the IPBs that are overlapped with grain boundaries.
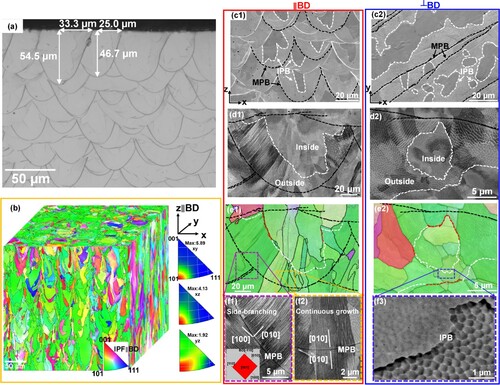
More importantly, two distinct etched features are observed within MPs, as shown in the secondary electron (SE) images from both ∥BD and ┴BD surfaces (Figure (c1) and (c2)). The MP boundaries (MPBs) are highlighted by black dashed lines. As a comparison, the boundaries separating the distinct etched features within MPs are highlighted by white dashed lines, which are referred to as inner pool boundaries (IPBs) and, hereafter. Figure (d) and (e) depict the enlarged backscattered electron (BSE) images and the corresponding IPF maps from both views. It can be seen that most grains maintain their crystal orientation across MPBs due to the epitaxial grain growth [Citation15]. Moreover, the cellular structures in these regions can be well elicited by the Glaenzer solution, as shown in Figure (f1) and (f2). In the centerline of MPs (Figure (f2)), cellular solidification occurs along the preferred <100 > direction in terms of continuous epitaxial growth due to the continuous heat flux between consecutive layers. This leads to the formation of slender columnar grains. In contrast, the dramatic change of thermal gradient on the sides of MPs facilitates the cellular cells to change their growth direction by side-branching along orthogonal <100 > directions (but belong to the same crystal orientation), as shown in Figure (f1). Compared with the cL-PBF sample, the thermal gradient varies more significantly along the MPB due to the smaller MP size and the larger MPB curvature in the µL-PBF sample. Consequently, side-branching becomes more dominant in the µL-PBF sample, resulting in the substantial broadening of grains and the formation of aforementioned Chevron-shaped grains [Citation15]. Additionally, the averaged cellular size near MPB is measured to be 275.2 ± 24.6 nm (based on ECC images on the {100} direction), which is comparatively finer than that in the cL-PBF samples (ranging from 400 to 1000 nm [Citation18–21]). This result indicates a higher cooling rate in the µL-PBF sample, according to the relationship between cellular size λ and cooling rate , i.e. λ = 80
−0.33 [Citation22].
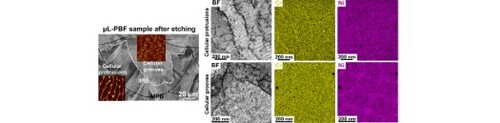
In comparison with the MPBs, large amounts of IPBs are observed to align along grain boundaries (GBs), i.e. variations of grain orientation across IPBs, as highlighted by red dashed lines in Figure (e1) and (e2). Furthermore, distinct etched morphologies are found across the IPBs, as depicted in the enlarged BSE image (Figure (f3)). The topographies of these distinct etched features, probed by AFM, are presented in Figure (a) and (b). It becomes evident that the regions outside and inside the IPBs exhibit cellular protrusions and cellular grooves, respectively. To understand the reason for forming such two distinct etched features, TEM foils were extracted from these two regions using FIB, as shown in Figure (c). In the cellular protrusion region, high-density dislocation walls/cells along with Cr segregation are detected in the cellular protrusion regions (Figure (d1-d4)), which are similar to that reported in the cL-PBF counterparts [Citation19]. The formation of cellular protrusions can be attributed to the enhanced chemical stability of cellular structures relative to interiors, primarily due to the presence of Cr segregation. In contrast, dislocations in the cellular groove regions are more loosely arranged (Figure (e1)). Moreover, segregation of Ni accompanied with slight Cr depletion is periodically probed in the groove regions (Figure (e2-e4)), which are consistently observed in two additional TEM characterizations of these regions. The formation of grooves after etching could be ascribed to the minor Cr depletion. The smaller height difference of the cellular grooves (∼5 nm, Figure (b2)), compared to that of the cellular protrusion (∼30 nm, Figure (a2)), further supports the aforementioned assumption.
Figure 2. (a1, b1) Atomic force microscope (AFM) topographical maps and (a2, b2) corresponding profiles along the white arrows in (a1, b1). (c) SE image illustrating the location of TEM foil. (d1, e1) Bright field (BF) images demonstrating the dislocation structures of (d1) cellular protrusion and (e1) cellular groove regions. (d2, d3, e2, e3) energy dispersive spectroscopy (EDS) maps showing the chemical information of (d2, d3) cellular protrusion and (e2, e3) cellular groove regions. (d4, e4) EDS profiles along the white arrows in (d1, e1), respectively.
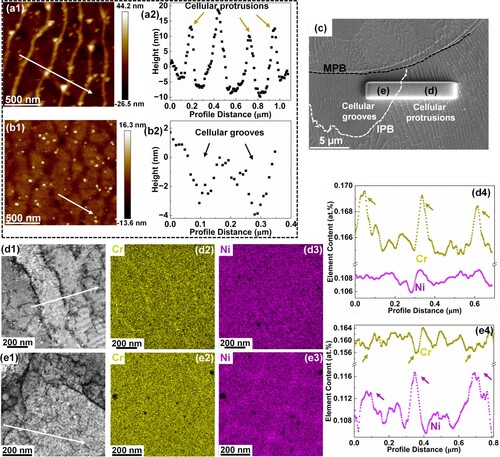
As the micro-segregation is considered as an indicator of cellular solidification [Citation23], the periodic presence of Cr/Ni-segregation manifests that cellular solidification occurs both on the exterior (cellular protrusion region) and the interior (cellular groove region) of IPBs. Besides, the average spacing of cellular grooves (∼300 nm) is slightly larger than that of the cellular protrusions (∼275 nm), indicating a slower cooling rate within the interior of IPB. It should be emphasized that the underlying mechanism responsible for the distinct solute segregations remains an open question, which is the topic of ongoing work.
We further conducted dedicated characterizations of the dislocation structures using ECCI in conjunction with HR-EBSD, a representative example is given in Figure . The etched morphology of the selected area is attached in supplementary Figure S1(a), enabling us to identify the positions of cellular protrusions and grooves, as exemplified by blue and red rectangles in Figure (a), respectively. Similar to the TEM observations, dislocations in the cellular protrusion regions form well-structured dislocation walls (Figure (b)), while dislocations in the cellular groove region are loosely-arranged (Figure (c)). Comparing the ECC images before and after etching reveals that dislocation walls generally overlap with the cellular protrusions but not all the cases, e.g. the regions highlighted by red rectangles in supplementary Figure S1(b) and (c). Given that the cellular protrusion can serve as an indicator of Cr segregation, the observed discrepancy between the dislocation structure and the cellular protrusion supports the assumption, albeit indirectly, that the micro-segregation should be formed during the cellular solidification process rather than due to solid-state diffusion to the pre-existing dislocation structures [Citation24]. In contrast, the loosely-arranged dislocation structures, in most cases, are not overlapped with the cellular grooves (displaying dark contrast in Figure (d)), e.g. the ones highlighted by yellow dashed lines. This result suggests that the formation of cellular grooves is not a result of dislocation structures but, instead, may be attributed to the aforementioned chemical perturbations.
Figure 3. (a-d) ECC images: (a) overview of the selected area, (b, c) enlarged ECC images displaying dislocation structures of (b) cellular protrusion and (c) cellular groove regions, (d) ECC image of cellular groove region after etching; (e-f) HR-EBSD results: (e) GND distribution of the selected area, (f) GND profiles along the white arrows in (b) and (c), (g) residual stress distribution of the selected area. Yellow dashed lines in (d) revealing that the cellular grooves and dislocation structures are not overlapped. Black dots in (e, g) are the selected reference points for cross-correlation processing.
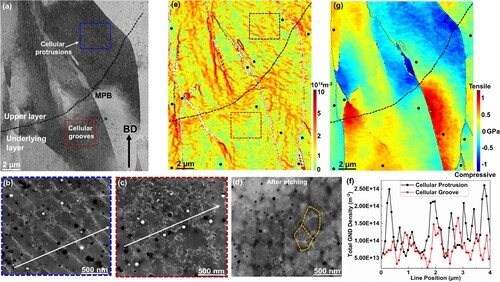
Figure (e) displays the distribution of GND density of the selected area. A relatively high GND density is probed along the MPB, which could be raised by the strain mismatch between different layers caused by the thermal gradient variations. Additionally, the GND density in the cellular protrusion regions surpasses that in the cellular groove regions. As shown in Figure (f), the GND profiles of the cellular protrusion regions (along white arrow in Figure (b)) exhibit a magnitude of approximately 2-2.5 × 10¹⁴m−2, roughly double the density measured in the cellular groove regions (along white arrow in Figure (c), ∼1 × 10¹⁴m−2). Figure (g) depicts that the intragranular residual stresses (σ11, parallel to BD) in the upper and underlying layer show opposite signs, i.e. compressive and tensile residual stresses, respectively. Note that, the cyclic thermal expansion and contraction after solidification were reported as influential factors in the formation of dislocation structures [Citation24]. However, considering the similar absolute values of residual stresses, it could be deduced that the distinct dislocation structures cannot be solely attributed to the heterogeneously distributed intergranular stress.
Figure (a)-(c) present a crystallographic analysis of the solidification behaviors across IPBs. Owing to the increased perturbations in thermal profiles, grains might undergo orientation variations across IPBs, as highlighted by red dashed lines in Figure (a). From the stereographic projections of the studied grains, the growth direction of solidification cells can be determined, as illustrated in Figure (b) and (c). Generally, the cells grow with the preferred <100 > direction on the outside of the IPB region. However, within the intricate local thermal gradients inside IPBs, the <100 > direction might no longer be the preferable direction. For example, in the upper portion of Figure (c), the growth direction of solidification cells varies from [100] (red line) to [−101] (yellow line) across IPBs. Interestingly, the grain maintains its orientation across the IPB marked by white dashed lines in Figure (c). Additionally, for the IPB at the bottom of Figure (c), cells from both sides maintain the growth direction of <100 > orientation, but the grain orientation changes across IPB (indicated by red dashed line). Therefore, both cases do not conform to the typical epitaxial grain growth as reported in literatures [Citation15,Citation25]. These results concurrently highlight the significant fluctuations in local thermal gradients of the µL-PBF sample, which exert a substantial influence on the cellular solidification behavior within IPBs.
Figure 4. (a) IPF map and (b) the corresponding SE image of a selected molten pool. (c) Enlarged SE image in conjunction with stereographic projections to determine the growth directions of solidification cells. (e1) Schematic sketch of the thermal profile in the uL-PBF sample. (e2-e4) Schematics of solidification structure evolution in µL-PBF sample.
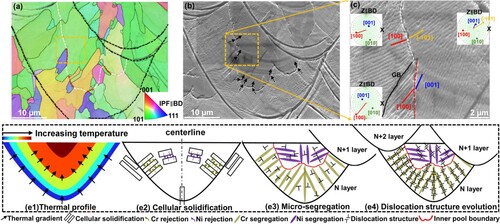
Based on these experimental observations, the formation mechanisms of distinct cellular structures within MPs are schematically illustrated in Figure (e1-e4). Compared with cL-PBF counterparts, higher thermal gradients and more complex thermal perturbations are expected in the µL-PBF samples, as demonstrated in Figure (e1), which play a decisive role in modulating the evolution of solidification structures. As depicted in Figure (e2), cellular solidification initiates from the MPBs. Owing to the high thermal gradient, side-branching epitaxial growth prevails, and the average cell size is finer in the µL-PBF samples. Driven by the imbalance in solute solubility, Cr solutes are rejected from the solid to the solid/liquid surface, resulting in periodic Cr-segregation. Subsequently, the chemical imbalance is altered, somehow, by the complex thermal perturbations when the solidification tips reach the IPBs. Consequently, Ni rejection occurs during the solidification process inside IPBs, resulting in the Ni-periodicity (accompanied with Cr-depletion), as illustrated in Figure (e3). Note that, the presence of Ni-segregation might also be caused by the intrinsic thermal treatment of µL-PBF technique (e.g. subsequent strain ageing). Nevertheless, due to the limited experimental data, the origin of such chemical heterogeneity needs to be explored further. After that, dislocations are nucleated and rearranged to form energetically-favorable structure in response to the cyclic thermal expansion and shrinkage [Citation24], as demonstrated in Figure (e4). Due to the strong pinning effect of Cr, the dislocation structures on the outside of IPBs gradually evolve into well-arranged dislocation cells/walls, which overlap with the Cr-segregation. Conversely, the loosely-arranged dislocation structures and the mismatch between dislocation structures and chemical heterogeneity (Ni-segregation) within the IPB collectively indicate a lower constriction stress induced by the Ni-segregation.
4. Conclusion
In summary, we observe the formation of two distinct cellular structures in the 316L stainless steel manufactured by µL-PBF. Remarkably, well-organized dislocation walls/cells, accompanied by Cr-segregation, are detected on the exterior of the IPBs, whereas the dislocation structures within IPBs are loosely arranged and remain separated from the Ni-segregations. The emergence of such distinct cellular structures is seldom reported in the 316L bulk samples fabricated via cL-PBF. This phenomenon can be likely attributed to the intrinsic thermal gradients and unique thermal histories inherent in the µL-PBF technique.
Supplemental Material
Download MS Word (5 MB)Acknowledgments
The authors thank Dr. Stefan Zaefferer for the supervision of TOCA software. The authors would also like to thank Dr. Liyaowei Shen and Dr. Xiaoxiao Li from Aixway3d GmbH for their assistance in sample fabrication and ThermoFisher Nanopool in Shanghai for TEM and FIB experiments.
Disclosure statement
No potential conflict of interest was reported by the author(s).
Impact statement
Cellular structures with distinctive chemical segregations and dislocation arrangements were formed in the 316L SS fabricated via μL-PBF, shedding light on the intricate mechanisms underlying the refinement of processing parameters.
Additional information
Funding
References
- Mazur M, Leary M, McMillan M, et al. SLM additive manufacture of H13 tool steel with conformal cooling and structural lattices. Rapid Prototyping J. 2016;22(3):504–518.
- DebRoy T, Wei HL, Zuback JS, et al. Additive manufacturing of metallic components – Process, structure and properties. Prog Mater Sci. 2018;92:112–224.
- An D, Zhou Y, Liu X, et al. Exploring structural origins responsible for the exceptional mechanical property of additively manufactured 316L stainless steel via in-situ and comparative investigations. Int J Plast. 2023;170:103769.
- Hirt L, Reiser A, Spolenak R, et al. Additive manufacturing of metal structures at the micrometer scale. Adv Mater. 2017;29(17):1604211.
- Reiser A, Koch L, Dunn KA, et al. Metals by micro-scale additive manufacturing: comparison of microstructure and mechanical properties. Adv Funct Mater. 2020;30(28):1910491.
- Fu J, Hu Z, Song X, et al. Micro selective laser melting of NiTi shape memory alloy: defects, microstructures and thermal/mechanical properties. Opt Laser Technol. 2020;131:106374.
- Hu Z, Nagarajan B, Song X, et al. Formation of SS316L single tracks in micro selective laser melting: surface, geometry, and defects. Adv Mater Sci Eng. 2019;2019:1–9.
- Hu Z, Gao S, Zhang L, et al. Micro laser powder bed fusion of stainless steel 316L: cellular structure, grain characteristics, and mechanical properties. Mater Sci Eng, A. 2022;848:143345.
- Xiong Z, Li H, Yang H, et al. Micro laser powder bed fusion of NiTi alloys with superior mechanical property and shape recovery function. Addit Manuf. 2022;57:102960.
- Nagarajan B, Hu Z, Song X, et al. Development of micro selective laser melting: the state of the Art and future perspectives. Engineering. 2019;5(4):702–720.
- Fu J, Qu S, Ding J, et al. Comparison of the microstructure, mechanical properties and distortion of stainless steel 316 L fabricated by micro and conventional laser powder bed fusion. Addit Manuf. 2021;44:102067.
- Wei Y, Chen G, Li W, et al. Micro selective laser melting of SS316L: single Tracks, Defects, microstructures and Thermal/Mechanical properties. Opt Laser Technol. 2022;145:107469.
- An D, Zhao H, Sun B, et al. Direct observations of collinear dislocation interaction in a Fe-17.4 Mn-1.50 Al-0.29 C (wt.%) austenitic steel under cyclic loading by in-situ electron channelling contrast imaging and cross-correlation electron backscatter diffraction. Scr Mater. 2020;186:341–345.
- An D, Liu X, Liu Y, et al. Experimental investigation of dislocation-grain boundary interaction in coarse-grained high–manganese steels using quasi in situ electron channelling contrast imaging. Mater Charact. 2023;195:112545.
- Pham MS, Dovgyy B, Hooper PA, et al. The role of side-branching in microstructure development in laser powder-bed fusion. Nat Commun. 2020;11(1):749.
- Andreau O, Koutiri I, Peyre P, et al. Texture control of 316L parts by modulation of the melt pool morphology in selective laser melting. J Mater Process Technol. 2019;264:21–31.
- Salman OO, Gammer C, Chaubey AK, et al. Effect of heat treatment on microstructure and mechanical properties of 316L steel synthesized by selective laser melting. Mater Sci Eng, A. 2019;748:205–212.
- Li Z, He B, Guo Q. Strengthening and hardening mechanisms of additively manufactured stainless steels: the role of cell sizes. Scr Mater. 2020;177:17–21.
- Wang YM, Voisin T, McKeown JT, et al. Additively manufactured hierarchical stainless steels with high strength and ductility. Nat Mater. 2018;17(1):63–71.
- Liu L, Ding Q, Zhong Y, et al. Dislocation network in additive manufactured steel breaks strength–ductility trade-off. Mater Today. 2018;21(4):354–361.
- Godec M, Zaefferer S, Podgornik B, et al. Quantitative multiscale correlative microstructure analysis of additive manufacturing of stainless steel 316L processed by selective laser melting. Mater Charact. 2020;160:110074.
- Yan F, Xiong W, Faierson E, et al. Characterization of nano-scale oxides in austenitic stainless steel processed by powder bed fusion. Scr Mater. 2018;155:104–108.
- Birnbaum AJ, Steuben JC, Barrick EJ, et al. Intrinsic strain aging, Σ3 boundaries, and origins of cellular substructure in additively manufactured 316L. Addit Manuf. 2019;29:100784.
- Bertsch KM, Meric de Bellefon G, Kuehl B, et al. Origin of dislocation structures in an additively manufactured austenitic stainless steel 316L. Acta Mater. 2020;199:19–33.
- Thijs L, Kempen K, Kruth J-P, et al. Fine-structured aluminium products with controllable texture by selective laser melting of pre-alloyed AlSi10Mg powder. Acta Mater. 2013;61(5):1809–1819.