
 ?Mathematical formulae have been encoded as MathML and are displayed in this HTML version using MathJax in order to improve their display. Uncheck the box to turn MathJax off. This feature requires Javascript. Click on a formula to zoom.
Abstract
We report unique two-step strain glass transition toward different local strain states in NiTi, i.e. R and B19′ strain glasses. This unique transition is evidenced by dynamic mechanical analysis and in-situ HR-TEM. A comprehensive phase diagram is established to illustrate diverse transition pathways and corresponding tunable superelastic properties. This pathway exploits the integrated transition of different phases, lowering the transition energy barrier, yielding superelasticity with large recoverable strain (6%), ultralow modulus (24 GPa) and robust cyclic and wide-temperature stability. Our investigation provides fresh insights into continuous transition pathways among different strain glass states to achieve exceptional properties in shape memory alloys.
GRAPHICAL ABSTRACT
Glass-to-glass transitions offer insights into the energetic dynamics of short-range ordered states [Citation1–3]. Initially observed in colloidal systems, these transitions arise from the interplay between anisotropic short-range interactions and rotational/translational degrees of freedom [Citation4–7]. Recent studies extend this phenomenon to metallic and ferroic glasses [Citation8,Citation9]. In a multi-principle element metallic glass system, annealing-induced transitions occur from high- to low-energy configurations before crystallization, driven by high-entropy effects [Citation8]. Similarly, in ferroic glasses, glass-to-glass transition has been observed in a relaxor ferroelectric system, where computer simulations demonstrate transitions between different local polarization states within a percolating electric-dipole network [Citation9]. Ferroic glasses, featuring short-range ferroic order parameters (polarization, magnetization, and strain) within crystalline atomic structures, constitute a distinct glass family [Citation10–12]. Despite the presence of multiple long-range ordered ferroic phases (ferroelectric, ferromagnetic and martensite) and complex multi-step ferroic transformations [Citation13–15], glass-to-glass transitions in ferroic glasses remain primarily observed in relaxors, lacking direct experimental validation in other ferroic systems. The absence of observations in other ferroic systems and the lack of experimental evidence challenge its general applicability in the broad context of ferroic glasses.
The emerging ferroic glassy state in shape memory alloys (SMAs), termed strain glass, undergoes a freezing process characterized by frustrated short-range strain order with random martensitic nanodomains, as evidenced by viscoelasticity measurements in dynamic mechanical analysis and microstructural characterization [Citation12,Citation16]. Despite the identification of numerous strain glass systems [Citation17–19], transitions between different strain glass states in SMAs remain poorly explored. Little is known about potential transition pathways and the nature of glass-to-glass transitions within the realm of strain glass states in SMAs. Thermomechanical treatments, such as cold-working and/or annealing, induce multi-step martensitic transformations (MTs) in NiTi SMAs, notably promoting the intermediate R phase followed by the B19′ phase martensite [Citation20–23]. Previous investigations have predominantly focused on fully developed R-phase martensite, primarily indicated by measurements of transformation latent heat [Citation23–25]. However, due to a lack of proper methods to investigate non-autocatalytic and non-avalanche-like transitions without a heat-flow latent heat signal, the continuous transition behavior has not been fully understood in cold worked and low-temperature annealed NiTi SMA without conventional MTs. Prior works on cold-rolled NiTi alloy have revealed a B19′ strain glass transition in the absence of B19′ MT under sufficient deformation [Citation26,Citation27]. It is conceivable that, in partially annealed NiTi subjected to a significant amount of deformation but prior to the introduction of R and B19′ MTs, a two-step strain glass transition path exists among different strain glass states.
In this work, we report a novel two-step strain glass transition (TSGT) (B2 parent phase → R strain glass → B19′ strain glass) in NiTi. The existence of the TSGT is confirmed by (i) the absence of latent heat peak in differential scanning calorimetry (DSC), (ii) the preservation of an average parent phase structure by in-situ cooling X-Ray diffraction (XRD), and (iii) the emergence of a second frequency-dependent modulus dip in viscoelastic measurement via dynamic mechanical analysis (DMA). This TSGT demonstrates cyclic-stable superelasticity, showcasing large recoverable strain and ultralow modulus compared to various superelastic materials. Furthermore, the microstructure evolution during the TSGT process, characterized by the continuous appearance of R-like and B19′-like nanodomains, is directly observed using high-resolution transmission electron microscopy (HR-TEM).
A commercial Ti49.2Ni50.8 (at. %) shape memory alloy underwent solution treatment at 1273 K for 24 h in evacuated quartz tubes, followed by water quenching to ensure compositional uniformity. Cold rolling was then performed with 40% thickness reduction, followed by annealing at various temperatures (ranging from 473 to 873 K) for 2 h, denoted as CR, and A473K∼A873K samples in this work. Specimens were then cut by electric discharge machining to different shapes for further analysis. DSC measurements were conducted using a TA Q200 with a cooling and heating rate of 10 K min−1 to measure the heat flow curve and transformation latent heat. Viscoelasticity was evaluated by measuring the storage modulus using a TA Q800 DMA employing a step-cooling method with a single cantilever holder, covering a frequency range from 0.2 to 20 Hz. Electrical resistivity measurements were performed using four-point method with a constant current of 100 mA under a cooling and heating rate of 2 K min−1. XRD analysis was conducted using a Bruker D8 Advance XRD instrument with Cu Kα radiation source to analyze the average phase structure during transition upon cooling. For mechanical testing, samples underwent tensile tests using an Instron 5969 universal test machine under a loading-unloading strain rate of 10−3 s−1. A video extensometer with a gauge length of 10 mm recorded the superelastic strain. Wide-temperature mechanical property testing was conducted in a chamber cooled by liquid nitrogen. The samples were tensile cycled under controlled maximum stress to test the cyclic stability of superelasticity. Foils for TEM observations were prepared using twin jet electropolishing with electrolyte consisting of 20% H2SO4 and 80% CH3OH (vol.%) at 253 K. A ThermoFisher Talos-F20 scanning/transmission electron microscope (S/TEM) operating at 200 kV with a field-emission gun equipped with a Gatan cooling holder was used for in-situ cooling selected-area diffraction (SAD) patterns and HR-TEM imaging. DigitalMicrograph software (version 3.43.3213.0) was used for fast Fourier transformation (FFT) and inverse fast Fourier transformation (IFFT) processing.
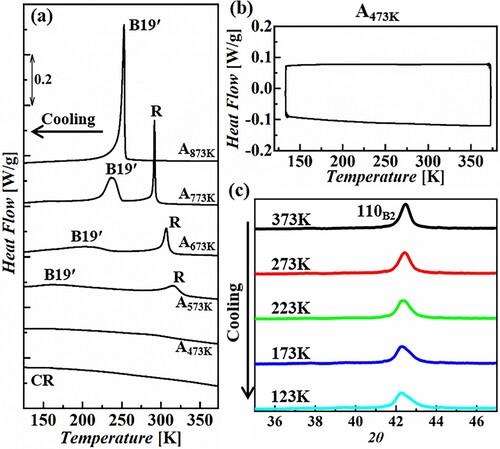
The DSC heat flow curves are illustrated in Figure (a) during cooling within the temperature range of 375–125 K, revealing distinct transition behaviors among samples subjected to different cold-rolling and/or annealing conditions. The well-annealed A873K sample exhibits conventional one-step B2-B19′ MT. Meanwhile, the A773K∼A573K samples display two-step MTs, evidenced by the presence of two exothermic peaks during cooling, indicating B2→R→B19′ MTs [Citation21,Citation23,Citation28–30]. As the annealing temperature decreases, both latent-heat peaks associated with R and B19′ MTs progressively weaken. Remarkably, the A473K sample shows no discernible exothermic peaks during cooling, resembling the behavior of the CR sample previously identified as displaying strain glass transition [Citation26,Citation27]. Detailed heat flow curves of the A473K sample upon cooling and heating are depicted in Figure (b), where both exothermic and endothermic peaks are absent. In-situ cooling XRD profiles of the A473K sample are obtained from temperatures ranging from 373 to 123 K, as shown in Figure (c). The normalized XRD profiles, focused on the (110)B2 diffraction peak, indicate the absence of R or B19’ diffraction peaks, suggesting an average B2 parent phase structure during cooling. The (110)B2 peak weakens and broadens during in-situ cooling, indicating a gradual reduction in the volume fraction of the B2 parent phase and refinement in the microstructure. Thus, the A473K annealed sample is evident to be free of MT, maintaining an average structure of B2 parent phase upon cooling, as confirmed by DSC and XRD.
Figure 1. DSC and in-situ cooling XRD analysis. (a) DSC heat flow curves upon cooling of the CR and A473K∼A873K samples. (b) Cooling and heating heat flow loop of the A473K sample. (c) In-situ cooling XRD profiles of the A473K sample.
To delve deeper into the transition behavior, electrical resistivity curves of samples under different annealing conditions are measured upon cooling and heating. Figure (a) illustrates the temperature dependence of relative electrical resistivity normalized by the value at 373 K. During cooling, the electrical resistivity typically increases during the B2→R transition while decreasing during the B2→B19′ and R→B19′ transitions [Citation31,Citation32]. In the A873K sample, the sudden drop represents a B2→B19′ MT, consistent with DSC findings. For the A773K, A673K, A573K samples, R-phase MT is detected with an abrupt increase in electrical resistivity upon cooling, indicated by the R-phase start (Rs) temperature in Figure (a). A subsequent sharp decrease signifies the B2→R→B19′ two-step MTs, resulting in significant thermal hysteresis between the cooling and heating resistivity curves of these samples [Citation21,Citation23,Citation33]. In the CR sample, R-phase transition is suppressed. As a result, the electrical resistivity curve shows a gradual decrease upon further cooling, indicating one-step B19′ strain glass transition [Citation26,Citation27]. In the A473K sample, the negative temperature coefficient of resistivity related to the R-like transition is enhanced compared to the CR sample, accompanied by an increased maximum in relative resistivity, while the slim hysteresis behavior remains significantly different from that of the R and B19′ MTs in A573K∼A873K samples. These resistivity measurements suggest a B2→R→B19′ two-step continuous transition in the A473K sample.
Figure 2. Resistivity and DMA measurements of the A473K sample. (a) Resistivity measurements. Tnd refer to onset temperatures the R-like precursor. (b) DMA analysis of the 473 K annealed sample. (c–d) Fitting of the Vogel–Fulcher relation for two frequency-dependent dips.
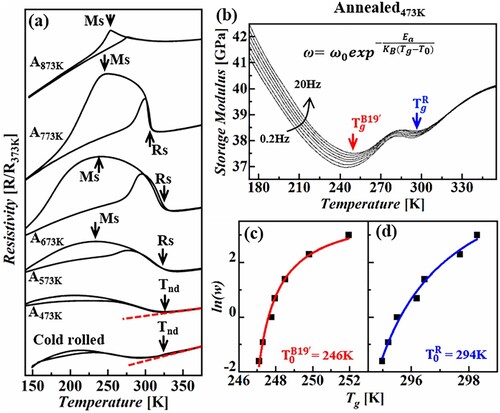
To analyze the observed continuous transition behavior in the A473K sample, viscoelasticity measurement is conducted by DMA. Figure (b) presents storage modulus curves at different driving frequencies during cooling, revealing two distinct frequency-dependent dips corresponding to the two-step transition behavior in resistivity measurements. Both modulus dips shift to higher temperatures logarithmically with increasing frequency. The non-Arrhenius frequency dependence of the strain glass transition temperature (Tg) in both dips is then fitted using the empirical Vogel–Fulcher relation [Citation34,Citation35],
(1)
(1) where ω is the frequency in DMA measurement, ω0 is a constant, Ea is the activation energy, kB is the Boltzmann constant, Tg is the measured strain glass transition temperature obtained by the dipping temperature of storage modulus, T0 is the ideal strain glass transition temperature at 0 Hz. The best fits in Figure (c,d) give
= 245 K, and
= 294 K, which are consistent with the resistivity curves in Figure (a), providing evidence for a two-step strain glass transition. The obtained strain glass transition temperatures of the current TSGT are elevated in comparison with the point-defect-induced strain glass systems in TiNi and TiNb SMAs [Citation12,Citation36], which can be attributed to the fact that the alloy composition corresponds to lower stability (i.e. higher transition temperature) of the martensitic phases [Citation31], similar to the dislocation-induced strain glass systems [Citation26,Citation27,Citation30]. The thorough examination of transition behaviors through DSC, electrical resistivity, and DMA provides conclusive evidences for the presence of a B2→R→B19′ TSGT pathway in NiTi SMA.
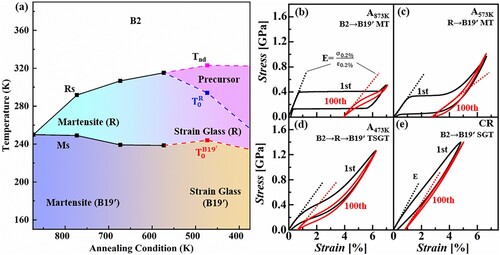
The phase diagram illustrating all the stain states and transition pathways among them in the cold-rolled and annealed TiNi50.8 alloy is hereby provided in relation to the annealing temperature, as shown in Figure (a). The characteristic temperatures of MTs and strain glass transitions are summarized from DSC, DMA, and resistivity measurements. It should be noted that the region below the Tnd temperature, as measured by resistivity, represents the precursory region of R strain glass [Citation37]. To compare the superelastic properties among different MT and strain glass transition pathways demonstrated in this newly established phase diagram, stress–strain curves are measured under cyclic tensile test for 100 cycles. Figure (b–e) shows the stress–strain loops, with the first cycle in black and the last in red. The A873K and A573K samples with B2→B19′ or B2→R→B19′ MTs exhibit typical stress-induced MT (SIMT) behavior characterized by a stress plateau and a large stress–strain loop hysteresis. Severe functional fatigue is observed, as evidenced by the rapid degradation of recoverable strain and superelastic behavior. It should be noted that due to the relatively high Rs temperature in the A573K sample above room temperature, the superelasticity detected in Figure (c) is generated by stress-induced R→B19′ MT. In contrast, the CR and A473K samples with B2→B19′ or B2→R→B19′ strain glass transitions display slim superelastic stress–strain loops from the beginning, and no significant degradation is observed after the subsequent cycles. The CR sample with B2→B19′ strain glass exhibits quasi-linear superelasticity, while the A473K sample with B2→R→B19′ TSGT demonstrates non-linear superelasticity with obvious modulus softening. In this way, tunable superelastic functional properties from conventional plateau-like behavior to quasi-linear behavior can be fully understood and harnessed via the established phase diagram and corresponding transition pathways in the cold rolled and annealed NiTi alloy.
Figure 3. Phase diagram involving various transition pathways and corresponding tunable superelastic properties.
The strength, recoverable strain and modulus before and after cycles of different samples are summarized and plotted in Figure (a–c) to facilitate a direct comparison of the superelastic properties among different transition pathways. Increased strength, serving as the stimulus stress of superelasticity, and decreased initial superelastic recoverable strain in Figure (a,b) indicate a reduction of overall transformability under lower annealing temperature with strengthened structural confinement to suppress conventional MT while inducing strain glass transition. Meanwhile, the structural confinement enhances the cyclic stability in strain glass transition compared to MTs, as shown in the reduction in recoverable strain after cycle training between the initial and stabilized values in Figure (b). Notably, the A473K sample exhibits the highest cyclic stable superelastic recoverable strain (∼6%) among all transition pathways. To compare the elastic modulus of various non-linear superelastic behaviors in different samples, an apparent modulus is used here by measuring the slope of the initial stress–strain curve, as defined and illustrated in Figure (b–d). Non-monotonic modulus in relation to annealing condition is detected, as shown in Figure (c) with value of 24 GPa in A473K sample after cyclic stabilization. Surprisingly, the lowest modulus (18 GPa) is measured in in A573K sample, attributed to the unique stress-induced R→B19′ MT completely different from other pathways initiated from B2 parent phase. The superelastic properties at room temperature are then evaluated in comparison with various superelastic materials, as shown in Figure (d) with an Ashby map of recoverable strain and modulus [Citation24,Citation38–48]. It is evident that among different superelastic materials, the samples in this work exhibit cyclic stable superelasticity with superior large recoverable strain and ultra-low modulus.
Figure 4. Comparisons of the superelasticity under different transition pathways with various superelastic materials. (a–c) The strength, recoverable strain, and Young’s modulus under different transition pathways. (d) Comparison of the recoverable strain and Young’s modulus with various superelastic materials, including the NiTi-based SMA [Citation38,Citation39], NiTi-Nb composite [Citation40], Cu69Al17Mn14 single crystal [Citation41], Cu-based SMA [Citation42,Citation43], Mg-based SMA [Citation44], Ti-based SMA [Citation45,Citation46], Fe-based SMA [Citation47], TiNiFe composite [Citation24], and Co25Ni25(HfTiZr)50 high-entropy alloy [Citation48].
![Figure 4. Comparisons of the superelasticity under different transition pathways with various superelastic materials. (a–c) The strength, recoverable strain, and Young’s modulus under different transition pathways. (d) Comparison of the recoverable strain and Young’s modulus with various superelastic materials, including the NiTi-based SMA [Citation38,Citation39], NiTi-Nb composite [Citation40], Cu69Al17Mn14 single crystal [Citation41], Cu-based SMA [Citation42,Citation43], Mg-based SMA [Citation44], Ti-based SMA [Citation45,Citation46], Fe-based SMA [Citation47], TiNiFe composite [Citation24], and Co25Ni25(HfTiZr)50 high-entropy alloy [Citation48].](/cms/asset/ced1d486-1e22-4bc0-9670-51fa8b592c98/tmrl_a_2373285_f0004_oc.jpg)
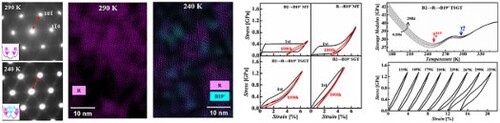
In order to directly observe the microstructure evolution during the TSGT in the A473K sample, in-situ cooling TEM SAD patterns and HR-TEM images are obtained below the strain glass transition temperatures of R and B19′ strain glass, respectively. At 290 K, as shown in Figure (a), the SAD pattern in [111]B2 zone axis reveals weak additional diffraction spots near the 1/3 locations of B2 signals (1/3 spots), suggesting the presence of R-like phase. The HR-TEM image in Figure (b) captures the lattice image of R-like nanodomains, with corresponding FFT reflections near 1/3 locations. A random spatial distribution of the R-like nanodomain is shown by the IFFT in Figure (c) by selectively choosing the corresponding reflections near 1/3 locations. Upon cooling to 240 K, weak spots near the 1/2 positions appear in the SAD pattern (the 1/2 spots), suggesting the presence of B19′-like structure. The HR-TEM image in Figure (e) captures the lattice structure of both the B19'-like and R-like nanodomains. By selectively choosing the corresponding reflections near 1/3 and 1/2 locations, an IFFT image is obtained to illustrate the spatial distribution of both R-like and B19′-like nanodomains in Figure (f). Different from the long-range strain-ordered multi-twin martensite, both R-like and B19′-like nanodomains following this TSGT pathway remain only local strain order with a random spatial distribution. The in-situ cooling observations provide direct evidence of the continuous transition process of R and B19′ strain glasses during the TSGT pathway.
Figure 5. TEM observation upon cooling and the associated wide-temperature superelasticity of TSGT. (a, d) TEM-SAD patterns at 290 and 240 K. The intensity profiles of the insets are plotted along the red dashed line. (b, e) HR-TEM images at 290 and 240 K. (c, f) IFFT images corresponding to HR-TEM observations. (g) Wide-temperature superelasticity measurements. (h–j) Recoverable strain, hysteresis, and Young’s modulus in relation to testing temperature.
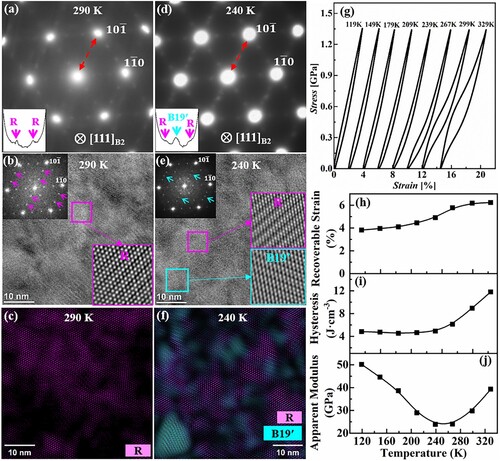
Corresponding to the microstructural evolution, the temperature dependence of superelasticity in A473K sample is investigated through tensile tests from 329 to 119 K. The results in Figure (g) exhibit wide-temperature stable superelastic behavior. The recoverable strain, hysteresis and Young’s modulus are then evaluated as function of testing temperature, as shown in Figure (h–j). Upon cooling, slight decreases in recoverability and hysteresis are observed with stabilized values below the strain glass transition temperature, while the Young’s modulus first decreases due to the softening by appeared R and B19′ martensitic nanodomains and then increases under the following frozen process. The higher glass transition temperature produces abundant austinite/martensite interfaces together with the nanodomain structure during strain glass transition close to room temperature, which generates modulus softening behavior and contributes to the ultralow modulus measured in room-temperature tensile tests [Citation49]. The recoverability shows a plateau above (294 K), with about 6% stable recoverable strain. The hysteresis exhibits a rapid decrease upon cooling to a stable value of approximately 5 J·cm−3 below
(246 K) down to 119 K. The Young’s modulus shows nonmonotonic tendency, with lowest value near
. As demonstrated in previous works [Citation26,Citation27,Citation36,Citation50,Citation51], the strain glass exhibits a confined continuous growth of martensitic nanodomains upon cooling or loading. Below the glass transition temperature, random nanodomains of different variants of martensite may transform to preferred variants by the external stress upon loading, which then restore the initial state upon unloading due to the confinement of the stress-carrying defects, giving rise to superelasticity below T0 [Citation27,Citation51–53]. These observed superelastic characteristics are strongly corelated with the TSGT pathways and related microstructural evolution in A473K sample, offering an essential microstructural foundation for optimizing the functional properties NiTi SMAs over a wide temperature range by regulating the continuous strain glass transition behavior.
The presence of percolating nanoscale strain networks has been established as essential for the formation of conventional strain glasses [Citation54,Citation55]. However, whether such a strain network could stabilize distinctively different strain glass states and allow the transition from one to another remains unclear. Previous studies have indicated that R and B19′ strain glasses could be induced by strain network with different strength [Citation26,Citation55,Citation56]. Thus, R and B19′ strain glasses may appear and freeze subsequently under different driving force by the partial recovery annealing of the severe confinement induced by cold work [Citation26]. The R nanodomains with smaller transformation strains will appear first, while B19′ nanodomains with larger transformation strains need higher driving force upon further cooling or loading, leading to the observed TSGT pathway. Similar to the study of structural glasses where energy landscape sampling techniques in atomistic simulations have been used to probe the activation barriers [Citation57], atomistic simulations have been used to extract activation energy barriers for strain glass transitions [Citation54,Citation55]. In both cases, the simulation results are consistent with the signatures in DMA measurements. When atomic potentials become available for characterizing the two distinct martensitic phases within the same system, such atomistic simulations would shed light on the origin of the transition mechanism between different strain glass states and worth pursuing. Attributed to the severe confinement required to induce strain glass [Citation17], the overall transformability of the system is often limited, resulting in quasi-linear behavior with reduced recoverable strains and high stimulus stresses [Citation26,Citation27,Citation50]. In this work, by introducing a transition pathway between different strain glass states with varying local strains, the superelastic recoverable strain of strain glassy SMAs is further enhanced by incorporating the transformation strain of different martensitic phases.
Phase transformations, including strain glass transitions, have been shown to exert a notable influence on the modulus of NiTi SMAs and metastable β-Ti alloys including TiNb SMAs [Citation26,Citation36,Citation58,Citation59]. Metastable β-Ti alloys with low moduli, such as Gum metal and Ti2448 [Citation60,Citation61], have been observed in previous studies to undergo a one-step strain glass transition [Citation36,Citation62], contributing to multifunctionality, including high strength, low modulus (40–50 GPa), and Invar and Elinvar effects. The stress-induced continuous growth of martensitic nanodomains without encountering a nucleation energy barrier contributes to an additional strain response under applied stress, resulting in a significantly lower modulus in strain glass systems compared to conventional metallic materials. In this study, as demonstrated by the R-B19′ martensitic transformation in Figure , the intermediate R phase can markedly reduce the energy barrier, resulting in a low apparent modulus, albeit with severe fatigue due to conventional MT. Similarly, by employing an intermediate R strain glass preceding the B19′ strain glass, this TSGT pathway yields the ultralow modulus obtained (24 GPa) compared to both MT and one-step strain glass transition in NiTi and metastable β-Ti alloys, while maintaining a superior cyclic stability due to controlled strain release under continuous transition behavior.
In conclusion, this study has demonstrated a two-step strain glass transition (TSGT) in NiTi SMA. The transition behavior investigated by DSC, DMA and electrical resistivity reveals a TSGT pathway of B2 → R strain glass → B19′ strain glass. A comprehensive phase diagram is established through detailed transition behavior measurements to illustrate different strain states and various transition pathways. Functionality underlying different transition pathways is thoroughly examined to reveal tunable superelasticity from plateau-like to quasi-linear behavior. Among different transition pathways and various superelastic materials, the sample with TSGT in this work exhibits superior cyclic stable superelasticity with ∼6% recoverable strain, ∼24 GPa Young’s modulus. By gaining a deeper understanding of different strain glass states through the TSGT pathway, this research opens new possibilities for exploring and harnessing the full potential of SMAs.
Disclosure statement
No potential conflict of interest was reported by the author(s).
Additional information
Funding
References
- Pusey P. Liquids, freezing and glass transition. Amsterdam: North-Holland; 1991.
- Eckert T, Bartsch E. Re-entrant glass transition in a colloid-polymer mixture with depletion attractions. Phys Rev Lett. 2002;89(12):125701. doi:10.1103/PhysRevLett.89.125701
- Caiazzo A, Coniglio A, Nicodemi M. Glass-glass transition and new dynamical singularity points in an analytically solvable p-spin glasslike model. Phys Rev Lett. 2004;93(21):215701. doi:10.1103/PhysRevLett.93.215701
- Pusey PN, van Megen W. Phase behaviour of concentrated suspensions of nearly hard colloidal spheres. Nature. 1986;320(6060):340–342. doi:10.1038/320340a0
- Pham KN, Puertas AM, Bergenholtz J, et al. Multiple glassy states in a simple model system. Science. 2002;296(5565):104–106. doi:10.1126/science.1068238
- Zheng Z, Wang F, Han Y. Glass transitions in quasi-two-dimensional suspensions of colloidal ellipsoids. Phys Rev Lett. 2011;107(6):065702. doi:10.1103/PhysRevLett.107.065702
- Mishra CK, Rangarajan A, Ganapathy R. Two-step glass transition induced by attractive interactions in quasi-two-dimensional suspensions of ellipsoidal particles. Phys Rev Lett. 2013;110(18):188301. doi:10.1103/PhysRevLett.110.188301
- Luan H, Zhang X, Ding H, et al. High-entropy induced a glass-to-glass transition in a metallic glass. Nat Commun. 2022;13(1):2183. doi:10.1038/s41467-022-29789-1
- Zhang L, Lou X, Wang D, et al. Glass-glass transitions by means of an acceptor-donor percolating electric-dipole network. Phys Rev App. 2017;8(5):054018. doi:10.1103/PhysRevApplied.8.054018
- Vugmeister B, Glinchuk M. Dipole glass and ferroelectricity in random-site electric dipole systems. Rev Mod Phys. 1990;62(4):993. doi:10.1103/RevModPhys.62.993
- Binder K, Young AP. Spin glasses: experimental facts, theoretical concepts, and open questions. Rev Mod Phys. 1986;58(4):801. doi:10.1103/RevModPhys.58.801
- Sarkar S, Ren X, Otsuka K. Evidence for strain glass in the ferroelastic-martensitic system Ti(50-x)Ni(50+x). Phys Rev Lett. 2005;95(20):205702. doi:10.1103/PhysRevLett.95.205702
- Allafi JK, Ren X, Eggeler G. The mechanism of multistage martensitic transformations in aged Ni-rich NiTi shape memory alloys. Acta Mater. 2002;50(4):793–803. doi:10.1016/S1359-6454(01)00385-8
- Bratton RJ, Tien TY. Phase transitions in the system BaTiO3—KnbO3. J Am Ceram Soc. 1967;50(2):90–93. doi:10.1111/j.1151-2916.1967.tb15046.x
- Dass RI, Goodenough JB. Multiple magnetic phases of La2CoMnO6−δ(0<∼δ<∼0.05). Phys Rev B. 2003;67(1):014401. doi:10.1103/PhysRevB.67.014401
- Wang Y, Ren X, Otsuka K, et al. Evidence for broken ergodicity in strain glass. Phys Rev B. 2007;76(13):132201. doi:10.1103/PhysRevB.76.132201
- Wang D, Ji Y, Ren X, et al. Strain glass state, strain glass transition, and controlled strain release. Annu Rev Mater Res. 2022;52(1):159–187. doi:10.1146/annurev-matsci-081720-091919
- Ren X. Strain glass and ferroic glass—unusual properties from glassy nano-domains. Phys Status Solidi B. 2014;251:1982–1992. doi:10.1002/pssb.201451351
- Wang W, Ji Y, Fang M, et al. Non-conventional strain glasses. Shape Mem Superelasticity. 2023;9(2):240–251. doi:10.1007/s40830-023-00448-8
- Liu Y, McCormick PG. Thermodynamic analysis of the martensitic transformation in NiTi—I. Effect of heat treatment on transformation behaviour. Acta Metall Mater. 1994;42(7):2401–2406. doi:10.1016/0956-7151(94)90318-2
- Zheng Y, Jiang F, Li L, et al. Effect of ageing treatment on the transformation behaviour of Ti–50.9at.% Ni alloy. Acta Mater. 2008;56(4):736–745. doi:10.1016/j.actamat.2007.10.020
- Lv C, Wang K, Wang B, et al. Coexistence of strain glass transition and martensitic transformation in highly nickel-rich ferroelastic alloy with large elastocaloric effect. Acta Mater. 2024;264:119598. doi:10.1016/j.actamat.2023.119598
- Mahmud AS, Wu Z, Yang H, et al. Effect of cold work and partial annealing on thermomechanical behaviour of Ti-50.5at%Ni. Shape Mem Superelasticity. 2017;3(1):57–66. doi:10.1007/s40830-017-0103-6
- Zhang J, Liu Y, Yang H, et al. Achieving 5.9% elastic strain in kilograms of metallic glasses: nanoscopic strain engineering goes macro. Mater Today. 2020;37:18–26. doi:10.1016/j.mattod.2020.02.020
- Yu C, Aoun B, Cui L, et al. Synchrotron high energy X-ray diffraction study of microstructure evolution of severely cold drawn NiTi wire during annealing. Acta Mater. 2016;115:35–44. doi:10.1016/j.actamat.2016.05.039
- Liang Q, Zhao S, Liang C, et al. Strain states and unique properties in cold-rolled TiNi shape memory alloys. Acta Mater. 2022;231:117890. doi:10.1016/j.actamat.2022.117890
- Liang Q, Wang D, Zhang J, et al. Novel B19’ strain glass with large recoverable strain. Phys Rev Mater. 2017;1(3):033608. doi:10.1103/PhysRevMaterials.1.033608
- Shamimi A, Amin-Ahmadi B, Stebner A, et al. The effect of low temperature aging and the evolution of R-phase in Ni-rich NiTi. Shape Mem Superelasticity. 2018;4(4):417–427. doi:10.1007/s40830-018-0193-9
- Ji Y, Wang D, Ding X, et al. Origin of an isothermal R-martensite formation in Ni-rich Ti-Ni solid solution: crystallization of strain glass. Phys Rev Lett. 2015;114(5):055701. doi:10.1103/PhysRevLett.114.055701
- Ji Y, Ding X, Lookman T, et al. Heterogeneities and strain glass behavior: role of nanoscale precipitates in low-temperature-aged Ti48.7Ni51.3alloys. Phys Rev B. 2013;87(10):104110. doi:10.1103/PhysRevB.87.104110
- Wang D, Wang Y, Zhang Z, et al. Modeling abnormal strain states in ferroelastic systems: the role of point defects. Phys Rev Lett. 2010;105(20):205702. doi:10.1103/PhysRevLett.105.205702
- Zhang Z, Wang Y, Wang D, et al. Phase diagram ofTi50−xNi50+x: crossover from martensite to strain glass. Phys Rev B. 2010;81(22):224102. doi:10.1103/PhysRevB.81.224102.
- Liu Y, Yang H, Voigt A. Thermal analysis of the effect of aging on the transformation behaviour of Ti–50.9at.% Ni. Mater Sci Eng A. 2003;360(1):350–355. doi:10.1016/S0921-5093(03)00443-X
- Vogel H. The temperature dependence law of the viscosity of fluids. Phys Z. 1921;22(35):645–646.
- Fulcher GS. Analysis of recent measurements of the viscosity of glasses. J Am Ceram Soc. 1925;8(6):339–355. doi:10.1111/j.1151-2916.1925.tb16731.x
- Liang Q, Wang D, Zheng Y, et al. Shuffle-nanodomain regulated strain glass transition in Ti-24Nb-4Zr-8Sn alloy. Acta Mater. 2020;186:415–424. doi:10.1016/j.actamat.2019.12.056
- Ren X, Wang Y, Zhou Y, et al. Strain glass in ferroelastic systems: premartensitic tweed versus strain glass. Philos Mag. 2010;90(1–4):141–157. doi:10.1080/14786430903074771
- Otsuka K, Ren X. Physical metallurgy of Ti–Ni-based shape memory alloys. Prog Mater Sci. 2005;50(5):511–678. doi:10.1016/j.pmatsci.2004.10.001
- Tan SM, Miyazaki S. Ti-content dependence of transformation pseudoelastivity characteristics of TixNi(92−x)Cu8 shape memory alloys. Mater Sci Eng A. 1997;237(1):79–86. doi:10.1016/S0921-5093(97)00119-6
- Hao S, Cui L, Jiang D, et al. A transforming metal nanocomposite with large elastic strain, low modulus, and high strength. Science. 2013;339(6124):1191–1194. doi:10.1126/science.1228602
- Xu S, Odaira T, Sato S, et al. Non-Hookean large elastic deformation in bulk crystalline metals. Nat Commun. 2022;13(1):5307. doi:10.1038/s41467-022-32930-9
- Sutou Y, Omori T, Kainuma R, et al. Grain size dependence of pseudoelasticity in polycrystalline Cu–Al–Mn-based shape memory sheets. Acta Mater. 2013;61(10):3842–3850. doi:10.1016/j.actamat.2013.03.022
- Sutou Y, Omori T, Kainuma R, et al. Ductile Cu–Al–Mn based shape memory alloys: general properties and applications. Mater Sci Technol. 2008;24(8):896–901. doi:10.1179/174328408X302567
- Ogawa Y, Ando D, Sutou Y, et al. A lightweight shape-memory magnesium alloy. Science. 2016;353(6297):368–370. doi:10.1126/science.aaf6524
- Hao Y, Li S, Prima F, et al. Controlling reversible martensitic transformation in titanium alloys with high strength and low elastic modulus. Scr Mater. 2012;67(5):487–490. doi:10.1016/j.scriptamat.2012.06.011
- Hao YL, Li SJ, Sun SY, et al. Elastic deformation behaviour of Ti–24Nb–4Zr–7.9Sn for biomedical applications. Acta Biomater. 2007;3(2):277–286. doi:10.1016/j.actbio.2006.11.002
- Tanaka Y, Himuro Y, Kainuma R, et al. Ferrous polycrystalline shape-memory alloy showing huge superelasticity. Science. 2010;327(5972):1488–1490. doi:10.1126/science.1183169
- He QF, Wang JG, Chen HA, et al. A highly distorted ultraelastic chemically complex Elinvar alloy. Nature. 2022;602(7896):251–257. doi:10.1038/s41586-021-04309-1
- Zhang L, Wang D, Ren X, et al. A new mechanism for low and temperature-independent elastic modulus. Sci Rep. 2015;5:11477. doi:10.1038/srep11477
- Wang D, Hou S, Wang Y, et al. Superelasticity of slim hysteresis over a wide temperature range by nanodomains of martensite. Acta Mater. 2014;66:349–359. doi:10.1016/j.actamat.2013.11.022
- Zhao S, Liang Q, Su Y, et al. Cryogenic rolling induces quasi-linear superelasticity with high strength over a wide temperature range in TiNi shape memory alloys. Scr Mater. 2024;243:115996. doi:10.1016/j.scriptamat.2024.115996
- Hao Y, Wang H, Li T, et al. Superelasticity and tunable thermal expansion across a wide temperature range. J Mater Sci Technol. 2016;32(8):705–709. doi:10.1016/j.jmst.2016.06.017
- Wang H, Hao Y, He S, et al. Elastically confined martensitic transformation at the nano-scale in a multifunctional titanium alloy. Acta Mater. 2017;135:330–339. doi:10.1016/j.actamat.2017.06.040
- Liang C, Wang D, Wang Z, et al. Revealing the atomistic mechanisms of strain glass transition in ferroelastics. Acta Mater. 2020;194:134–143. doi:10.1016/j.actamat.2020.04.014
- Zong H, Wu H, Tao X, et al. Percolated strain networks and universal scaling properties of strain glasses. Phys Rev Lett. 2019;123(1):015701. doi:10.1103/PhysRevLett.123.015701
- Wang D, Lv D, Gao Y, et al. Defect strength and strain glass state in ferroelastic systems. J Alloys Compd. 2016;661:100–109. doi:10.1016/j.jallcom.2015.11.095
- Liu C, Fan Y. Emergent fractal energy landscape as the origin of stress-accelerated dynamics in amorphous solids. Phys Rev Lett. 2021;127(21):215502. doi:10.1103/PhysRevLett.127.215502
- Kim H, Ikehara Y, Kim J, et al. Martensitic transformation, shape memory effect and superelasticity of Ti–Nb binary alloys. Acta Mater. 2006;54(9):2419–2429. doi:10.1016/j.actamat.2006.01.019
- Miyazaki S. My experience with Ti–Ni-based and Ti-based shape memory alloys. Shape Mem Superelasticity. 2017;3(4):279–314. doi:10.1007/s40830-017-0122-3
- Saito T, Furuta T, Hwang J-H, et al. Multifunctional alloys obtained via a dislocation-free plastic deformation mechanism. Science. 2003;300(5618):464–467. doi:10.1126/science.1081957
- Yang R, Hao Y, Li S. Development and application of low-modulus biomedical titanium alloy Ti2448. Biom Eng Tre. 2011;10:225–247.
- Wang Y, Gao JH, Wu HJ, et al. Strain glass transition in a multifunctional β-type Ti alloy. Sci Rep. 2014;4:3995. doi:10.1038/srep03995