
 ?Mathematical formulae have been encoded as MathML and are displayed in this HTML version using MathJax in order to improve their display. Uncheck the box to turn MathJax off. This feature requires Javascript. Click on a formula to zoom.
ABSTRACT
The tsunami that was triggered by the 2024 Noto Peninsula Earthquake caused severe inundation along the coast on the northeastern tip of the peninsula, propagated over the sea with rough wind waves, and reached the coast and rivers located away from the peninsula. This manuscript presents the results of a field survey and a supplementary analysis for investigating the tsunami characteristics away from the peninsula where rough wind waves had a significant influence on the tsunami behavior. Video images captured by closed-circuit television (CCTV) cameras were used for onsite detection of the tsunami traces and for extracting time-varying water level profiles. Wind waves had little influence on the tsunamis along the lower reaches of the rivers, and the measured tsunami heights were consistent with each other in the nearby field. At most of the survey sites, the highest tsunami traces were created not by the first but by the following tsunami. Along Toyama Bay, the tsunami water levels first decreased within several minutes after the earthquake, and the arrival times for this negative tsunami peak was earlier in the southern part of the bay. These characteristics may indicate the existence of multiple tsunami sources inside Toyama Bay.
1. Introduction
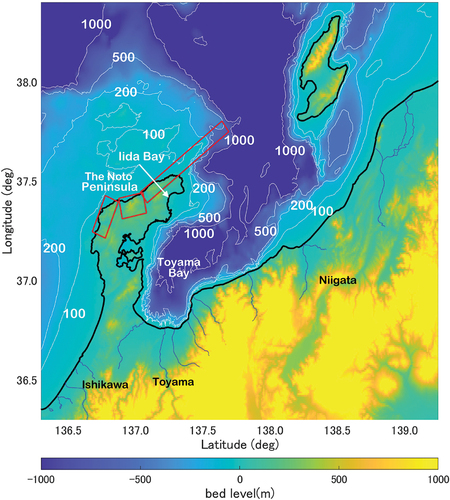
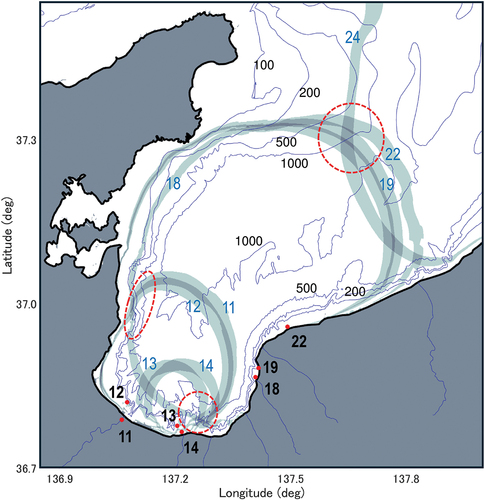
On January 1 2024, an earthquake with a magnitude of 7.6 (JMA Citation2024) occurred in the Noto Peninsula region facing the Sea of Japan and triggered a tsunami. The Noto Peninsula region experienced tsunamis in 1993 and 2007 (Fujii and Satake Citation2024; Tanioka Citation2008). Among these tsunamis over the past three decades, the 2024 tsunami was the most substantial and caused severe inundation along the coast of Iida Bay, which is located at the northeastern tip of the Noto Peninsula ().
Figure 1. Geometrical characteristics around the Noto Peninsula. Red rectangular frames indicate the fault model of the 2024 Noto Peninsula Earthquake provided by Geo-Spatial Information Authority of Japan (GSI). Thin white line indicates the depth contour line, and blue lines indicate the lower reaches of the rivers.
The Sea of Japan has experienced severe tsunamis that were generated from the fault at different locations, such as the tsunamis that were induced by the 1983 Nihonkai Chubu and 1993 Hokkaido Nansei Oki Earthquakes. In these tsunamis, substantial tsunami damage was locally concentrated along the coast in the vicinity of the tsunami source (e.g. Hokkaido Tsunami Survey Group Citation1993; Shuto Citation1985). In the Sea of Japan, the recurrence intervals of the tsunamigenic earthquakes at each location have been longer than those in the Nankai Trough, Japan Trench, and Kuril Trench regions. Consequently, most coastal areas facing the Sea of Japan have rarely experienced severe tsunami inundations and therefore have few historical records, which could be useful for investigating the tsunami inundation characteristics in each region (Yamanaka and Shimozono Citation2022). To compensate for this lack of historical tsunami records, Yamanaka and Shimozono (Citation2022) conducted a numerical analysis of the tsunami inundations along the coast of the Sea of Japan using various faults and reported that the computed local tsunami inundation characteristics are strongly affected by local conditions such as coastal structures (e.g. ports and breakwaters), nearshore topography, and rivers. Thus, obtaining quantitative inundation data for actual tsunami events is essential for better understanding the local tsunami inundation characteristics along the coast of the Sea of Japan.
The post disaster survey team from the Japan Society of Civil Engineers (JSCE) conducted an intensive field survey and thoroughly investigated the coastal damage that was caused by the 2024 tsunami along the coast of the Noto Peninsula and the surrounding coastlines of Ishikawa, Toyama and Niigata Prefectures (Yuhi et al. Citation2024). While the tsunami was also witnessed along a portion of the coast located away from the peninsula, it was difficult to estimate the pure impact of the tsunami due to the presence of rough wind waves during the event. The tsunami runup may have been mixed with that of wind waves, and the nearshore sea levels may also have been significantly affected by the wave set up and surf beat induced by wind waves.
In recent coastal disasters, video footage taken by local residents has become an important information source for capturing and understanding the characteristics of coastal hazards (e.g. Fritz et al. Citation2012; Roeber and Bricker Citation2015; Hattori et al. Citation2020; Yamanaka and Tajima Citation2021). In the 2024 Noto Peninsula Earthquake event, video footage that was taken by Closed-Circuit Television (CCTV) cameras was recorded at several locations along the coast and rivers. Analysis of these videos may provide more reliable information for a better evaluation of the tsunami that was induced by the 2024 Noto Peninsula Earthquake. This paper investigates the tsunami characteristics through a field survey with the support of recorded videos and further presents the image analysis results.
2. Overview of the study area and the field survey
shows the bathymetry of the study area and the fault model that was determined by the Geo-Spatial Information Authority of Japan (GSI). Toyama Bay is one of the deepest bays in Japan. As seen in the figure, the depth contour lines for 100 and 200 m lie close to each other within a cross-shore horizontal distance of approximately several hundred meters, indicating the presence of steep cross-shore slopes along the coast of Toyama Bay. The solid blue lines indicate the lower reaches of the rivers that flow into the bay and the Sea of Japan. Along the coast and rivers, a number of CCTV cameras were installed by the Ministry of Land, Infrastructure, Transport and Tourism (MLIT) and by Ishikawa, Toyama and Niigata Prefectures. Many of these CCTV cameras recorded video footage that captured the tsunami propagation and runup.
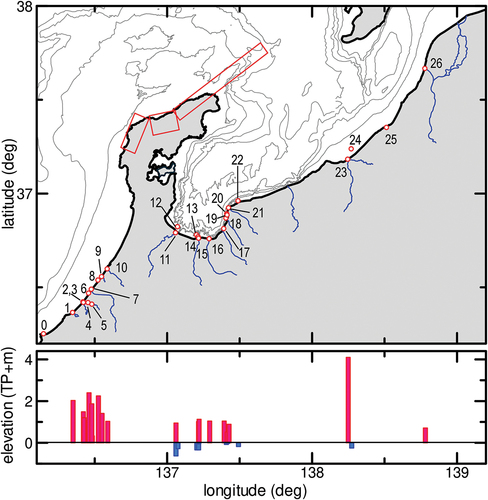
A field survey was conducted at the beginning of February to measure the horizontal coordinates and elevations of the tsunami traces and the objects that were captured by video footage to estimate the water surface levels from the footage described later. The top panel of shows the locations of the survey sites, tide gauges, and wave gauges, which are represented by blank red circles with identification numbers. The bottom panel of shows the measured tsunami elevations at each location, as discussed later. In the survey, we used the RTK-GNSS to measure the horizontal coordinates and elevations of the targets. In this report, Tokyo Peil, TP, was used as the datum for the measured elevations. Most of the survey sites were selected where evidence of the tsunami arrival was observed in the CCTV video footage. At each survey site, we searched for traces of tsunamis, such as debris lines and fallen vegetation in the tsunami propagation direction, around the locations where the tsunami arrival was observed in the video footage.
Figure 2. Survey sites (top) and measured elevation of the tsunami traces (bottom). Numbers at each site correspond to those listed in tables 1, 2, and 3. In addition, sites 0 and 25 indicate the locations of Mikuni and Kashiwazaki tide gauges, respectively. Blue lines indicate the lower reaches of the rivers.
3. Tsunami heights along the Ishikawa coast and Toyama Bay
and summarize the measured elevations of the tsunami traces and the highest peak water levels after the earthquake that were recorded by the tide gauges installed near the coastline. In the table, ”(a) WL” is the elevation of the trace or the highest peak water level recorded by the tide gauge; ”(b) AT” is the astronomical tide level at the time when the highest tsunami was observed in the video footage; and ”(c) WL0” is the water level determined at approximately 10 min prior to the tsunami arrival, as recorded by the water level gauges that were installed near each survey site. The water level gauges along the river were also installed by MLIT and the prefectures, and the observed water levels were recorded at intervals of 10 min. The astronomical tides were obtained from the estimated tide levels at nearby tide gauge stations, which were provided by the Japan Meteorological Agency (JMA). The tide gauge stations that were used for estimating the astronomical tides are Mikuni for survey sites along the Ishikawa coast, listed in ; Toyama for the sites along Toyama Bay, listed in ; and Naoetsu and Kashiwazaki for sites 23 and 26 in Niigata Prefecture, respectively. The locations of these tide gauge stations are also shown in . The table also shows the tsunami arrival times that were determined from the video footage, classification types of the tsunami heights, either inundation “I” or runup “R;” specific targets for measuring the tsunami heights; and L, the distances from the coast to the measured targets along the river. The times in the table are based on Japan Standard Time (JST), i.e. UTC +9 hours. The reliability of the measured data was evaluated as “A” if the target tsunami trace was clear at each site or was clearly observed in the video footage. The number of each site in the table corresponds to the number shown in . Hereafter, the numbers noted in the text indicate the location of each site shown in .
Table 1. Survey results of tsunami traces along Ishikawa coast. (a) WL is the elevation of the trace, (b) AT is the astronomical tide level at each time, (c) WL0 is the water surface level approximately 10 min prior to the tsunami arrival, and L is the distance from the coastline to each site.
Table 2. Survey results of tsunami traces along Toyama Bay and Niigata coast.
3.1. Tsunami heights along the Ishikawa coast
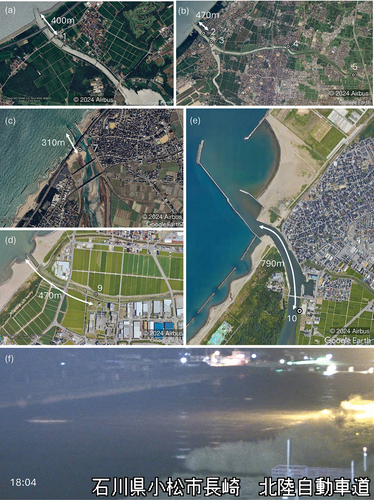
Along the coast of Ishikawa Prefecture, as listed in , we focused on the tsunami traces along the river, which appear to have had less influence on the water surface disturbances due to wind waves. Panels (a) to (e) in show the satellite images around the survey sites along the river. The figure also shows the distances from the coastline. The bottom panel (f) shows an example of the video footage recorded by a CCTV camera that was installed near survey site 3 along the Kakehashi River, as shown in . In the footage, the tsunami formed an undular bore and propagated in the upstream direction. Note that the water level fluctuations seen in the panel (f), indicating the undular bore, were not observed in the footage before 18:04 The tsunami inundation was observed along the high-water channel inside the riverbank. At this location, we found tsunami traces consisting of debris lines and fallen vegetation in the upstream direction. Along the Kakehashi River (3, 4 and 5), the tsunami propagation was observed by four CCTV cameras installed at different locations. Survey site 5, shown in , is located approximately 6.7 km upstream from the coast, and the tsunami arrived at 18:26, approximately 22 min after the arrival of the tsunami at site 3, which is located approximately 890 m upstream from the river mouth. Given the distance between sites 3 and 5, the average tsunami propagation speed between these two sites is estimated to be approximately 4.4 m/s. In addition to the Kakehashi River (3), the tsunami was also captured at approximately 17:58 by the CCTV camera that was installed near the mouth of the Tedori River (7). In this video footage, tsunami inundation on the sandy riverbank was observed, and a clear debris line was also found on this riverbank, as shown in . While video footage was not available along the other rivers on the Ishikawa coast, equally clear debris lines and fallen vegetation were found to enable measurements of the tsunami heights.
Figure 3. Satellite views of survey sites along rivers on Ishikawa coast: (a) Shinhori River; (b) Kakehashi River; (c) Tedori River; (d) Kurabe River; and (e) Sai River. Panel (f) shows the CCTV image capturing the tsunami at the site 3 shown in the panel (b). Numbers in the figure correspond to those listed in table 1.
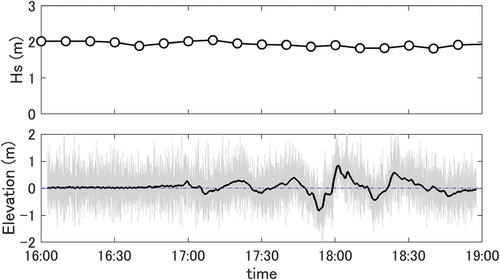
shows the time variations in the significant wave heights and the water surface levels that were observed at the Tokumitsu wave gauge station that was located offshore from site 8 with a water depth of 5.7 m. In the bottom panel, the thin gray line indicates the recorded water levels with a time interval of 0.5 s, and the solid black line indicates the filtered water levels using the Gaussian filter with a time variance of 15 s. These plotted time-varying elevations were determined as the difference between observed original water levels and the astronomical tides recorded at the Mikuni tide gauge station (JMA). The significant wave heights shown in the top panel were determined from the time-varying differences of these two water levels over 20 min around the plotted time with 5-min intervals. While the high-frequency fluctuations shown by the gray line indicate the significant influence of wind waves during the event, the filtered profile that is shown by the black line exhibits a clear tsunami-associated disturbance after 17:00. The greatest positive disturbance in the filtered water levels was observed just after 18:00. The CCTV video image shown in therefore captured this highest tsunami at approximately 18:00. The estimated significant wave height of approximately 2 m was nearly constant before and after the tsunami arrival.
Figure 4. Time profiles of the significant wave height (top) and the water surface level (bottom) observed at Tokumitsu wave gauge that is located offshore of the site 8. Thin gray line is recorded water level and black solid line is the filtered water level using Gaussian filter with time variance of 15 s.
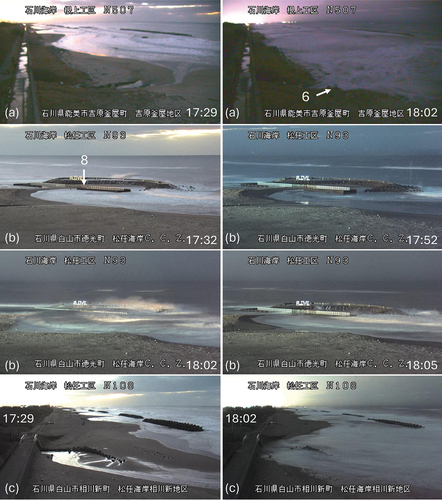
shows still images that were extracted from the video footage recorded by CCTV cameras that were installed at three different locations along the coast. Panel (a) shows images at Yoshihara Gamaya Coast (6) at 17:29 and at 18:02, when the water level rose and nearly reached its peak level (right). The runup reached the concrete blocks that are indicated by site number 6 in the figure. The measured elevation at the sand bed surface at the concrete blocks was TP 2.4 m. Panel (b) shows still images that were obtained at Matto Beach, which is known as the first beach designated as the coastal protection facility in Japan (Kato and Tajima Citation2023). As seen in the picture, the beach has a steel fence on the landward side of the headland. The water level decreased at 17:52 and rose to as high as the horizontal steel frame near the top of the fence at 18:02. This elevated water level remained high for a few minutes and then decreased at 18:05. The measured height at this horizontal frame indicated by site number 8 was TP 2.25 m. It should be noted that these measured tsunami heights along the coast were clearly greater than those at the other sites along the river. Panel (c) shows still images that were obtained from another CCTV camera that was installed on the eastern side of Matto Beach, where the outlet of the Kurabe River (9) is located. Clear debris lines and fallen vegetation were found approximately 470 m upstream from this outlet of the Kurabe River. As seen in the panel, the tsunami flowed into the river at 18:02 and thus supports the reliability of the tsunami traces observed along the Kurabe River.
Figure 5. CCTV images at: (a) Yoshihara Gamaya coast; (b) Matto coast; and (c) west end of Matto coast where the outlet of the Kurabe River is located.
3.2. Tsunami heights along Toyama Bay
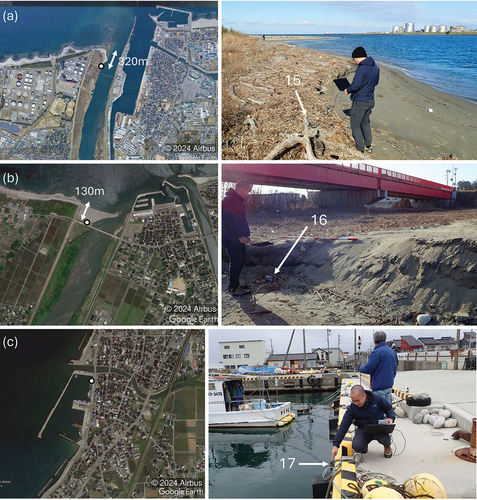
Several CCTV cameras also captured the tsunami along several rivers and the coastline around Toyama Bay. This study used CCTV video footage that was recorded at the Oyabe (11), Jinzu (15), Joganji (16), Kurobe (21) and Seki (23) Rivers and the Ikuji coast (20) to estimate the tsunami heights. shows the locations and pictures of the tsunami traces on the Jinzu River (15), the Joganji River (16), and Uozu South Port (17). While clear tsunami propagation in the upstream direction was observed in the video footage taken at the river mouths of the Jinzu and the Joganji Rivers, the tsunami that was observed in the field far from the camera did not allow us to accurately estimate the tsunami height. In the field survey, as shown in the right panels of , we found clear tsunami traces consisting of debris lines and new bank erosion. According to a local resident who often comes to fish, the left bank of the Jiuzu River had retreated significantly after the tsunami. It was also confirmed that these rivers had no significant river discharges, which may have disturbed the riverbanks during the period from the event on January 1st until February 4 2024, when the field survey was conducted. At Uozu South Port (17), a fisherman witnessed an elevated water level that rose to just below the ground level of the wharf. We also found debris lines along the waterway near the port at an elevation that was nearly equivalent to the ground level of the wharf. It was also obvious in CCTV video footage that the water level disturbance induced by wind waves was negligibly small before and after the tsunami arrival around these survey sites along the Jinzu and the Joganji Rivers.
Figure 6. Satellite views and pictures of survey sites along Toyama Bay: (a) Jinzu River; (b) Joganji River and (c) Uozu South Port. Numbers correspond to the site numbers listed in table 2. Pictures were taken on February 4th, 2024.
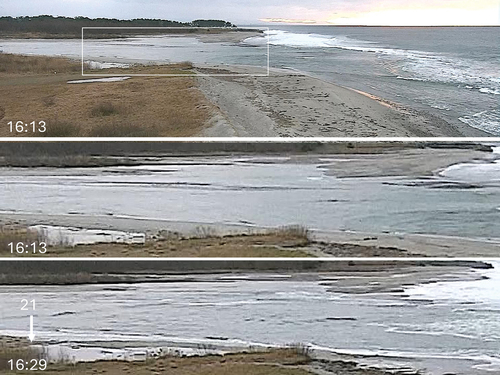
shows still images that were extracted from CCTV video footage recorded at the Kurobe River (21). In the video footage, intermittent wave propagation in the upstream direction along the river was observed even before the earthquake at 16:10. This feature highlights the nonnegligible influence of rough wind waves and the associated infra-gravity waves when evaluating of the pure impact of the tsunami during this event. However, a clearly greater penetration of the undular bore was observed at 16:29, as shown in . A part of the sand bank was inundated by this bore, and a debris line was also found along the bank in the field survey. The measured elevation of the debris line was 0.89 m on the TP.
Figure 7. CCTV images at the Kurobe River mouth before and after the tsunami arrival. White rectangular frame indicates the domain of the middle and bottom images.
In , the highest peak water levels that were recorded by the Toyama and Ikuji tide gauges (14 & 19) are also listed. The Toyama tide gauge is mounted near the mouth of the Jinzu River (15), and the Ikuji tide gauge is mounted on the sloping seawall at the Ikuji coast. The observed water level data were filtered using a 1-min moving average and recorded with time intervals of 15 sec and 1 min at the Toyama and Ikuji tide gauges, respectively. It should be noted that the differences between (b) AT and (c) WL0, shown in both and , fall within the range of a few centimeters, indicating a relatively insignificant influence of the wave-associated setup and surf beat on the tsunami height measurements at these survey sites along the river. This nonsignificant difference supports the reliability of the survey results in this report for evaluating the pure impact of the tsunami.
4. Observed time profiles of the tsunami around Toyama Bay
This section compares the time profiles for the water levels around Toyama Bay and the Niigata coast. In addition to the tide gauges shown in , we used the water level data that were recorded by four wave gauges and another tide gauge. In addition, time-varying water level fluctuations were also extracted from the CCTV video footage.
4.1. Extraction of water surface level profiles from the CCTV data
show examples of a portion of the water level profiles that were extracted from the CCTV video footage captured at the Oyabe River (11), Ikuji coast (20), and the Seki River (23), respectively. In the field survey, we measured the horizontal coordinates and vertical elevations of the reference points that were captured in the videos. Based on these coordinates, the pixel data along the vertical lines at the points specified in were extracted using an image rectification technique (e.g. Tajima et al. Citation2018). The line pixel data that were extracted from the succeeding time frames of each video footage were then placed one by one in the horizontal direction to create the time stack image with a time interval of 0.5 s. While the frame rate of the CCTV videos was 30 fps, we extracted images every 0.5 s to create the time stack images. Examples of these time stack images are shown in the bottom panels of . In the images, the horizontal axes indicate times, and the vertical axes indicate the vertical distances at which the measured elevations and vertical length scales are specified.
Figure 8. CCTV images at the Oyabe River (top three panels) and a part of the time stack image with extracted instantaneous(red) and filtered (light blue) water surface profile (bottom).
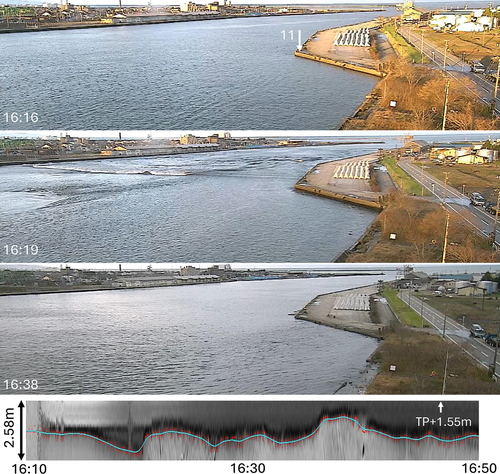
Figure 9. CCTV images at Ikuji coast (top two panels) and a part of the time stack image with extracted instantaneous(red) and filtered (light blue) water surface profile (bottom).
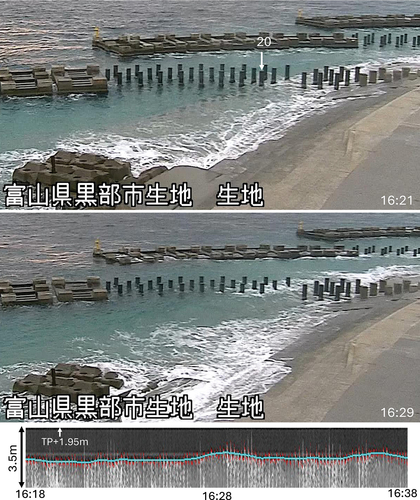
Figure 10. CCTV images at the Seki River (top three panels) and a part of the time stack image with extracted instantaneous(red) and filtered (light blue) water surface profile (bottom).
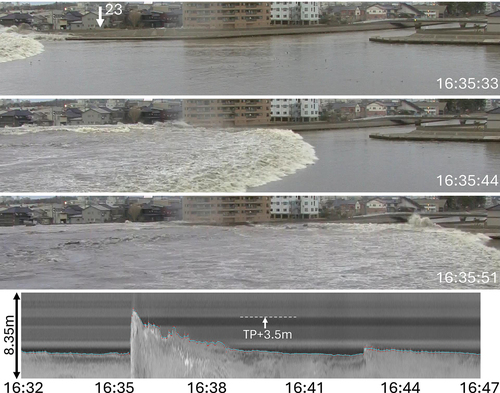
To extract the water surface levels in the obtained time stack images, we applied an edge detection filter based on the Haal function in the vertical direction and a Gaussian function in the horizontal time direction (Tajima et al. Citation2019) with a time variance of σ = 1 s. The extracted water surface boundaries are plotted as red lines on the time stack images shown in the bottom panels of . Finally, a Gaussian filter was applied to remove the high-frequency component of the obtained water level fluctuations. The light blue lines on the time-stack images indicate the filtered water surface profiles. The same procedures were applied to the CCTV footage that was obtained along the bridge pier near the outlet of the Ohkozu Diversion Channel (26). The variance of the Gaussian filter was set to σ = 15 s for the time profiles at the Oyabe River (11), Ikuji coast (20), and Ohkozu Diversion Channel (26) and σ = 3 s for the time profile at the Seki River (23). While the time profiles at the Oyabe River and Ikuji coast showed significant fluctuations due to wind waves and camera shaking induced by the aftershock of the earthquake, such influence of wind waves was insignificant in the time-stack image at the Seki River. In addition, the tsunami bore propagation along the Seki River showed an abrupt increase in the water level. To maintain the time profile of such abrupt water level changes around the bore, a Gaussian filter with a shorter σ = 3 s was applied to the time profile at the Seki River. It should also be noted that the peak water level of the first bore at the Seki River was higher than the crown level of the right side bank levee, that is TP 3.5 m. Another piece of video footage captured the tsunami propagation along the other left side bank of the Seki River. In this video footage, the tsunami did not overflow the levee with the same crown height, TP 3.5 m, while the water level rose to nearly as high as the crown level.
4.2. Time profiles of water surface levels
compares the time profiles of the sea level anomalies that were obtained from the tide gauges, wave gauges, and those extracted from the CCTV video footage using the aforementioned image analysis. The numbers on the right side of the figure indicate the site locations where each profile was obtained. In addition to the aforementioned tide gauge data at Toyama and Ikuji, also shows the tide gauge data at Fushiki Toyama (12), the wave gauge data at Toyama (13) and Naoetsu (24) of NOWPHAS (Nationwide Ocean Wave Information Network for Ports and Harbors, https://www.mlit.go.jp/kowan/nowphas/index_eng.html), and the wave gauge data at the Ishida and Tanaka stations (18 and 22). All of these data were provided by MLIT. The coordinates and water depths of these observation stations are shown in and .
Figure 11. Time profiles of the instantaneous and filtered sea level anomaly obtained by tide gauge (TG), wave gauge (WG) and those extracted from CCTV video images. Numbers on the right side of the figure indicate the observation sites: (11) Oyabe River CCTV; (12) Fushiki Toyama TG; (13) Toyama WG; (14) Toyama TG; (15) Jinzu River water level gauge; (18) Ishida WG; (19) Ikuji TG; (20) Ikuji coast CCTV; (22) Tanaka WG; (23) Seki River CCTV; (24) Naoetsu WG; and (26) Ohkozu Channel CCTV.
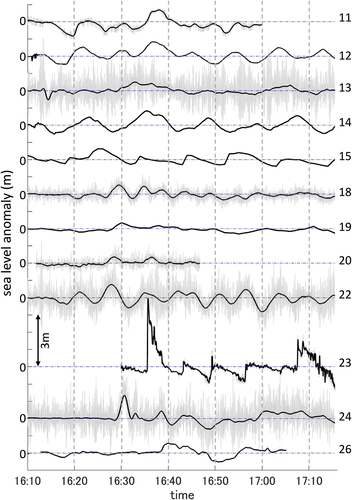
Table 3. Location, time, and elevation of the observed first negative peak of the tsunami around Toyama Bay.
In the figure, the horizontal and vertical axes are the times based on the JST and the vertical distances, respectively, and the horizontal blue-dashed lines indicate the zero level for each time profile. The sea level anomalies were determined by calculating the differences between the observed water levels and the astronomical tide levels at the corresponding times. As discussed in the estimation of AT in and , the astronomical tides at each site and at the respective times were determined by those at the Toyama tide gauge for the time profiles at 11, 12, 13, 14, 15, 18, 19, 20, and 22; the Naoetsu tide gauge for the time profiles at 23 and 24; and the Kashiwazaki tide gauge for the profile at 26. Notably, the tidal variations at these gauges from 16:00 to 17:00 on January 1 2024, were approximately 1 cm and thus had little influence on the temporal variations in the estimated sea level anomalies. The thin gray lines are the recorded water level data with time intervals of 0.5 s, and the solid black lines are the filtered profiles using a Gaussian filter with a time variance of σ = 3 s for 23, the Seki River, and σ = 15 s for the others.
As shown in the figure, the filtered profiles, plotted as black solid lines, clearly exhibit larger fluctuations for a few or several minutes after the earthquake at 16:10, indicating the tsunami arrival at each site. In the profiles of the wave gauge data at Toyama (13), Tanaka (22) and Naoetsu (24), the amplitudes of the nonfiltered water level fluctuations, shown as thin gray lines, are significantly larger than those of the filtered profiles. shows the time-varying significant wave heights for the time profiles at Toyama (13), Ishida (18), Ikuji (20), Tanaka (22), and Naoetsu (24). Larger significant wave heights of approximately 2 m were observed at the aforementioned tide gauges, namely, Toyama, Tanaka and Naoetsu. The significant wave heights at Ishida (18) and Ikuji (20) were less than half of the others. This may be because these two sites are located on the east side of Toyama Bay and are partially shaded by convex coastlines around the mouth of the Kurobe River (21). These observed dominant amplitudes of the wave-associated water level fluctuations also indicate the significant influence of wind waves on the observed runups and water marks on the coast. Compared to the water level profiles that were extracted from CCTV images at the Ikuji coast (20), the profiles from other CCTV images at the Oyabe River (11), the Seki River (23) and the Ohkozu Diversion Channel (26) showed little differences between the filtered and nonfiltered profiles, indicating relatively insignificant influences of waves on the observed tsunami traces along the river.
Figure 12. Significant wave heights observed at five observation sites: (13) Toyama WG; (18) Ishida WG; (20) Ikuji coast CCTV; (22) Tanaka WG; and (24) Naoetsu WG.
The filtered profile that was extracted from CCTV footage at the Ikuji coast (20) showed a similar trend to the profile of the Ikuji tide gauge data (19). The arrival time of the first positive peak at site 20 was approximately 90 s earlier than that at site 19. This difference may be due to the differences between these two locations: the location of the CCTV image is approximately 950 m north of the location of the Ikuji tide gauge. This time difference may be consistent with the expected location of the tsunami source, which is located near the northeastern tip of the Noto Peninsula, which is north of the Ikuji coast.
In most profiles shown in , the water surface levels first drop before the arrival of the positive tsunami peak, and the times of the first negative peaks tend to be earlier for the profiles inside Toyama Bay than for those outside of the bay, such as Ikuji (19 & 20) and Tanaka (22). summarizes the times and elevations of the observed negative peaks in the water levels at each point. Since the observation points inside Toyama Bay are located south of those at Ikuji (19) and Tanaka (22), the tsunami source around the fault that is located around the northeastern tip of the Noto Peninsula cannot explain the observed time differences of these first negative peaks. Therefore, based on these time differences for the negative peaks, it can be deduced that other tsunami sources may have existed inside Toyama Bay. Masuda et al. (Citation2024) also suggest the possible influence of landslide-induced tsunami along Toyama Bay. This hypothesis is also supported by the observed slope failure near the Jinzu River mouth reported by Japan Coast Guard (Citation2024).
To investigate the potential locations of such tsunami sources, the travel times of the long waves to/from the observation points were investigated. In this analysis, linear shallow water equations were applied to calculate the long wave propagation from a unit source at each observation point, namely, 11, 12, 13, 14, 18, 19, 22, and 24, as shown in . The initial water level displacement around the coordinate of the unit source, ,was determined by the following 2D Gaussian function:
with the horizontal variance, , set to 1 km. A spherical coordinate system with a grid size of 3 s was applied, and the bathymetry data were obtained from an M7000 Digital Bathymetric Chart that was provided by the Japan Hydrographic Association. Since the bathymetry data have no water depth data along the river, the unit source for the Oyabe River (11) was placed at the first water grid seaward from the river mouth. For each computation from each unit source, the computed water level fluctuations were monitored for each grid in the entire computational domain, and the arrival times of the first positive peaks of the computed water levels were recorded.
shows the spatial distribution of the areas in which the travel times from each point fall within a 1-minute time range around the time of the first negative peak at each point listed in . Note that the peak time at the Oyabe River decreased by 1 minute since the unit source was placed in front of the river mouth, and the travel time of the tsunami from the mouth to the observation point was approximately 1 minute according to the video footage. The areas obtained for each point, which are indicated by the shaded grids, appear as circular bands surrounding each point. The numbers beside these circular band domains indicate the corresponding observation point at which the unit point source was placed. The shaded areas are darker if the areas from different observation points overlap with each other. The rightmost partial circular band is the one for the Naoetsu wave gauge (24), which is located outside of . Since the travel times in these band areas indicate the first arrival time of the tsunami, the tsunami source should exist on or slightly inside these circular band domains accounting for the delay of the land slide after the earthquake. Given that these tsunami sources were likely due to landslides that were induced by the earthquake, these sources were most likely located on or in the vicinity of steep slopes. In addition, the areas where circular bands from different points overlap can be the tsunami sources of multiple points. By considering these deductions, the areas that are indicated by red dashed line circles may be potential locations of tsunami sources that are due to landslides. Notably, no single tsunami source can explain the observed negative peaks at all of these observation points; thus, landslides must have occurred at multiple locations. It should be noted that these circles may miss other potential tsunami sources due to insufficient number of measured tsunami data especially on the west side of Toyama Bay.
Figure 13. Spatial distribution of 1 min-band ranges of travel time to each observation sites: (11) Oyabe River CCTV; (12) Fushiki toyama TG; (13) Toyama WG; (14) Toyama TG; (18) Ishida WG; (19) Ikuji TG; (22) Tanaka WG; and (24) Naoetsu WG. Numbers in blue letters near shaded band indicate the corresponding observation site where the unit source was placed. Blank circles in red dashed line indicate the potential locations of the tsunami source that can represent the observed first negative peak of tsunami at each site.
5. Conclusions
This manuscript presents the results of a field survey and a supplementary analysis for investigating the tsunami characteristics that were caused by the 2024 Noto Peninsula Earthquake. Since it was anticipated that the tsunami behavior along the coast away from the peninsula should have been significantly affected by rough wind waves during the event, the field survey was mainly conducted in the lower reaches of the rivers along the coast. Video images taken by CCTV cameras that were installed along the coast and rivers were used for onsite detections of tsunami traces. In addition, image analyses was conducted to extract the time-varying water level profiles from these video images.
Wind-generated waves had little influence on the observed tsunamis along the lower reaches of the rivers, and the measured tsunami heights were consistent with each other in the nearby field and lower than those measured on the coast. At most of the survey sites, the highest tsunami traces were created not by the first tsunami but by the following tsunami. Along Toyama Bay, the tsunami water levels first decreased within a few or several minutes after the earthquake, and the arrival time of this negative peak of the tsunami tended to be earlier in the southern part of the bay. Through the supplementary analysis of the propagation distance over the observed arrival times of the first negative peaks, it was deduced that multiple additional tsunami sources may have been present inside Toyama Bay.
Acknowledgments
Authors acknowledge that CCTV video footage was provided by Hokuriku Regional Development Bureau of Ministry of Land, Infrastructure, Transport and Tourism (MLIT), and wave and tide gauge data were provided by Hokuriku Regional Development Bureau and Ports and Harbours Bureau of MLIT.
Disclosure statement
No potential conflict of interest was reported by the author(s).
References
- Fritz, H. M., D. A. Phillips, A. Okayasu, T. Shimozono, H. Liu, F. Mohammed, V. Skanavis, C. E. Synolakis, and T. Takahashi. 2012. “The 2011 Japan Tsunami Current Velocity Measurements from Survivor Videos at Kesennuma Bay Using LiDAR.” Geophysical Research Letters 39 (7): L00G23. https://doi.org/10.1029/2011GL050686.
- Fujii, Y., and K. Satake. 2024. “Slip Distribution of the 2024 Noto Peninsula Earthquake (MJMA 7.6) Estimated from Tsunami Waveforms and GNSS Data.” Earth Planets & Space 76 (1): 44. https://doi.org/10.1186/s40623-024-01991-z.
- Hattori, N., Y. Tajima, Y. Yamanaka, and K. Kumagai. 2020. “Study on the Influence of Infragravity Waves on Inundation Characteristics at Minami-Ashiyahama in Osaka Bau Induced by the 2018 Typhoon Jebi.” Coastal Engineering Journal 62 (2): 182–197. https://doi.org/10.1080/21664250.2020.1724247.
- Hokkaido Tsunami Survey Group. 1993. “Tsunami Devastates Japanese Coastal Region.” Eos Transactions American Geophysical Union 74 (37): 417–432. https://doi.org/10.1029/93EO00521.
- Japan Coast Guard. 2024. “Trace of the Slope Failure Found in the Sea Bottom of Toyama Bay.” Accessed June 29, 2024. https://www.kaiho.mlit.go.jp/info/kouhou/r6/k240124/k240124.pdf.
- JMA (Japan Meteorological Agency). 2024. “The 2024 Noto Peninsula Earthquake -Portal-. Accessed April 10, 2024. https://www.jma.go.jp/jma/en/2024_Noto_Peninsula_Earthquake/index.html.
- Kato, F., and Y. Tajima. 2023. “Coastal Adaptation to Climate Change in Japan: A Review.” Coastal Engineering Journal 65 (4): 597–619. https://doi.org/10.1080/21664250.2023.2259187.
- Masuda, H., D. Sugawara, A. C. Cheng, A. Suppasri, Y. Shigihara, S. Kure, and F. Imamura. 2024. “Modeling the 2024 Noto Peninsula Earthquake Tsunami: Implications for Tsunami Sources in the Eastern Margin of the Japan Sea.” Geoscience Letters 11 (1): 29. https://doi.org/10.1186/s40562-024-00344-8Roeberv.
- Roeber, V., and Bricker, J. 2015. “Destructive Tsunami-Like Wave Generated by Surf Beat Over a Coral Reef During Typhoon Haiyan.” Natural Communication 6:7854. https://doi.org/10.1038/ncomms8854.
- Shuto, N. 1985. “The Nihonkai-Chubu Earthquake Tsunami on the North Akita Coast.” Coastal Engineering in Japan 28 (1): 255–264. https://doi.org/10.1080/05785634.1985.11924420.
- Tajima, Y., T. Takagawa, S. Sato, and S. Takewaka. 2018. “Collapse and Recovery Process of the Sand Spit at the Tenryu River Mouth on the Pacific Coast of Japan, Coast.” Engineering Journal 60 (4): 532–547. https://doi.org/10.1080/21664250.2018.1546264.
- Tajima, Y., L. Wu, T. Fuse, T. Shimozono, and S. Sato. 2019. “Study on Shoreline Monitoring System Based on Satellite SAR Imagery.” Coastal Engineering Journal 61 (3): 401–421. https://doi.org/10.1080/21664250.2019.1619252.
- Tanioka, Y. 2008. “Analysis of the Tsunami Generated by the 2007 Noto Hanto Earthquake.” Earth Planets & Space 60 (2): 123–125. https://doi.org/10.1186/BF03352772.
- Yamanaka, Y., and T. Shimozono. 2022. “Tsunami Inundation Characteristics Along the Japan Sea Coastline: Effect of Dunes, Breakwaters, and Rivers.” Earth Planets & Space 74 (1): 19. https://doi.org/10.1186/s40623-022-01579-5.
- Yamanaka, Y., and Y. Tajima. 2021. “Numerical Investigation on Characteristics of Long Wave Components Amplified Under the 2018 Typhoons Jebi and Trami Observed Along the Coast of Wakayama, Japan.” Coastal Engineering Journal 64 (1): 100–115. https://doi.org/10.1080/21664250.2021.1997492.
- Yuhi, M., S. Umeda, M. Arita, J. Ninomiya, H. Gokon, T. Arikawa, T. Baba, et al. 2024. “Post-Event Survey of the 2024 Noto Peninsula Earthquake Tsunami in Japan.” Coastal Engineering Journal 1–14. https://doi.org/10.1080/21664250.2024.2368955.