
 ?Mathematical formulae have been encoded as MathML and are displayed in this HTML version using MathJax in order to improve their display. Uncheck the box to turn MathJax off. This feature requires Javascript. Click on a formula to zoom.
ABSTRACT
This paper proposes an alternative approach for analyzing the impacts of economic crises on consumption demand patterns in the absence of household consumption or price data. To do so, an Almost Ideal Demand System (AIDS) which incorporates time dummies corresponding to the periods of economic crises is estimated by using Turkish household final consumption data derived from national accounts. All findings are plausible and coherent with the theoretical framework and show that the crises significantly affect consumption demand patterns in Turkey. The study also reveals tax cuts of 2009 were designed on the basis of economic efficiency, although they were shown to be regressive by Albayrak ([2011. “Finansal Krizde Uygulanan Vergi Politikalarının Gelir Dağilimi Etkileri: 2004-2009.” Ankara Üniversitesi SBF Dergisi 66 (2): 001–034).
1. Introduction
Turkey experienced two heavy economic crises between 2000 and 2015. The first one started in 2001 – see Akyüz and Boratav (Citation2003), and the following one took place between 2008 and 2009. The economic crisis of 2001 was the worst in Turkey’s economic history and caused the national income to decrease more than 9 percent as stated in Akyüz and Boratav (Citation2003). The global economic crisis of 2008–2009 affected Turkey by causing a 5 percent decrease in GDP as mentioned in Soylu (Citation2009) whereas unemployment reached to 18 percent for 15–49 age group according to TURKSTAT (Citation2017d).Footnote2 As reported by WorldBank (Citation2017a), the percentage of the poor living under $1.9 per day constituted 1 percent of the total population by increasing 50 percent during the 2008–2009 economic crisis. In line with the rising poverty levels, benefits in cash and in kind increased 56 percent and 65 percent respectively, in the aftermath of 2001 economic crisis whereas the average rate of increase has been 20 percent for 2003–2017 period based on TURKSTAT (Citation2017a). As to 2008–2009 economic crisis, the number of households reimbursed benefits in cash and in kind increased 30 percent and 80 percent compared to 2007, again based on the TURKSTAT (Citation2017a).
Although this study does not attempt to provide a comprehensive analysis of social and psychological consequences of the economic crises affecting consumers (mainly due to lack of household demographic data which can be incorporated to the analysis presented here), it is worthwhile to acknowledge them to understand severity of the economic crises experienced by the Turkish consumers. For instance, according to TURKSTAT (Citation2017b), divorce rate increased 14 percent in 2009 compared to the previous year by hitting a record. A paper by Aytaç and Rankin (Citation2009) investigated the impact of 2001 economic crisis on family relations and showed that the 2001 economic crisis was significantly responsible for marital problems and dissolved family ties by mobilizing female and child labour mostly in informal sector as addressed in Yazici (Citation2012) – for a discussion on 2008–2009 economic crisis, see Aytaç, Rankin, and İbikoğlu (Citation2015). The impact of the economic crises can be observed individual level as well; a study by Ünal-Karagüven (Citation2009) discussed psychological impact of economic crises for Turkey and revealed that prevalence of anxiety and anger significantly rose during an economic crisis. Life satisfaction surveys conducted by TURKSTAT (Citation2017c) also reported a remarkable decline in general level of happiness for individuals during the economic crises.
Given its significant impact, previous studies on crises of Turkish economy did not attempt to quantify the economic impacts of crisis for households – see Cömert and Colak (Citation2014), Kaytaz and Gul (Citation2014), Kaya Bahçe and Memiş (Citation2013), Görkey Kesimli and Gokhan Gunay (Citation2011), Türel (Citation2010), Okumus and Karamustafa (Citation2005). In this frame, this paper documents the impact of crises for the first time, in terms of consumption demand by using Almost Ideal Demand System (AIDS), a method introduced by the seminal work of Deaton and Muellbauer (Citation1980).
To estimate an AIDS model, it is required to know the budget shares devoted to each commodity group as the dependent variable of the model. Natural logarithm of price and total expenditure is also required as the right-hand side (independent) variables. Although there is household budget survey (HBSs) on consumption expenditureFootnote3 in Turkey, these datasets lack the price data, instead providing total consumption of household per product without giving any information on quantities consumed. Otherwise, price per product could be found by dividing total consumption into quantity consumed.
Moreover, excluding HBS of 2003, other HBSsFootnote4 do not publicly provide the spatial information or month in which households were surveyed which are requisites to achieve variance in prices.Footnote5 Consequently, building up a pseudo panel data and achieving price variation by using spatial information or month in which households are surveyed is currently unattainable. These difficulties of achieving price variation in HBS were already addressed by Ardic, Erus, and Soydan (Citation2010) and their study could merely use HBS of 2003, in order to estimate an AIDS model for Turkey.
Given the absence of variation in price data, this research is bound to use domestic final consumption expenditure data derived from the national accounts for which a price index is also accompanying. Data frequency is quarterly, and it starts from the first quarter of 1998 and ends with the first quarter of 2016, so there are 73 observations in sum. There are 10 different commodity categories which can be summarized as food, clothing, housing, durables, health, transport, culture, education, tourism, and miscellaneous goods.
The demand estimation in Turkey was initiated in the 1980s by Kaytaz (Citation1988), however the estimation results of the following works were based on regional primary data collection as in Hanta and Yurdakul (Citation1995) and the estimation output were far from providing evidence at the national level. With the official publication of the first comprehensive household budget survey data by TURKSTAT in 1987, the early national level demand estimation results were obtained by Akkaya (Citation1987). However, these pioneering studies could not be reinforced by further research since the next household budget survey data were published by TURKSTAT only in 1994. Due to the lack of adequate data for carrying out detailed analyses, almost all the research mainly tried to reveal food demand structure in Turkey. These studies aimed to map the demand of households for the meat and dairy products in response to price changes as presented in Koç and Tan (Citation2001). Following these earlier works, recent demand system estimations are still mainly on household food consumption in Turkey like Şengül (Citation2004), Akbay, Boz, and Chern (Citation2007a), Armagan and Akbay (Citation2008), Özçelik and Şahinli (Citation2009) and Şahinli and Fidan (Citation2012), Bilgic and Yen (Citation2013). Prior to work of Ardic, Erus, Soydan (Citation2010), AIDS was implemented on Turkish household consumption data by Koc and Alpay (Citation2000) by generating a built-up price index derived from spatial cost information. This is a method to achieve variation in prices in the absence of price data as recommended in Deaton (Citation1988). Recently Aktuna-Gunes, Gardes, and Starzec (Citation2014) also estimated another AIDS model for Turkey considering the informal economy, by using HBS data with author built-up price index. Apart from these three studies, there is no demand system estimation with the current dataset that reveals long-run elasticity figures, so the paper fills an important gap in the literature.
The contribution of this research can be outlined as follows: This study uses real prices rather than any artificially built-up price index. Time-series data derived from national accounts is used to derive elasticities rather than based on single-year observation with possible survey bias. Different than previous studies, it derives and analyses cross-price elasticities for crises. In this regard, this study is the first of its kind by measuring the impact of the economic crises on consumption patterns with the most possible disaggregated commodity classification. Besides, Clements and Chen (Citation1996) found strong similarities in consumption demand patterns at the international level applying the same commodity classification used in this study. Hence, results from this study may be relevant beyond Turkey.
2. Neoliberalization and Finance of the household budget
Most consumption demand analyses apply mainstream economic methods (including studies referred above) but neglect the political economy of consumption. When discussing consumption, Bourdieu (Citation2011) addresses social, cultural and economic dimensions of consumption, and acknowledges that it is eventually constrained by income which is the main tool for financing the consumer’s budget. To recall, this paper discusses budget (i.e. income) elasticities in the next sections, therefore, it becomes necessary to review consumption and income relationship from a political economy perspective. In this regard, this study follows a similar framework provided by Pietrykowski (Citation2007) which elaborates a political economic analysis of consumption by examining the links between income and consumption.
A relatively straightforward presentation of the consumption and income links regarding Turkish economy is not so different than some major Latin American economies underwent: Turkish economy, similar to Brazil, Argentina, and Mexico, transformed into a market economy (Bahçe and Köse Citation2017 prefers to call it neoliberalization, so does this study) as of 1990, as Epstein (Citation2005) expressed. The neoliberalization was accelerated through trade openness and integration to the global markets which also came with a wider access to the financial markets – for financial expansion in Turkey see Orhangazi (Citation2014). A spillover effect of the financial expansion at household level was observed through a steady increase in consumer loans, including the use of credit cards. In other words, a different means of financing consumer budget had emerged with the neoliberal transformation.
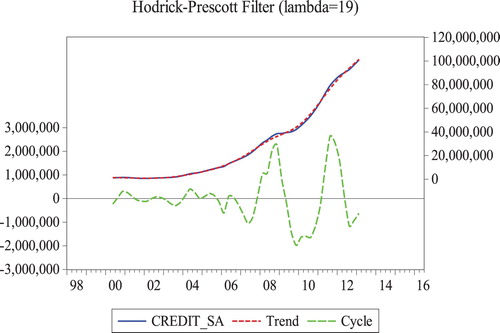
Nonetheless, trade openness brought about concerns for competitiveness and wages have not increased (for wage suppression in Turkey see Akcay (Citation2018)) as rapid as the consumer loans have. Diagram below shows the evolution of consumer loans for the 1998–2014 period.
In the Figure, straight line represents seasonally adjusted consumer loans, the short-dashed line shows the trend (i.e. how rapidly the expansion takes place) and long-dashed line captures periodicity of the consumer loans. As seen in , the consumer loan expansion started around 2004 and gained pace following the 2009 economic crisis. It is also seen that the credit expansion started to show irregular fluctuations with the economic crisis. It is particularly important to state the spikes observed in cycle line support that depreciation of the household income experienced during the 2009 economic crisis was compensated by increasing the consumer loans. This policy helped to stabilize macroeconomic policy rapidly by preventing a stronger decrease in aggregate demand. Financial institutions also benefitted from this by selling credit to more number of households but led the household debt to surge, for more details see Karacimen (Citation2014). Overall, economic slowdown of 2009 economic crisis was overcome by stimulating household consumption demand. In this regard, temporary tax cuts were also implemented to sustain household consumption. Impact of the tax policy change is evaluated in detail in the fourth section of this paper.
Figure 1. Evolution of consumer loans for 1998–2014 Term. Source: Data from Central Bank of Republic of Turkey, latest access online: April 2018.
A remarkable implication of the credit expansion has been that consumption inequality decreased less than the income inequality over 2002–2016 period: a study by Tamkoç and Torul (Citation2018) reveals that wage inequality lowered for this period and income inequality improved with the help of minimum wage regulations and increased social protection spending. In this respect, Turkey has become an exceptional case by reporting a higher consumption inequality than the income inequality compared to Canada, Germany, Italy, Mexico, Russia, Spain, Sweden, the UK and the US. Although Tamkoç and Torul (Citation2018) do not discuss the role of access to financial markets by households, a possible reason for the higher consumption inequality is the exclusive nature of the financial services: low-income groups are likely to benefit less from consumer loan expansion due to bearing higher default risk. shows the evolution of budget shares devoted to the household expenditure for major consumption groups per income quintile, for 2002–2016 period. It is prepared by using household budget surveys but, includes country-level figure for each consumption group, derived from national income statistics to facilitate comparison.
Figure 2. Budget shares for major consumption groups per Quintile 2002–2016.
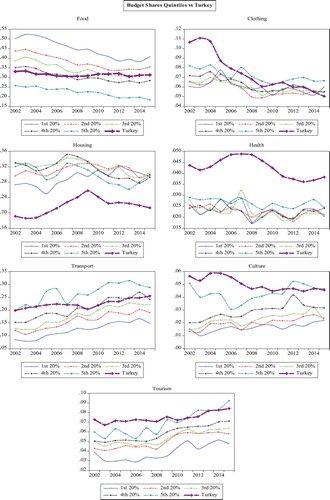
shows that consumers started to devote a smaller share of their budget to necessities which are food and clothing. Although housing is theoretically a necessity, it shows a decrease in its budget share only after 2008. A possible explanation is the rapid urbanization period recently observed in Turkey. According to WorldBank (Citation2017a) between 2000 and 2015 the urban population increased from 65 to 75 percent of the total population. Following that, the percentage of households live in rented houses has increased with the effect of urbanization and it led to an increase in rents. Ceritoglu (Citation2017) showed through HBS data that home ownership decreased by 6 percent between 2003 and 2014 despite the rise in income per capita: currently, the home ownership rate is around 60 percent in Turkey as stated in TURKSTAT (Citation2013). A possible reason of decline in the budget share of housing for all quantiles after 2008 can be explained by increasing availability of new apartments in urban areas. In order to increase the affordability of buying a house, the government directly intervened in the housing market via Housing Development Administration (HDA), which built more than 500 thousand dwellings for low-income groups – see Sarıoglu-Erdogdu (Citation2014) between 2003 and 2011. Additionally, a mortgage system which offers a lower interest rate for housing loans was introduced in 2007 for the first time in Turkey – see Sarıoglu-Erdogdu (Citation2014).
Increasing budget shares of tourism (i.e. restaurants and hotels) and transport are also related to the urbanization. Accordingly, urbanization comes with rising women employment, which is one of the main reasons behind the decrease in poverty as explained in Greulich, Dasre, and Inan (Citation2016). Declining household size and rising female labour led food away from home (FAFH) becoming prevalent as stated by Akbay, Tiryaki, and Gul (Citation2007b).
Lastly, forms evidence on changing consumption demand patterns at household level. In addition to the tourism, transport and culture consumptions (e.g. computer ownership, etc.) have shown remarkable increase particularly for higher quintiles. TURKSTAT (Citation2016c) states that in 2006, household computer ownership rate was 20 percent of the population, and the car ownership rate was 29 percent. In 2016, these figures increased to 51 percent and 44 percent, respectively.
The 2002–2016 period witnessed a transformation of consumption culture as a projection of urbanization and neoliberalization. As reported by Ozuduru, Varol, and Yalciner Ercoskun (Citation2014) total number of shopping malls in Turkey was around 50 but as of 2013 this number increased to 368 as stated in Erkip and Ozuduru (Citation2015). The booming of shopping malls corresponded to a period when exchange rates were relatively stable. Thanks to these, consumers have more constant access to imported goods, luxury brands, etc. The empirical model presented in the fourth section of this paper presents a more detailed analysis of luxuries and necessities.
3. Data and method
3.1. Data
The paper uses household consumption data derived from national accounts. This is split into 10 commodity categories. These categories and descriptive statistics are presented in . The dataset can be freely obtained from the Central Bank of Republic of Turkey (CBRT) via electronic data delivery system or from the TURKSTAT. The consumption data can be found either in nominal or in real terms, and this research uses data in real terms in order to eliminate the impact of inflation. As to the prices, they are readily available from TURKSTAT in terms of price indices for each commodity category. The frequency of dataset is quarterly and starts from the first quarter of 1998 and ends with the first quarter of 2016. In sum, there are 73 observations.
Table 1. Commodity groups and descriptive statistics.
3.2. Descriptive statistics on budget shares, price and consumer budget
According to data by CBRT (Citation2016) private consumption Turkey has the biggest share from the real GDP with an average of 68.4 percent between the first quarter of 1998 and the first quarter of 2016. This ratio is close to the US relevant figure, which according to the WorldBank (Citation2017b) household final expenditure data is 68.3 percent and 4 percent higher than the UK’s one. The largest share of private consumption is devoted to food category (including food, beverages, alcohol, and tobacco), and this spending is followed by transport and communication expenditures. Budget shares of services like health, education and tourism have the lowest share in total expenditure. The low budget shares for the health and the education groups are expected. These services are mainly provided free by the government, and as mentioned in Albayrak (Citation2010) private spending of education and health is mostly limited to top income groups. The budget shares shown in are largely in line with the evidence presented by Ardic, Erus, and Soydan (Citation2010). There are slight variations due to the use of different datasets, but the ranking of the commodity budget shares follows a similar pattern. The only exception is that this research identifies transport and communication as the second largest share whereas Ardic, Erus, Soydan (Citation2010) as the largest share for residence and energy. This difference likely arises from using different datasets with different commodity classification. Ardic, Erus, Soydan (Citation2010) uses HBS of 2003 which treats transport and communication separately since they followed the 12-group COICOP,Footnote6 while the dataset used in this chapter merges transport and communication into one group.
The growth rate of price index points out consumer price inflation (CPI) which is obtained by imposing compound growth rate formula.Footnote7 A basic analysis on inflation for commodity groups is shown in the last three columns of .
Turkey had experienced persistent inflation during the 1990s, as discussed in Dibooglu and Kibritcioglu (Citation2004) and Kibritçioğlu (Citation2001). After the economic crisis of February 2001, a variety of inflation targeting policies have been adopted and a sharp decline has been experienced, as discussed in Çiçek and Akar (Citation2013). The impact of inflation targeting can be appreciated in : compared to the first five-year period, the following five-year periods have significantly lower inflation. The sum of the four commodity groups with the largest budget shares accounts for more than 65 percent of the overall consumer expenditure. Food, housing, and transport inflation constantly declined for the second and third five-year periods. Durables’ inflation significantly declined in the second five-year period but experienced an increase in the last five-year period. Another interesting observation regards food inflation. While in the first quinquennium food recorded the ‘only’ the fourth highest inflation rate, in the following quinquennia it shows the second highest and the highest price increase, respectively. There may be several reasons for that. Although the country is self-sufficient in terms of food production according to FAO (Citation2012), agricultural production has heavily been based on petroleum products and fertilizers and has therefore been vulnerable to rampant oil prices – which significantly affected food prices in Turkey between 2007 and 2008 as discussed in Baskaya, Gurgur, and Ogunc (Citation2008). In addition, the Southeastern region of Turkey, where the major economic activity is agricultural production, suffered from extreme drought between May of 2007 to October of 2008 (Trigo, Gouveia, and Barriopedro Citation2010). These seem to be some of the reasons of the persistent food inflation during the second five-year period. For the last-five year period, Saghaian, Ozertan, and Tekguc (Citation2013) relate the food inflation to the meat and dairy product (particularly milk) price hike up. By using data from TURKSTAT, Saghaian, Ozertan, and Tekguc (Citation2013) shows that beef prices increased 106 percent and sheep 138 percent from 2005 to 2012. The study provides further details on meat and milk inflation and its impact on overall CPI. Persistent increase of meat and milk prices arises as a plausible reason for relatively higher food inflation rates compared to the other groups, after 2009. Finally, the increase experienced in (natural logarithm of) the total expenditure has been stable relative to the changes in CPI and declined steadily from the first five-year period to the last five-year period.
3.3. Model and estimation method
AIDS was developed in accordance with an indirect utility function which implies that the utility depends on exogenous variables like price, income etc. It has a PIGLOG functional form (Deaton and Muellbauer Citation1980) which allows the method to treat the aggregate consumer behavior as if it was single utility maximizing consumer behavior. This provides a flexible form for AIDS to be employed both with individual and aggregated household datasets. This expenditure function can be expressed as below:(1)
(1) where u denotes the level of utility and p is a price vector.
Since 0 < u < 1, a(p) can be interpreted as the cost for consumption for basic needs (or autonomous consumption) and b(p) as the welfare spending and both are built upon the price. In Deaton and Muellbauer (Citation1980) ln (a(p)) and ln (b(p)) are defined, respectively:(2)
(2)
(3)
(3)
Once the Equation (2) and Equation (3) are brought together, the universal form of cost equation for AIDS is obtained:(4)
(4)
Accordingly, when the logarithmic differential of the Equation (4) is computed, the new equation provides the budget share of commodities in respect to the price and utility. This is shown below:(5)
(5)
(6)
(6) These equations above express that the cost (c) is equal to the total expenditure (Y) of the consumer who pursues the utility maximization.
(7)
(7)
By rephrasing the u in terms of price and total expenditure with the help of EquationFootnote8 (7) and accommodating it in Equation (5) the universal form of AIDS demand function is accomplished:(8)
(8)
Here, wi is the budget-share term of good i while pj is the price of good j. Y is the total expenditure of household and P is the price index. are the parameters to be estimated. As Kebede (Citation2005) mentions there are more complicated price index to be employed in estimation, Deaton and Muellbauer (Citation1980) proposed that employing Stone price index which is given below do not distort the estimation outcome:
(9)
(9)
Once the Stone index is accommodated in Equation (8), the budget-share of a good becomes a linear function of the logarithm of the total expenditure. This provides that demand for a particular good is affected by prices of all goods consumed by the household and the total expenditure (Kebede Citation2005).
Furthermore, the parameters which are estimated via Equation (10) reflect the constraints of the utility function that are introduced above. Thus:(10)
(10)
The first three expressions represent the additivity. The fourth expression indicates the homogeneity and the fifth expression demonstrates the symmetry constraints.
Finally, aforementioned income and price elasticities have simple expressions in terms of the coefficients of the AIDS:(11)
(11)
(12)
(12)
(13)
(13)
(14)
(14)
(15)
(15)
In this study, the universal functional form of the AIDS (see Equation (8)) is expanded by adding time dummies corresponding to the economic crises. Time-series data may show numerous fluctuations and any of them may appear to be a legitimate reason to impose a time dummy, which draws attention to the effect of particular period on the dependent variable. An approach for detecting possible sections of time-series data for imposing dummy variable involves applying the Hodrick-Prescott (HP) filter, as done by Cariolle (Citation2012), and Becker and Mauro (Citation2006). In this framework, the HP filter decomposes trends and cyclical components in the data with time series features, by using a smoother that works as a tool for eliminating short-run fluctuations. In this way, it becomes possible to discuss changes by solely referring to the shifts in aggregate demand and supply, so the real income changes.
The smoother value is normally taken as 1600 for quarterly data, as suggested by Doorn (Citation2006), and Razzak (Citation1997). However, the studies by Alp et al. (Citation2011) , Yuksel et al. (Citation2011) and Saraçoglu, Yigit, and Koçak (Citation2014) argue that while smoother of 1600 is a suitable value for developed economies, but this value should be lower for a developing country like Turkey, since the fluctuations are more frequent and a greater smoother value can cause over-smoothing of fluctuations. All these studies estimate the smoother value to be either 98 or 19, in order not to over smooth the data – which could, otherwise, underrate significant fluctuations. This paper took 19 as the value of smoother in order to avoid overlooking a potentially important shift in data, which is later represented in the model estimation by a dummy variable.
The significant dummy figures in the AIDS model means the change in the budget share of the corresponding equation during the crises or reforms. Therefore, the new budget shares which take into account the effect of dummies are obtained to calculate price and budget elasticity figures by employing the elasticity formulae presented above, a method used in Barnett and Kanyama (Citation2013).
4. Results and discussion
4.1. Parameter Estimates
reports parameter estimates obtained from the restricted AIDS model with time dummies. After filtering the series, it is detected that an economic crisis dummy is required to be included in the estimations. The only exception is the budget share of culture which shows a significant shift after smoothing, for the post-2004 period. Instead of apparent fluctuations corresponding to the economic crises, the culture plot displayed a continuous downward slope from 2005 onwards. Indeed, once the culture equation is estimated with a crisis dummy, this is found to be insignificant. Two other commodity groups whose dummies were found to be insignificant are clothing and tourism. Considering the role of the economic crisis on consumption patterns, finding an insignificant crisis dummy for culture, clothing and tourism could indicate that these expenditures are likely to depend on household characteristics like income, age, education, living in urban or rural areas. Given that unavailability of demographic data in terms of time series format, this study is not able to test this explanation further.
Table 2. Restricted AIDS Parameter Estimates.
Interpretation of the AIDS parameters could be difficult since the dependent variable is neither total expenditure devoted to the commodity group nor the quantity, instead it is the budget share. Change in the budget share does not necessarily mean that total expenditure for this commodity group or amount of the consumption rises or declines. Therefore, parametric calculation of elasticities through the coefficients obtained from AIDS estimation is a more direct and easier way of interpreting estimation output ().
Table 3. Elasticities and PIE at means.
Various elasticity figures for periods of non-crises and crises are discussed below.
4.2. Elasticities and Pure income effect at means for restricted AIDS during crises and reforms
As discussed earlier, the impact of economic crises and reforms that commodity groups underwent are represented by the dummies introduced in the estimations. presents the elasticities during the crises and reforms for commodity groups whose dummies were significant. The elasticities presented below are derived in the light of Barnett and Kanyama (Citation2013), in which authors derived the elasticity formulae once AIDS model includes time-varying parameters (Barnett and Kanyama, Citation2013, see: 4176). Health has two different dummies: a crisis dummy, which represents the 2001 and 2009 economic crises and a reform dummy that is only valid from 2004 onwards. Turkish health system experienced an extensive reform that has been implemented since December 2003. As stated by Aktan, Pala, and Ilhan (Citation2014) and Akbulut, Sarp, and Ugurluoglu (Citation2006), healthcare reform favored privatization and brought about cuts in social benefits. In general, the reform focused on building cooperation and collaboration between public and private healthcare providers. Given this, one of the expected outcomes for healthcare reform is observing a more elastic own-price elasticity figure compared to the pre-reform own-price elasticity. In this frame, the 2009 period includes the effect of crisis and reform together whereas the 2001 period covers just the impact of the economic crisis. As a result, health has three elasticity figures calculated for each period.
Table 4. Elasticities and PIE at means during crises.
Excluding health, all other commodity groups’ BED figures changed remarkably during the crises or after reforms. While the food and transport BEDs increased, remaining BEDs decreased.
Food’s BED from the restricted model increased almost 7 percent during the economic crises. In other words, the BED of food gets closer to 1 during the crises, thus food demand approximated to be a quasi-luxury.Footnote9 It is the largest change in BED, in comparison to the other commodity groups. More budget –elastic food means that as budget shrinks, consumers quit a greater amount of food than a change in the budget during crises. This result unveils the impact of a budget fall during the economic crisis on food demand in terms of elasticity. There are two possible explanations for this change.
Increasing BED for food during crises affirms the study by Koyuncu and Şenses (Citation2004) which analyzed the impact of economic crises on food poverty (and also non-food poverty) in Turkey. Extra food consumption by the low-income groups could be given up easier than other fixed expenditure like rent, energy (contract-based, price-inelastic), or transport costs while the budget falls. For the high-income groups, the intention is slightly different. Duygan and Güner (Citation2006, see: 69) report that consumption inequality during the 1994 economic crisis declined. Authors claim that increasing interest rate, so a greater yield return for saving, promoted high-income groups to save money. As a result, the gap between quintiles narrowed down for all non-durables, including the food.
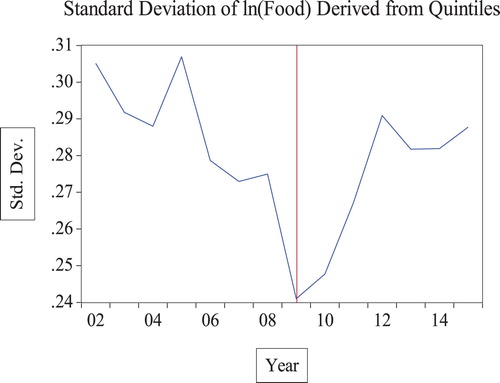
The validity of this argument for the 2002–2015Footnote10 period could be checked by using TURKSTAT HBS data which categorizes consumers in quintiles through consumption expenditure. As suggested in Altug and Filiztekin (Citation2006) and in Krueger and Perri (Citation2006), a simple inequality index could be used to picture evolution of the inequality of food consumption in Turkey.
To calculate the index, firstly natural logarithm of household food consumption shares is calculated to smooth the impact of outliers. Then the standard deviation of (natural logarithm) food consumption for each quantile is calculated. is prepared through this index and shows the evolution of food inequality for 2002–2015 term which includes the 2009 economic crisis. It could be seen that argument by Duygan and Güner (Citation2006) is also valid for another crisis year. High-income groups appeared to decrease food expenditure (most possibly by cutting down luxury food expenditure) during the crisis of 2009. To sum up, food is the most sensitive commodity group to the changes in consumers’ budget and possible reasons are as explained above.
Figure 3. Standard deviation of Food 2002–2015.
To the housing demand, the rate of change is relatively smaller, during the crises BED for housing decreased approximately 3 percent. The BED figure says that although the budget of the consumer increases during the crises, increase in demand for housing is smaller than normal times. This is a plausible outcome since the economic crises of 2001 and 2009 deeply affected the economy and side effects only vanished over a long time. Consequently, consumers appeared to cut down extra expenditure for housing as a precaution, thus remaining expenditure for housing became less responsive to the change in the budget.
As to durables and education, the BEDs fall. The rate of fall for durables is 1.1 percent and 1 percent for education. Once consumer budget changes during the crises, consumers give modest response for these commodities in comparison to food and housing. Education is mostly provided free by the government, so a fall in consumer budget may not create a solid effect on BED figure. In addition, the high-income groups mostly bear private education expenditure. As stated by OECD (Citation2013), crises deepen the income inequality and high income groups are less fragile. Given that, it could be understood the BED figure for education during the crises says that budget increase affects education demand less than economic expansion periods.
For the durables, demand responds relatively slowly to the changes in the budget during the crises. Determinants of the durables consumption in Turkey was analyzed by Duygan (Citation2005). In this study the author used the HBS of 1994 which could appear to be outdated, however as discussed by Özatay (Citation2000), it was another year of economic crisis in Turkey. Since the HBS survey answers were collected during an economic crisis and findings of the study covered the impact of the crisis for durables demand. Duygan (Citation2005) found that for durables consumption, immediate adjustment to the income changes was less likely to occur (Duygan, Citation2005, see: p. 14). The most likely reasons for this are large durables have a longer life span. When there is income uncertainty, like economic crises, the consumption of large durables could be delayed. However, durables do not solely consist of large appliances, otherwise a more significant decline in the BED could be expected. TURKSTAT (Citation2016b) detailed the HBS data and it shows that furnishing and household maintenance in sum stand for almost 60 percent of the durables’ expenditure. shows this by checking shares of different goods and services under the durables group. It starts with the earliest available year for HBS and ends with the latest, including the median year, 2008.
Figure 4. Goods and services classified under durable.
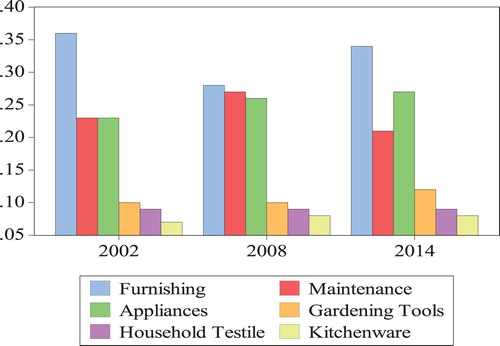
It also noted that appliances which represent almost 25 percent of the durables’ expenditure do not only include large durables but small ones. Small appliances which are reported under durables as well, have shorter life-span and they need to be replaced more often. In this frame, the consumption of small appliances could surpass the effect of the delayed large durables consumption. This seems to be one of the reasons for a relatively smaller change in the BED of durables during the crises.
As to the culture, a non-parametric investigation of Engel curve for culture demonstrates strong non-linearity. Consequently, the BED of culture is merely a proxy of true budget elasticity. Still, the BED meets the theoretical expectations: It is a luxury good and following the fast-economic growth period, it is less luxury.
Those budget effects discussed above can occur as a result of a price change as well. However, when prices are constant, but consumer’s income is increasing i.e. the budget increases, strongest demand response experienced in transport: if consumer’s budget increases by a thousand units, 137 units in a thousand will be devoted to transport and so forth. One of the reasons can be increasing public transport usage during the economic crises, although there is no study on Turkey about transport elasticities, public transport has been reported as an inferior good for the UK as in Paulley et al. (Citation2006). As soon as the consumer’s budget increase, people immediately want to shift private means of transport. Detailed transport and communication data obtained from HBSs by TURKSTAT (Citation2016a) shows that vehicle purchase during the crises declines by 4 percent whereas public transport spending rises by 8 percent. Another remarkable finding is that PIEs of durables, health, transport, and education decrease during the crises whereas PIEs of food with housing rise. This shows that budget expansion during crises leads to an increase in spending on food and housing primarily when prices are held constant. This is a plausible outcome: basic needs to be met first.
As to the price elasticity, during the crises, the strongest response to the price changes is observed for transport and then for durables. MPED for transport rises by 10 percent, and for durables 3 percent. Food, housing, and health report an increase in the price elasticity at 0.4 percent whereas education only changes by 0.1 percent. As seen, necessities show a reluctant increase in price elasticity, and education as being both necessity and largely a public good has a small response to price change during the crises. A remarkable finding is that health’s HPED declined almost 1 percent after the reform. Given that smaller HPED reflects the necessary nature of the product, it could be said that health consumption became less responsive to price changes and started to transform into a relatively necessary nature rather than being a luxury good. A similar case was observed for culture, its HPED falls by 0.6 percent in the post-2004 period. This change signals that culture expenditures (books, cameras, tours etc.) became relatively less responsive to price changes, so less luxury.
4.3. Cross-Price elasticities during crises
The effect of a change in income, i.e. the consumer’s budget, becomes more visible when cross-price elasticities are calculated for crisis periods (). presents the cross-elasticity figures calculated for crises periods. In a way, the cross-price elasticity figures presented below show how consumers adapt themselves to remarkably decreasing income during the crisis.
Table 5. Cross – Price elasticity at means.
Table 6. Cross – Price Elasticities at Means During the Crises.
To start with the Hicksian (net) substitutes, it is seen that excluding health and culture, all others remain the same for non-crisis periods – see . Additionally, all figures come up to be weak substitutions once again. However, elasticity figures remarkably change for two pairs: transport and tourism, also food and housing. Cross-price elasticity of demand figure for the former rose 9 percent and reduced 9 percent for the latter. Cross-price elasticity of demand for clothing and transport decreased 1 percent together with housing and health which decreased 2 percent compared to non-crisis periods. Besides, a pair of durables and tourism are not found to be substitutes anymore and is replaced by health and culture. The disappearance of durables and tourism pair can be related to the consumption tax cuts in 2009, as it had a direct effect on pricing of durables. Furthermore, culture arose to be a net substitute for health, a case which is not observed for cross-price elasticities calculated at means – see : This also appears to be a result of tax cuts.
Mathematical explanations for these figures are easier. As seen via Equation (13), budget share is the denominator, thus, greater cross-price elasticity figure is a result of smaller budget share and vice versa. Therefore, it is expected to find that cross-price elasticity figures for the pairs with one necessity (food, clothing, housing) to be smaller, since their budget share increases during the crises coherent with Engel’s law. Plausibly two luxuries (see ); transport and tourism became net substitutes. As to three necessities, they become weaker substitutes, since mainly consumption had been limited with essentials during the crises.
As to the Marshallian substitutes, with the impact of change in real income two very strong cross-price elasticity figures are observed: housing and durables, with clothing and durables. It is mentioned above that the government imposed a tax cut during the 2009 economic crisis. Two consumption taxes, special consumption tax (SCT) and value-added tax (VAT) underwent several rate changes during the 2009 economic crisis, which are presented below.
As seen in , the scope of the goods subject to the tax cut was wider for durables compared to other commodity groups. In other words, a number of goods subject to tax cut was greater for durables. Also, the duration of the tax cut was longer for durables. For these reasons, it is not surprising to see that cross-price elasticities during crises show a stronger substitution or complementary relation between durables and other goods.
Table 7. 2009 tax cuts.
It should also be considered that durables were not found to be a luxury good, it is a normal good (see ). Contrary to luxuries, its consumption does not strongly fall, while the consumer’s budget is contracting. Furthermore, durables were among one of the price elastic goods (see ). Therefore, it is seen that a tax cut which targets durables is basically an efficient policy to stimulate domestic consumption to achieve a quick recovery from crisis aftermath. This finding states that the Turkish government preferred tax efficiency over tax equity, as Albayrak (Citation2011) revealed that the tax cut policy was regressive, i.e. tax cuts during the crisis increased tax burden on taxpayers in the lowest income deciles.
These arguments are invigorated once the impact of the tax cut on the commodity price index is evaluated. shows how the prices of the relevant goods fluctuated; as expected the largest impact is observed for durables: initially price fell and the rise in the durables price was realized to be lower than the average. A similar impact in the price of housing is also observed. Nevertheless, transport and culture do not demonstrate a stable price fall pattern. To recall both were found to be luxuries and price elastic. Consumer population can be limited for these goods and additionally, their shares relatively low to affect the commodity price index.
Table 8. Percentage change in prices following the tax cut.
Assuming that these price changes occurred solely due to the tax cut, they can be used to interpret the cross-price elasticity figures. For instance, 1.76 percent decrease (April 2009) in the price of tourism generates a 1.41 percent decrease in tourism demand, as they are net substitutes. Similarly, once culture price decreased 0.19 (March 2009) percent, it generates roughly 0.09 percent increase in healthcare demand.
Another point to mention is that two pairs of commodities are found to be gross substitutes, yet on the other hand net complementary: housing and durables, then clothing and durables. To recall, Marshallian (uncompensated) figures capture both price and income effects, and the Hicksian (compensated) shows only the price effect. Given that once there is not an income effect, these pairs are complementary during the crises i.e. if the price of durables decreases demand for clothing and housing increases. But if the income effect is too significant during the crises it sharply falls and turns these goods into substitutes for each other. Once the figures are compared, it is seen that Hicksian elasticity is greater than Marshallian elasticity and emphasizing that these goods are complementary to each other rather than being substitutes.
Finally, food and durables are found to be strongly net complementary and this finding can be addressing the tax cut on durables: the lowered tax rates are imposed during the crisis when the income notably decreases, consequently budget share on food rises as stated by Engel’s law. Otherwise, there is not any significant cross-price elasticity figure for food and durables at means whereas the cross-price elasticity figures for housing and durables with clothing and durables can be observed at means as well.
5. Conclusion
This study is the first of its kind for analyzing consumption demand for Turkish economy during the crises, with a system approach. Different to previous AIDS estimations on Turkey this study does not limit itself to food consumption but focuses on a broad range of commodities in order to grasp a better understanding of consumption demand patterns in Turkey.
Due to an absence of price variation in the HBS data, this research is estimated by using domestic final consumption expenditure data derived from the national accounts for which a price index is also accompanying. The functional (mathematical) form of the AIDS model allows incorporation of demographic or trend parameters in the equation. By exploiting this feature of the AIDS model, a crisis dummy, and a health reform dummy are incorporated into the model.
A remarkable finding is that budget elasticity of food and housing increases during the crises, their consumption becomes more responsive to the changes in consumer’s budget. The food converges to a luxury good for two reasons: due to declining income it is less affordable by the poor. On the other hand, consumers in high-income quintiles decreased their food consumption to maintain saving rates. Two commodities which dominantly have public good nature, health, and education, show a subtle change in their budget elasticity figures during crises. Compensated price elasticity figures reveal that consumers became less responsive to the changes in the price of food which could be a result of limiting food consumption to necessities. According to the PIE figures, 13.7 unit would be spent on transport assuming that there was a 100-unit increase in consumer’s budget. It is also seen that during the non-crisis period, if consumer was given extra 100-unit income, she would spend 7.4 units on food, but during (?) this rose to 10.5 units.
Results on cross-price elasticities improved the answer on changing consumption demand patterns during the crisis. As expressed, a consumption tax cut at various rates was imposed on certain goods (see ) from March to September in 2009. The tax cuts were seen to affect prices almost immediately (see ), and durables are found to be a strong net complementary, and once income effect is considered it is found to be a strong gross substitute for clothing and housing. In other words, during the crisis consumers who can spend money on housing or clothing can also consume durables. However, if the income effect is considered, due to the decline in the consumer budget during the crisis, these goods become gross substitutes. It is also seen that tax cuts imposed on durables were an efficient way to encourage domestic consumption for a recovery from the crisis although they were previously found to be regressive by Albayrak (Citation2011). This forms evidence for taxation policy in Turkey as it prioritizes efficiency over equity at least during the economic crises.
Disclosure statement
No potential conflict of interest was reported by the author.
Notes
2 TURKSTAT is the abbreviation of Turkish Statistical Institute, the government agency which is responsible of producing official statistics on Turkey.
3 TURKSTAT regularly publishes household consumption expenditure surveys since 2002.
4 There are 15 available HBSs which start with 2002 and the most recent one is for 2016.
5 The absence of spatial data can be confirmed by checking the data guide of 2014 HBS on TURKSTAT’s web page. Please see: http://www.tuik.gov.tr/MicroVeri/HBA2014/english/data-guide/index.html
6 The classification of individual consumption by purpose is abbreviated as COICOP.
7 is the formula which was employed to obtain five-year growth rates in CPI.
8 For a detailed discussion the mathematical foundation of AIDS, please see Deaton and Muellbauer (Citation1980).
9 The BED figure is still less than 1, so the commodity groups are definitely not a luxury. However, BED figure increased and is now relatively closer to 1. Thus, it is preferably called as quasi-luxury.
10 HBS in Turkey started to be regularly conducted from 2002. This is the longest possible term for this analysis.
References
- Akbay, Cuma, Ismet Boz, and Wen S Chern. 2007. “Household Food Consumption in Turkey.” European Review of Agricultural Economics 34 (2): 209–232. doi: 10.1093/erae/jbm011
- Akbay, Cuma, Gulgun Yildiz Tiryaki, and Aykut Gul. 2007. “Consumer Characteristics Influencing Fast Food Consumption in Turkey.” Food Control 18 (8): 904–913. doi:10.1016/j.foodcont.2006.05.007.
- Akbulut, Yasemin, Nilgun Sarp, and Ece Ugurluoglu. 2006. “Reform of the Health Care System in Turkey: a Review of Universal Health Insurance.” World Hospitals and Health Services: the Official Journal of the International Hospital Federation 43 (1): 13–16.
- Akcay, Ümit. 2018. “ Neoliberal populism in Turkey and its crisis.” Working Paper, Institute for International Political Economy Berlin.
- Akkaya, Şahin. 1987. “Engel Eğrilerinin Ekonometrik Analizi Uygulamaları.” Dokuz Eylül Üniversitesi İktisadi ve İdari Bilimler Fakültesi Dergisi 2 (2): 179–199.
- Aktan, A. Ozdemir, Kayihan Pala, and Beyazit Ilhan. 2014. “Health-care Reform in Turkey: far From Perfect.” The Lancet 383 (9911): 25–26. doi:10.1016/S0140-6736(13)62725-7.
- Aktuna-Gunes, Armagan Tuna, François Gardes, and Christophe Starzec. 2014. “The Size of Informal Economy and Demand Elasticity Estimates Using Full Price Approach: A Case Study for Turkey .” No. 14088. Université Panthéon-Sorbonne (Paris 1), Centre d'Economie de la Sorbonne.
- Akyüz, Yilmaz, and Korkut Boratav. 2003. “The Making of the Turkish Financial Crisis.” World Development 31 (9): 1549–1566. doi:10.1016/S0305-750X(03)00108-6.
- Albayrak, Özlem. 2010. Redistributive Effects of Indirect Taxes in Turkey 2003. Ankyra: Ankara Üniversitesi Sosyal Bilimler Enstitüsü Dergisi.
- Albayrak, Özlem. 2011. “Finansal Krizde Uygulanan Vergi Politikalarının Gelir Dağilimi Etkileri: 2004-2009.” Ankara Üniversitesi SBF Dergisi 66 (02): 001–034. doi: 10.1501/SBFder_0000002202
- Alp, Harun, Yusuf Soner Başkaya, Mustafa Kilinc, and Canan Yüksel. 2011. “Estimating Optimal Hodrick-Prescott Filter Smoothing Parameter for Turkey.” Iktisat Isletme ve Finans 26 (306): 09–23.
- Altug, Sumru, and Alpay Filiztekin. 2006. The Turkish Economy: The Real Economy, Corporate Governance and Reform. Oxon: Psychology Press.
- Ardic, Oya Pinar, Burcay Erus, and Gurcan Soydan. 2010. “An Evaluation of Indirect Taxes in Turkey.” Economics Bulletin 30 (4): 2787–2801.
- Armagan, Goksel, and Cuma Akbay. 2008. “An Econometric Analysis of Urban Households’ Animal Products Consumption in Turkey.” Applied Economics 40 (15): 2029–2036. doi:10.1080/00036840600949256.
- Attfield, Clifford L. F. 1985. “Homogeneity and Endogeneity in Systems of Demand Equations.” Journal of Econometrics 27 (2): 197–209. doi:10.1016/0304-4076(85)90087-9.
- Aytaç, Işik A, and Bruce H Rankin. 2009. “Economic Crisis and Marital Problems in Turkey: Testing the Family Stress Model.” Journal of Marriage and Family 71 (3): 756–767. doi: 10.1111/j.1741-3737.2009.00631.x
- Aytaç, Işık A, Bruce H Rankin, and Arda İbikoğlu. 2015. “The Social Impact of the 2008 Global Economic Crisis on Neighborhoods, Households, and Individuals in Turkey.” Social Indicators Research 124 (1): 1–19. doi: 10.1007/s11205-014-0769-5
- Bahçe, Serdal, and Ahmet Haşim Köse. 2017. “Social Classes and the Neo-Liberal Poverty Regime in Turkey, 2002–2011.” Journal of Contemporary Asia 47 (4): 575–595. doi:10.1080/00472336.2017.1325919.
- Barnett, William A, and Isaac Kalonda Kanyama. 2013. “Time-varying Parameters in the Almost Ideal Demand System and the Rotterdam Model: Will the Best Specification Please Stand up?” Applied Economics 45 (29): 4169–4183. doi: 10.1080/00036846.2013.768014
- Baskaya, Y., Gurgur, T., and Ogunc, F. 2008. “Kuresel Isinma, Kuresellesme ve Gida Krizi-Turkiye'de Islenmis Gida Fiyatlari Uzerine Ampirik Bir Calisma.” Central Bank Review 8 (2): 1–32.
- Becker, Torbjorn, and Paolo Mauro. 2006. “Output Drops and the Shocks That Matter.” IMF Staff Papers, Working Paper 6, no. 172.
- Bilgic, Abdulbaki, and Steven T Yen. 2013. “Household Food Demand in Turkey: A two-Step Demand System Approach.” Food Policy 43: 267–277. doi: 10.1016/j.foodpol.2013.09.004
- Bourdieu, Pierre. 2011. “The Forms of Capital. (1986).” Cultural Theory: An Anthology 1: 81–93.
- Buse, Adolf. 1998. “Testing Homogeneity in the Linearized Almost Ideal Demand System.” American Journal of Agricultural Economics 80 (1): 208–220. doi: 10.2307/3180282
- Cariolle, Joël. 2012. Measuring macroeconomic volatility (Vol. 1, p. 49). Working Paper No 114 “Innovative Indicators” Series.
- CBRT. 2016. “ GDP-Expenditure based (At Current and Fixed (1998) Prices) (TURKSTAT)(New Series)TRY Thousand)(Archive), edited by TURKSTAT.
- Ceritoglu, Evren. 2017. Home-ownership, Housing Demand and Household Wealth Distribution in Turkey. Research and Monetary Policy Department, Central Bank of the Republic of Turkey.
- Çiçek, Serkan, and Cüneyt Akar. 2013. “The Asymmetry of Inflation Adjustment in Turkey.” Economic Modelling 31: 104–118. doi:10.1016/j.econmod.2012.11.026.
- Clements, Kenneth W., and Dongling Chen. 1996. “Fundamental similarities in consumer behaviour.” Applied Economics 28 (6): 747–757.
- Comert, Hasan, and Selman Colak. 2014. The Impacts of the Global Crisis on the Turkish Economy and Policy Responses, No. 1417. ERC-Economic Research Center, Middle East Technical University.
- Deaton, Angus. 1988. “Quality, Quantity, and Spatial Variation of Price.” The American Economic Review, 418–430.
- Deaton, Angus, and John Muellbauer. 1980. “An Almost Ideal Demand System.” The American Economic Review 70 (3): 312–326.
- Dibooglu, Sel, and Aykut Kibritcioglu. 2004. “Inflation, Output Growth, and Stabilization in Turkey, 1980–2002.” Journal of Economics and Business 56 (1): 43–61. doi: 10.1016/j.jeconbus.2003.04.001
- Doorn, D. 2006. “Consequences of Hodrick–Prescott Filtering for Parameter Estimation in a Structural Model of Inventory Behaviour.” Applied Economics 38 (16): 1863–1875. doi: 10.1080/00036840500427254
- Duygan, Burcu. 2005. “Aggregate Shocks, Idiosyncratic Risk, and Durable Goods Purchases: Evidence from Turkey’s 1994 Financial Crisis.” EUI Finance and Consumption Program Working Paper.
- Duygan, Burcu, and Nezih Güner. 2006. “Income and Consumption Inequality in Turkey.“ In The Turkish economy: The real economy, corporate governance and reform, 63–91. Oxon: Routledge.
- Epstein, Gerald A. 2005. Financialization and the World Economy. Bodmin: Edward Elgar.
- Erkip, Feyzan, and Burcu H Ozuduru. 2015. “Retail Development in Turkey: An Account After two Decades of Shopping Malls in the Urban Scene.” Progress in Planning 102: 1–33. doi: 10.1016/j.progress.2014.07.001
- FAO. 2012. FAO Statistical Pocket Book 2012 [cited 26 December 2016], p. 231. Available from http://www.fao.org/docrep/016/i2493e/i2493e.pdf.
- Gazette, Official. 2009. Legislation on Determination of Value Added Tax and Special Consumption Tax Rates to be applied to Some Goods. Ankara: Official Gazette. Number: 27260. Available online at http://www.resmigazete.gov.tr/eskiler/2009/06/20090616M1-1.htm
- Görkey Kesimli, Iffet, and Suleyman Gokhan Gunay. 2011. “The Impact of the Global Economic Crisis on Working Capital of Real Sector in Turkey.” Business & Economic Horizons 1 (4): 52–69.
- Greulich, Angela, Aurélien Dasre, and Ceren Inan. 2016. “Two or Three Children? Turkish Fertility at a Crossroads.” Population and Development Review 42 (3): 537–559. doi: 10.1111/j.1728-4457.2016.00148.x
- Hanta, Belgin, and O. Yurdakul. 1995. “Adana ili Kentsel Alanda Hayvansal Gıda Tüketim Yapısı.” Çukurova Üniversitesi Ziraat Fakültesi Dergisi 10 (2):169–184.
- Karacimen, Elif. 2014. “Financialization in Turkey: The Case of Consumer Debt.” Journal of Balkan and Near Eastern Studies 16 (2): 161–180. doi: 10.1080/19448953.2014.910393
- Kaya Bahçe, Seçil A., and Emel Memiş. 2013. “Estimating the Impact of the 2008–09 Economic Crisis on Work Time in Turkey.” Feminist Economics 9 (3): 181–207. doi: 10.1080/13545701.2013.786182
- Kaytaz, Mehmet. 1988. “Koşullu Talep Denklemleri ve Bir Uygulama.” Istanbul Universitesi Iktisat Fakultesi Mecmuasi 4 (45): 136–158.
- Kaytaz, Mehmet, and Misra C Gul. 2014. “Consumer Response to Economic Crisis and Lessons for Marketers: The Turkish Experience.” Journal of Business Research 67 (1): 2701–2706. doi: 10.1016/j.jbusres.2013.03.019
- Kebede, Bereket. 2005. “Intra-household Distribution of Expenditures in Rural Ethiopia: A Demand Systems Approach.” Poverty, Income Distribution and Labour Markets in Ethiopia. , 89–99. Sweden: Almqvist & Wiksell Trycker AB.
- Kibritçioğlu, Aykut. 2001. “Causes of Inflation in Turkey: A Literature Survey with Special Reference to Theories of Inflation.” University of Illinois at Urbana- Champaign, Office of Research Working Paper No. 01-0115.
- Koc, Ali, and Savas Alpay. 2000. Household Demand in Turkey: An Application of Almost Ideal Demand System with Spatial Cost Index. Bilkent University.
- Koç, Ali, and Sibel Tan. 2001. “The Demand for Dairy Products in Turkey: The Impact of Household Composition on Consumption.” METU Studies in Development 28 (1/2): 169–182.
- Koyuncu, Murat, and Fikret Şenses. 2004. “Kısa Dönem Krizlerin Sosyoekonomik Etkileri: Türkiye, Endonezya ve Arjantin Deneyimleri.” Ekonomik Araştırmalar Merkezi Araştırma Raporları 4: 14.
- Krueger, Dirk, and Fabrizio Perri. 2006. “Does Income Inequality Lead to Consumption Inequality? Evidence and Theory.” The Review of Economic Studies 73 (1): 163–193. doi: 10.1111/j.1467-937X.2006.00373.x
- OECD. 2013. “Crisis Squeezes Income Puts Pressure on Inequality and Poverty.” Results from the OECD Income Distribution Database.
- Okumus, Fevzi, and Kurtulus Karamustafa. 2005. “Impact of an Economic Crisis Evidence From Turkey.” Annals of Tourism Research 32 (4): 942–961. doi: 10.1016/j.annals.2005.04.001
- Orhangazi, Özgür. 2014. “Capital Flows and Credit Expansions in Turkey.” Review of Radical Political Economics 46 (4): 509–516. doi: 10.1177/0486613414537993
- Özatay, Fatih. 2000. “The 1994 Currency Crisis in Turkey.” The Journal of Policy Reform 3 (4): 327–352. doi: 10.1080/13841280008523409
- Özçelik, Ahmet, and Mehmet Arif Şahinli. 2009. Esnekliklerin Yaklaşık İdeal Talep Sistemi ile Tahmin Edilmesi: Türkiye Sonuçları.” AİBÜ-İİBF Ekonomik ve Sosyal Araştırmalar Dergisi.
- Ozuduru, Burcu H., Cigdem Varol, and Ozge Yalciner Ercoskun. 2014. “Do Shopping Centers Abate the Resilience of Shopping Streets? The co-Existence of Both Shopping Venues in Ankara, Turkey.” Cities 36 (Supplement C): 145–157. doi:10.1016/j.cities.2012.10.003.
- Paulley, Neil, Richard Balcombe, Roger Mackett, Helena Titheridge, John Preston, Mark Wardman, Jeremy Shires, and Peter White. 2006. “The Demand for Public Transport: The Effects of Fares, Quality of Service, Income and car Ownership.” Transport Policy 13 (4): 295–306. doi:10.1016/j.tranpol.2005.12.004.
- Pietrykowski, Bruce. 2007. “Exploring New Directions for Research in the Radical Political Economy of Consumption.” Review of Radical Political Economics 39 (2): 257–283. doi:10.1177/0486613407302487.
- Poi, Brian P. 2002. “From the Help Desk: Demand System Estimation.” Economic Theory 1: 1.
- Poi, B. P. 2004. “From the Help Desk: Some Bootstrapping Techniques.” Stata Journal 4 (3): 312–328. doi: 10.1177/1536867X0400400308
- Razzak, Weshah. 1997. “The Hodrick-Prescott Technique: A Smoother Versus a Filter: An Application to New Zealand GDP.” Economics Letters 57 (2): 163–168. doi: 10.1016/S0165-1765(97)00178-X
- Saghaian, Sayed, Gokhan Ozertan, and Hasan Tekguc. 2013. “Beef and Milk Price Links in Turkey.” Economics Bulletin 33 (4): 2607–2616.
- Şahinli, Mehmet Arif, and Halil Fidan. 2012. “Estimation of Food Demand in Turkey: Method of an Almost Ideal Demand System.” Quality & Quantity 46 (2): 653–663. doi: 10.1007/s11135-010-9419-4
- Saraçoglu, Bedriye, Özlem Yigit, and Necmettin Alpay Koçak. 2014. “Türkiye Için Çikti Açigi Tahmininde Alternatif Yöntemler/Alternative Methods Of Estimating Output Gap For Turkey.” Business and Economics Research Journal 5 (3): 43.
- Sarıoglu-Erdogdu, G. Pelin. 2014. “Housing Development and Policy Change: What has Changed in Turkey in the Last Decade in the Owner-Occupied and Rented Sectors?” Journal of Housing and the Built Environment 29 (1): 155–175. doi:10.1007/s10901-013-9368-z.
- Şengül, Seda. 2004. “Türkiye’de Gelir Gruplarına Göre Gıda Talebi.” ODTÜ Gelişme Dergisi 31 (1): 115–148.
- Soylu, Hülya. 2009. “Global Krize Karşı Politika Önlemleri ve Türkiye.” Maliye Dergisi 157: 251–266.
- Tamkoç, Mehmet Nazım, and Orhan Torul. 2018. Cross Sectional Facts for Macroeconomists: Wage, Income and Consumption Inequality in Turkey. Bogaziçi University, Working Papers, http://www.econ.boun….
- Trigo, Ricardo M., Célia M. Gouveia, and David Barriopedro. 2010. “The Intense 2007–2009 Drought in the Fertile Crescent: Impacts and Associated Atmospheric Circulation.” Agricultural and Forest Meteorology 150 (9): 1245–1257. doi:10.1016/j.agrformet.2010.05.006.
- Türel, Oktar. 2010. “Türkiye’de 1994, 2001 Ve 2008-9 Ekonomik Krizlerinin Karşılaştırmalı Analizi.” Ekonomik Yaklaşım 21 (75): 27–75. doi: 10.5455/ey.10704
- TURKSTAT. 2013. “ Population and Housing Census, 2011.” Ankara: TURKSTAT. Accessed 08.08.2017. http://www.tuik.gov.tr/Kitap.do?metod=KitapDetay&KT_ID=11&KITAP_ID=276.
- TURKSTAT. 2016. Consumer Expenditure Statistics [2016a2016]. https://biruni.tuik.gov.tr/medas/?kn=132&locale=en.
- TURKSTAT. Consumption Expenditure Statistics 2016b [cited 14.04.2016]. https://biruni.tuik.gov.tr/medas/?kn=132&locale=en.
- TURKSTAT. 2016c. Income Distribution and Living Conditions Statistics.
- TURKSTAT. 2017a. Distribution of cash and in kind social protection benefits by risks/needs groups, 2000-2016.
- TURKSTAT. Divorce Statistics, [20.04.2018] 2017b. Available from https://biruni.tuik.gov.tr/medas/?kn=111&locale=en.
- TURKSTAT. 2017c. General Level of Happiness in Percentage.
- TURKSTAT. Labour Force Statistics 2017d [cited 20.04.2018]. https://biruni.tuik.gov.tr/isgucuapp/isgucu.zul?dil=2.
- Ünal-Karagüven, M Hülya. 2009. “Psychological Impact of an Economic Crisis: A Conservation of Resources Approach.” International Journal of Stress Management 16 (3): 177. doi: 10.1037/a0016840
- WorldBank. 2017a. DataBank World Development Indicators Country Turkey 2017a [cited 20.06.2017]. http://databank.worldbank.org/data/reports.aspx?source=2&country=TUR.
- WorldBank. 2017b. Household final consumption expenditure, etc. (% of GDP) 2017b [cited 21.12.2017]. https://data.worldbank.org/indicator/NE.CON.PETC.ZS.
- Yazici, Berna. 2012. “The Return to the Family: Welfare, State, and Politics of the Family in Turkey.” Anthropological Quarterly, 85 (1): 103–140. doi: 10.1353/anq.2012.0013
- Yuksel, Canan, Harun Alp, Y. Soner Baskaya, and Mustafa Kılınc. 2011. “Türkiye için Hodrick-Prescott Filtresi Düzgünleştirme Parametresi Tahmini (Estimating Hodrick-Prescott Filter Smoothing Parameter for Turkey).” Central Bank of Turkey, Research Notes in Economics.
- Zellner, Arnold. 1962. “An Efficient Method of Estimating Seemingly Unrelated Regressions and Tests for Aggregation Bias.” Journal of the American Statistical Association 57 (298): 348–368. doi: 10.1080/01621459.1962.10480664
Appendix
Estimation procedure
The AIDS estimation is conducted by seemingly unrelated regression (SUR) proposed by Zellner (Citation1962). In STATA, SUR estimation is executed by sureg command. The command uses feasible generalized least-squares estimator and allows for iteration. The iterated feasible generalized least-squares estimator is a maximum likelihood estimator which is necessary due to singularity of AIDS. The singularity problem automatically occurs because of the additivity restriction, as stated by Poi (Citation2002). One of the routines to eliminate the singularity problem is arbitrarily dropping an equation and estimating the remaining equations. Dropping an equation arbitrarily from the system is expected to affect output obtained from estimations of the remaining equations. In order to prevent this, a maximum likelihood estimator is used.
The model is estimated with Laspeyres price index in order to overcome potential endogeneity problem as suggested by Buse (Citation1998). Also, the model is estimated by imposing homogeneity (absence of money illusion) and symmetry restrictions to eliminate potential bias which may occur because of expenditure endogeneity as suggested by Attfield (Citation1985).
STATA does not provide robust standard errors for sureg command; however, bootstrapping could overcome this. Bootstrapping resamples the observations and produces standard errors that are valid even for a relaxed homoscedasticity assumption. Finding the correct number of repetitions for bootstrapping is facilitated by STATA’s bssize command, as introduced in Poi (Citation2004). The bootstrapping is also used to calculate elasticities, similar to the AIDS estimation on Turkey that was conducted by Ardic, Erus, and Soydan (Citation2010).