
 ?Mathematical formulae have been encoded as MathML and are displayed in this HTML version using MathJax in order to improve their display. Uncheck the box to turn MathJax off. This feature requires Javascript. Click on a formula to zoom.
ABSTRACT
The purpose of this research is to evaluate the short-term impact and long-term sustainability of Kenya’s Hunger Safety Net Programme (HSNP). Difference-in-difference and propensity score matching estimations are used to determine the impact of program participation on the household Multidimensional Poverty Index (MPI). We found that program participation reduced the MPI significantly, which is mainly driven by the food insecurity dimension, and that the reduction in poverty is due to the reduction in the incidence and intensity, the latter in particular, of poverty among the ultra-poor households. Our analysis of the political economy of Kenya suggests that, while the government is making progress in the institutionalization of social protection, weaknesses in the implementation and financing of the program, as well as the short-term focus of impact evaluation, may undermine the program’s potential to help build a strong state that is accountable for the eradication of poverty.
1. Introduction
Poverty and food insecurity are of particular concern for the drought-prone regions of northern Kenya.Footnote1 Over 60% of the households there have been dependent on food aid for more than 10 years, yet malnutrition persists, at a staggering 30%, and appears to be deepening (Garcia and Moore Citation2012). Emergency food aid sometimes provides a temporary remedy but remains ineffective at combating chronic food insecurity (e.g. Barrett and Maxwell Citation2007). Kenya needs a development solution that not only reduces food insecurity in the short term, but also contributes to the eradication of poverty in the longer term.
Social protection programs that use antipoverty transfers have emerged as a viable solution for many developing countries facing similar issues. Advocates of social protection believe that regular and predictable income can reduce the need for emergency food aid and help the poor to manage recurring risks (Garcia and Moore Citation2012). A regular income stream can also address the credit constraints arising from market imperfections, by providing liquidity and income to rural households (Dercon Citation2002; Devereux et al. Citation2006; Hoddinott Citation2008). Further, recent literature suggests that social protection may be integral to adequate food consumption and to asset accumulation among poor people (Hidrobo et al. Citation2018), and to even economic development, considered by many researchers to be the holy grail of poverty reduction. Empirical studies of social protection programs such as Brazil’s Bolsa Familia and Mexico’s Oportunidades have demonstrated that it is indeed possible to reduce poverty through antipoverty transfers. In the aftermath of these pioneering programs, a whirlwind of social protection programs spread through developing countries in Latin America and sub-Saharan Africa in the fashion of a ‘quiet revolution’ (Barrientos and Hulme Citation2009). With the support of the UK’s Department for International Development (DFID), the Government of Kenya (GoK) began contemplating social protection and antipoverty transfers as a development solution to its multifaceted poverty problems.
The current study seeks to analyze the comprehensive impact of one such program – Kenya’s Hunger Safety Net Programme (HSNP). The HSNP is an unconditional cash transfer program designed to strengthen the livelihoods of extremely vulnerable populations in Kenya. The program focuses on the Arid and Semi-arid Land (ASAL) districts of Turkana, Mandera, Marsabit and Wajir, located in northern Kenya and identified by the 2005 Kenya Integrated Household Budget Survey (KIHBS) as the poorest districts in the country. The ASAL region is prone to drought and populated by historically marginalized households struggling with weak infrastructure and high rates of illiteracy (OPM Citation2011). The HSNP was initially designed as a GoK-led social protection program with the support of DFID, and later it was further supported by Australia’s Department for Foreign Affairs and Trade (DFAT). The idea is to deliver regular cash transfers instead of food aid, to help poor and vulnerable households to cover their basic expenses and avoid sinking further into poverty. Phase I ran from 2008 to 2013 as a pilot project and was followed by Phase II, from 2013 to 2017, during which the program was expanded. The present study focuses on evaluating the impact of the pilot phase (HSNP Citation2016).
While ample literature exists on social protection schemes and antipoverty transfers, the majority of these studies have approached impact assessment using a unidimensional variable, studying one outcome at a time, instead of examining the impact from a wider perspective. During the past decade, a growing collection of research has emerged around multidimensional poverty measures. One approach in particular – the Alkire and Foster (AF) method of calculating the Multidimensional Poverty Index (MPI) (Alkire and Foster Citation2011), based on Amartya Sen’s seminal work (Sen Citation1976) – has gained widespread international attention. To our knowledge, however, only a handful of impact evaluation studies have been carried out using the MPI, highlighting the need for further research on how the AF method and the MPI can be applied to this area of work. The present study differs from OPM’s (Citation2013) evaluation by investigating the program’s impact using the MPI, which is, arguably, more suited to analyzing multifaceted programs such as the HSNP, where multiple poverty reduction goals are identified as program objectives. We also employ a different estimation method, the propensity score matching (PSM) method, which is recommended for evaluating programs where participation is non-random (Khandker, Koolwal, and Samad Citation2009). Finally, we carry out a broader qualitative policy analysis for a comprehensive understanding of the program’s short-term impact and long-term sustainability.
The present study contributes not only to the literature evaluating the impact of social protection programs, but also to that on poverty as a multidimensional phenomenon. We will address the following research questions in this paper: (i) Does participation in the HSNP reduce the program-specific MPI? (ii) What are the political forces holders shaping the sustainability of the HSNP? (iii) What policy recommendations can be made to support the HSNP’s long-term sustainability?
The rest of the paper is structured as follows. Section 2 presents a review of key literature, including two existing impact evaluations that use the MPI, and a summary of the key social protection programs in the region, including the HSNP, and. In Section 3 we will present an overview of the HSNP household survey and detailed descriptions of the variables used in the present research. Section 3 also summarizes the methodological estimations used to evaluate the impact of MPI. Section 4 analyzes the results from the various estimation methods used in the impact evaluation. We also present findings from the decomposition of the MPI for a more granular understanding of the drivers of change. Section 5 consists of a policy analysis of the political economy in Kenya relevant to HSNP. This is followed by Section 6, a summary of our findings and policy recommendations. These might also be relevant to other developing countries interested in social protection via antipoverty transfers.
2. Review of the literature
In this section we will briefly examine the literature on social protection and the MPI, to provide a background for the present research on the HSNP. Contextual information about the HSNP will also be provided.
Since the early 1990s, an explosion of social protection programs has swept through the global South. Social transfers have grown eight-fold in the last two decades, particularly unconditional pensions and transfers based on human development criteria. It is estimated that 0.74–1 billion people around the world are now reached by social transfers, as of 2010 (Barrientos, Nino-Zarazua, and Maitrot Citation2010).
There has been a growing demand for evidence-based policy, which has given rise to impact evaluations (e.g. Fiszbein and Schady Citation2009; Gao, Garfinkel, and Zhai Citation2009; Kabeer and Waddington Citation2015; Skoufias Citation2005; Soares et al. Citation2006). Traditionally, impact evaluations are conducted using unidimensional outcome variables, such as income or consumption. Where development programs involve multiple objectives, they are normally evaluated through the analysis of a number of unidimensional outcomes one at a time to determine the impact of the program on individual outcomes, or sometimes these unidimensional outcomes can be aggregated into a single outcome variable. Yet there is now an increasing awareness that poverty is multidimensional – it can be characterized by food insecurity, poor education or healthcare, asset deprivation, and/or lack of employment opportunities. We propose to base our analysis on the MPI put forward by Alkire and Foster (Citation2011). Our study is among the first few papers that has used the MPI in impact evaluations. Robano and Smith (Citation2014) applied the MPI to BRAC’s Targeting the Ultra Poor (TUP) program in Bangladesh to determine the program impact and explore the possibility of using the MPI to fine-tune participant targeting. In the same vein, Tonmoy Islam has also investigated the impact of the TUP using various versions of the MPI (Tonmoy Islam Citation2014).
2.1. Background information about the HSNP
Kenya’s northern ASAL region suffers from the highest levels of poverty and the lowest access to public infrastructure in the country. According to the 2005/2006 KIHBS, about 85% of the ASAL population are living below the national poverty line. The increasingly frequent droughts contribute to chronic food insecurity and a rising incidence of conflicts caused by scarce resources (Campbell et al. Citation2009). As with food insecurity issues in Ethiopia, governments and donor agencies realized that ad hoc food aid was failing to address these chronic problems and that regular cash transfers might be a more effective way of helping vulnerable households develop resilience to shocks and escape poverty. Under the National Social Protection Policy, five cash transfer schemes were created, which include the HSNP, with the aim of creating ‘predictable funding for predictable needs’ (Ellis, Devereux, and White Citation2009, 16; quoted by Garcia and Moore Citation2012).
Under the HSNP, a bi-monthly cash transfer is sent directly to the beneficiaries’ bank accounts accessible with a biometric smartcards at local banks or at any ATM in the area.Footnote2 During Phase I, the pilot project, the transfer was fixed at 3500 Kenyan Shillings (KES) (approximately US$34) per household and covered 60,000 households (300,000 individuals) from about 2008 to 2013. During Phase II (2013 to 2017), the transfer was increased to KES 5400 per household (US$52) and was estimated to cover 100,000 households (720,000 individuals). The transfer was valued at about 75% of the food aid value, and covered roughly 40% of a household’s expenditure (HSNP Citation2016). Beneficiaries were also encouraged to spend the transfers productively, though compliance was neither mandatory nor monitored. An innovative humanitarian component allows the transfer to be scaled up to cover 302,000 households (2.7 million individuals) in times of crisis. During July and August 2011, transfers were in fact doubled in value to support households struggling against drought (OPM Citation2013). In 2015 the program was again scaled up four times to provide emergency cash transfers to an additional 207,000 households affected by drought (Fitzgibbon Citation2016).
Even though most of its funding comes from external donors, the HSNP is led by the GoK. It was initially financed solely by DFID, at an estimated cost of KES 5.5 billion during the pilot phase. For Phase II, the GoK committed KES 4.68 billion to the program, which accounted for 26% of the funding. DFAT also entered into a partnership with DFID and contributed KES 2 billion, approximately 11% of the funding, to the HSNP during Phase II (HSNP Citation2016).
An in-depth evaluation was conducted by OPM in 2013. This evaluation consisted of quantitative panel household surveys and qualitative research such as focus group discussions and community interviews. The HSNP was based on a multidimensional view of poverty and had a wide range of objectives. Its primary goals are threefold: (i) to increase consumption expenditure and reduce poverty; (ii) to reduce food insecurity and malnutrition; and (iii) to promote asset retention and accumulation. Secondary objectives include increased access to health and education services, improvement in livelihoods and savings, creation of a safety net to protect people from shocks, empowerment of women, and advancement of vulnerable populations such as elderly people and children. Other possible outcomes that are not intended include potential interference with local commodity pricing and informal transfer systems; changes to intra-household composition, migration and social dynamics; and potential welfare dependency (Merttens et al. Citation2013).
Merttens et al. (Citation2013) discovered that the pilot program had reduced poverty significantly: beneficiaries were 10% less likely to fall into the bottom national decile of wealth. HSNP beneficiaries also experienced significant improvements in food security: 87% of the households reported having more and/or larger meals, and there was an overall increase in expenditure on food. However, there was no significant increase in dietary diversity or improvement in child nutrition. There is some evidence that HSNP helped households retain livestock, though they do not seem to have accumulated non-livestock assets. The transfer also helped households to purchase consumable goods but did not increase the ownership of productive assets (Merttens et al. Citation2013).
In terms of secondary objectives, the impact evaluation found evidence that HSNP beneficiaries spent more on healthcare. While there was no significant impact on school attendance or the amount households spent on education, there was an improvement in the academic performance of beneficiary children, attributed to the potential psycho-social effects of the program.Footnote3 Beneficiary households were also 10% more likely to take out loans and 7% more likely to have savings, which suggests a positive impact as impoverished households tend to have few savings and limited access to formal lenders, owing to their lack of collateral. The program was also found to help households cope with external shocks by protecting them from having to sell their assets or reduce food consumption. While the program also helped to empower women, there is some evidence to suggest that, in doing so, it created intra-household tension and that many women did not have control over how the transfers were spent, despite being program beneficiaries. Children and elderly people and also showed no signs of improved well-being as a result of the transfer, except some minor improvement in children’s psycho-social well-being.
Evaluation of the unintended outcomes suggests that the program did not have a distorting effect on the local economy (i.e. commodity prices, inflation), which was to be expected given the modest scale of transfer and limited program coverage. Evaluation of the labor supply showed no sign of dependency on the transfers or loss of incentives to work. Analysis by different income quintiles revealed some impact heterogeneity across different segments of the sampled beneficiaries – smaller and poorer households tended to benefit the most from program participation, which can be explained by their comparatively higher per capita value, as the transfers are fixed per household.
3. Data and methodology
This section will provide an overview of the data and methodology used in the present study. To determine the most suitable analytical approach, we begin with a summary of the data collection process for the HSNP evaluation, focusing on program design and beneficiary targeting. This is followed by a description of the base model and definitions of the variables, including the construction of the MPI. The PSM DID method of estimation is chosen. This is because randomization between treatment and control groups was made at the level of sub-locations (cluster randomization), rather than at the level of individuals or households (simple randomization). While the former has been widely used in recent empirical research in economics, the limitations of cluster randomized controlled trials (e.g. Donner and Klar Citation2004) are not necessarily well recognized among economists. For example, if beneficiaries are selected after randomization of clusters/sub-locations has been carried out, it is difficult to guarantee blindness of beneficiaries to the intervention (Donner and Klar Citation2004, 420). Also, distributions of key variables in paired sub-locations may not be the same, because, for instance, of the existence of a few relatively rich or unusually poor households in one of the paired sub-locations, even if their averages are broadly similar. We have thus carried out PSM DID methods to make the control and treatment groups more strictly comparable by dropping outliers. In the meantime, we have also explored the simple DID method of estimation for comparison.
3.1. Description of survey
The pilot phase of the HSNP covered 150 out of 434 sub-locations in the ASAL region, with 48 sub-locations selected for evaluation. Twelve sub-locations were randomly selected from each of the four districts, stratified by population density and divided into groups of two. Each sub-location within the pair was then randomly allocated to either a treatment or a control group (Merttens et al. Citation2013).
Three types of targeting mechanism were implemented simultaneously in the selection of beneficiary households within the treatment sub-locations: community-based targeting (CBT), dependency ratio (DR) targeting and a social pension (SP) approach.Footnote4 In the CBT approach, the community determine the poorest households in up to 50% of the population. The DR approach targets households with vulnerable members (children, elderly people, and disabled or chronically ill people) irrespective of other factors (e.g. wealth). The SP approach selects any individual over 55 years old irrespective of other criteria. Households in the treatment group begin receiving transfers immediately, whereas households in the control group operate as counterfactuals throughout the duration of the pilot study, and only begin to receive transfers after two years. Fifty-one percent of the households in the treatment sub-locations, approximately 60,000 households in total, were selected to receive the bi-monthly cash transfer (OPM Citation2011). As discussed by Merttens et al. (Citation2013) and Hurrell and Sabates-Wheeler (Citation2013), the demographic characteristics of the treatment and control areas were broadly similar.
From the 48 sub-locations selected for evaluation, about 5280 households were randomly selected for an annual interview. presents the sample size by survey year and treatment status. The interviews were conducted in November 2009, before the transfer began, as the baseline, again in November 2010 as the mid-line, and finally upon conclusion of Phase I in November 2012 as end-line. The current study focuses on the baseline and end-line survey results (see Merttens et al. Citation2013 for more details).
Table 1. HSNP evaluation sample size by year and treatment status.
An attrition rate of 7.7% resulted at mid-line and a further 15.0% resulted at the end-line, leading to a general attrition rate of 21.6% between baseline and end-line. Attrition was mostly driven by households that could not be tracked in the second wave. It skewed towards the Mandera and Wajir districts as the share of migrant households is larger in these districts than elsewhere. However, the differential attrition is less than 0.5% between control and treatment groups, indicating that attrition is comparable across both groups. The present impact evaluation will focus on the 2436 households present during both baseline and end-line surveys, to ensure comparability.
Data from three rounds of HSNP surveys are housed in the World Bank’s Development Impact Evaluation catalog; they contain community-level and household-level responses as well as household demographics. These are the same data used by OPM in the formal impact evaluation of the HSNP pilot project. The present study is based on the 99 micro-data files from the 2009 and 2012 periods (i.e. excluding mid-line) as we focus on the eventual impact of the program.
3.2. Definition of variables
To evaluate the impact of program participation on poverty, first we examine the relationship between program status and the outcome variable, the MPI. The MPI is a customized measure constructed in accordance with the HSNP’s objectives and subsequently referred to as the HSNP MPI. Program status is a dummy variable, equal to one if the household is in the treatment group and zero if the household is in the control group. As the HSNP MPI is a measurement of the state of poverty, a negative value would indicate a reduction in poverty and hence success of the program. We would expect the HSNP MPI to be lower for program participants at the end-line than at the baseline (i.e. negative).
For further understanding of the effect of the program, we segment the households into ‘Poor’ and ‘Ultra-poor’, to explore the driving force behind the impact of the program. We would expect the reduction in the HSNP MPI to be greater for the ultra-poor segment than the poor segment if the impact heterogeneity identified by OPM holds.
Based on the existing impact evaluation literature and considerations of the HSNP’s targeting mechanisms, a range of demographic variables were chosen as baseline control variables. They include continuous variables such as household size (per adult equivalent)Footnote5 and age of the household head. Dummy variables, such as the gender of the household head, whether he/she is illiterateFootnote6 and his/her occupation are also included.Footnote7 These variables also serve as the observable characteristics used in the PSM method discussed later. They are considered exogenous to the outcome variable MPI.
We have extended our analysis to evaluate the impact of program participation on the global MPI – the original MPI produced by the Oxford Poverty and Human Development Initiative (OPHI). Unlike the HSNP MPI, the global MPI is constructed in accordance with OPHI guidelines, as available on the UNDP website (UNDP Citation2010). As the global MPI is composed of different indicators and published annually for over 100 developing countries, including Kenya, it allows us to determine the broader impact of participation in the HSNP on additional poverty dimensions, and enables us to make a direct comparison with the standardized global MPI measures available for Kenya at the national level. However, we expect the reduction of poverty to be relatively small for the global MPI, as many indicators within this MPI are subject to long-term influence (such as education and child nutrition), whereas the HSNP is designed to provide a short-term safety net.
3.3. Construction of the HSNP MPI
A key contribution of the current study is the use of the MPI as an outcome variable. As the HSNP is based on a multidimensional view of poverty, the construction of a single index to reflect the multiple deprivations faced at the same time by a given household should allow us to better understand the program’s impact on the interlocking dimensions of poverty. The current study follows the AF prescription in the construction of the HSNP MPI (Alkire and Foster Citation2011), which was also adopted by Robano and Smith (Citation2014). The AF method takes into consideration incidence (headcount) and severity (average poverty gap) for a more in-depth understanding of program impact. It also allows us to decompose poverty further into individual dimensions and indicators for a granular understanding of which dimension is the main driver of the overall impact.
To understand the value of the MPI, it is important to understand its construction process.
(1) Selection of dimensions
The global MPI (Alkire and Santos Citation2014) contains three dimensions for measuring poverty: education, health and standard of living. In the case of development programs, standardized MPI measures may not effectively capture the objectives relevant to the program. Hence, a customized measure is constructed to evaluate the impact of the HSNP according to the goals stated in its literature. Three dimensions are chosen to reflect the stated goals of the HSNP: poverty, food insecurity and asset accumulation.
(2) Selection of indicators
The 3 dimensions within the global MPI are composed of 10 indicators: the education dimension is split into years of schooling and school attendance. As child mortality and adult BMI are missing from the HSNP data, we excluded the health or nutrition indicator from the calculation of the global MPI. Though not perfect, the availability of 8 out of 10 indicators (2 out of 3 dimensions) more than meets the UNDP standard that ‘the MPI should not be calculated when all indicators within a dimension or when 50% or more out of the 10 indicators are missing’ (Kovacevic and Calderón Citation2014). Indicator and dimension weights were adjusted to account for the missing nutrition indicator.
For the HSNP MPI, indicators were selected to accurately and reflect the overall objective. In the poverty dimension, consumption is widely used to reflect welfare, as income is often deemed an inaccurate measurement of poverty in developing countries because it tends to fluctuate over the years. Thus, the ‘monthly household consumption expenditure (per adult equivalent)’ is chosen to capture the poverty dimension. As food security is a core focus for the HSNP, we included nine indicators for the food insecurity dimension. It contains nine binary variables, each assuming a value of one if the statement is true and zero otherwise.Footnote8 The asset accumulation dimension contains three indicators: livestock ownership, land ownership and asset ownership. The first and second indicators are binary variables which take a value of one if the household owns any livestock or land, and zero otherwise. The third indicator is also a binary variable, taking a value of one if the household owns no more than one of the following assets: radio, television, telephone, bicycle, motorcycle or refrigerator; additionally the household must also not be in possession of a car. If the household owns more than one of any of the above then the variable assumes a value of zero.
(3) Determination and application of the poverty threshold
For the calculation of the global MPI, the poverty thresholds established for its indicators are selected from national poverty definitions or based on internationally agreed development standards, such as the targets of the Millennium Development Goals. For example, a child is considered malnourished if their anthropometrics are below the World Health Organization’s underweight/stunting/wasting definitions for children of their age (Alkire, Conconi, and Seth Citation2014). For the HSNP MPI, we adopt a similar approach where relevant (for example, asset ownership, an indicator available in both the HSNP MPI and the global MPI, follows the standards established by OPHI). Each household is then assessed against the respective threshold, z, to determine whether it is deprived in each indicator.
As mentioned earlier, following the OPHI standard, we have excluded the nutrition dimension from the global MPI. Also, weights for the remaining indicators are adjusted following the UNDP recommendation (UNDP Citation2010). lists the definitions and origins of poverty thresholds for the HSNP MPI. The HSNP MPI consists of three dimensions, that is, consumption poverty with weight 1/3 (based on monthly household consumption expenditure, per adult equivalent), food insecurity with weight 1/3 (based on nine indicators reflecting household food consumption, with individual weight of 1/27), and asset poverty with weight 1/3 (based on three indicators of ownership of livestock, land and assets, with individual weight of 1/9).
Table 2. HSNP MPI framework.
3.4. Empirical methodology
For both the global MPI and the HSNP MPI, we first apply the DID method to the baseline and the end-line data. The DID method estimates the average treatment effect on the treated (ATT) by comparing the change in the outcomes between the treatment and control groups, before and after the treatment (Khandker, Koolwal, and Samad Citation2009). The equation below describes the DID estimation method:where DID is the differential effect in the ATT between the treatment group
and its counterfactual
.
The conditions required for unbiased DID estimation are that the model should be correctly specified, and that the error term should be uncorrelated with other variables (Khandker, Koolwal, and Samad Citation2009). As mentioned previously, there are endogenous variables which could potentially impact the outcome variable (the MPI), such as whether the HSNP beneficiaries also receive food aid or other cash transfers, or whether they are participating in employment programs. To satisfy the conditions for DID, the present study will exclude the aforementioned endogenous covariates in the estimation. We will compare and contrast three scenarios under the DID estimation method: (i) the DID – the basic model without any covariates; (ii) the DID with only exogenous variables as covariates; and (iii) the DID with PSM so that the households in the treatment group can be made comparable and observationally similar to those in the control group.
PSM estimates a composite of these characteristics into a scalar value – a propensity score – and matches households based on individual propensity score for a reconstructed panel of control versus treatment groups (Rosenbaum and Rubin Citation1983). This reconstruction process also makes it an effective corrective mechanism against panel attrition (and as we recall the overall attrition from baseline to end-line is 21.6%). Reconstructing the panel data based on PSM ensures that the new control and treatment groups are broadly comparable. In addition to addressing the selection bias and attrition, matching is also useful when there is a high occurrence of exclusion or inclusion error in the targeting process; i.e. households receiving transfers when they are not eligible, or households that are eligible not being selected to receive transfers. The HSNP had an overall inclusion error of 11% and exclusion error of 46%. As the program coverage is not universal, the high level of exclusion error can be partially attributed to the scale of the funding. However, the relatively high level of inclusion error gives justification to PSM estimation (OPM Citation2011).
We use a probit model to estimate the propensity scores to match treatment households (with access to the HSNP) and control groups (without access to the HSNP) for each round of the panel data. The sample size is large and comparable between the control and treatment groups, which is ideal for a robust matching. The region of common support has been defined to drop the observations that are not comparable with each other. Here the region of common support is defined for the baseline HSNP in [0.30392162, 0.78421257], and in [0.45099445, 0.61595476] for the end-line, where the numbers show the propensity score, or the probability of a household accessing the HSNP. Outside of the region 2437 observations were dropped, 2436 of which were 2009 participants who later were not selected for inclusion in the HSNP. The means of the covariates in the estimated propensity scores satisfy the balancing property, indicating that treatment and control groups are statistically comparable.Footnote9 We then applied DID for the reconstructed panel.
4. Results
reports the results of DID estimations for four models: (I) the basic DID model estimating the impact of program participation on the HSNP MPI; (II) an augmentation of the basic DID model, controlling for various exogenous covariates and applied to the HSNP MPI; (III) an extension of the above with PSM applied to the HSNP MPI and (IV) same as (II) but applied to the global MPI.
Table 3. Impact of HSNP participation on the HSNP MPI and the global MPI.
In Model I, the DID estimation of the HSNP MPI between the control and treatment households is negative and significant at the 1% level. One can expect a reduction of 0.046 in the MPI, between the end-line differential and baseline differential for the treatment and control groups.
Both groups saw poverty reduced since the baseline survey, although the improvement was more pronounced for the treatment group than the control group, resulting in a statistically significant difference between both groups at end-line. Approximately 22% of the variability can be explained by Model I.
Model II shows the result of DID for the HSNP MPI based on the reconstructed PSM panel. As a majority of the dropped observations were due to ‘intended’ exclusion, with only two observations dropped due to incomparability, we did not expect significantly different results from the two models. Results from both models indeed bear close resemblance, excepting a slightly higher significance level for baseline and end-line in Model II, implying enhanced comparability between the treatment and control groups in the reconstructed panel, although this is slight, given that only two observations were dropped from the otherwise strongly balanced panels. A reduction of 0.047 in the HSNP MPI can be expected from program participation, driven by significant end-line differences between the treatment and control groups.
Model III extends Model II by including the same set of covariates as in Model II. We would expect this to be a robust model, given that it controls for any selection bias resulting from the non-randomized HSNP design. Interestingly, the HSNP MPI dropped proportionally for both groups once covariates were controlled for. A reduction of 0.048 can be expected from program participation, an improvement from Model I. R-squared also increased from 0.22 to 0.23.
Overall, the various estimation methods and models depict a consistent story: that program participation is effective in reducing the HSNP MPI. Our preferred specification is Model III, DID with PSM where covariates are taken into account.
As an extension, we have constructed the global GDI as a weighted sum of education (schooling years and attendance) (1/2) and living standards (e.g. assets) (1/2) as we do not have the data for adult BMI and child mortality necessary for constructing the health dimension in the global GDI. In Model IV, DID shows that the HSNP has no significant effect on the global GDI. This is primarily because education and assets are long-term measures of poverty and not responsive to the short-term transfer.
Finally, we have decomposed the HSNP MPI into its individual components to identify the key contributor of change, as well as to examine impact in the two poverty segments (poor and ultra-poor). The HSNP MPI reflects both the incidence and the intensity of poverty. Incidence is measured by a headcount and represents the share of people in poverty. and and illustrate the change in incidence and intensity and the aggregate of the HSNP MPI over time, across different poverty segments in the treatment and control groups. At baseline, incidence is comparable between the treatment and control groups in both segments. The ultra-poor segment accounts for the lion’s share in the total households within both the treatment and the control groups. At end-line, poverty among the ultra-poor population declined substantially in the treatment group. The MPI in the treatment group is also 0.032 points lower than the control group. Corresponding to the sharp decline in the ultra-poor segment, the poor segment grew as a result of households shifting out of the ultra-poor segment. Poverty headcount actually worsened for the poor treatment group segment at end-line, as can be seen in the 0.090 points difference between baseline and end-line. Segmentation of the incidence measure suggests that the reduction in multidimensional poverty headcount is driven by an improvement in the lives of the poorest people.
Figure 1. Incidence of multidimensional poverty by year and poverty segment (HSNP MPI).
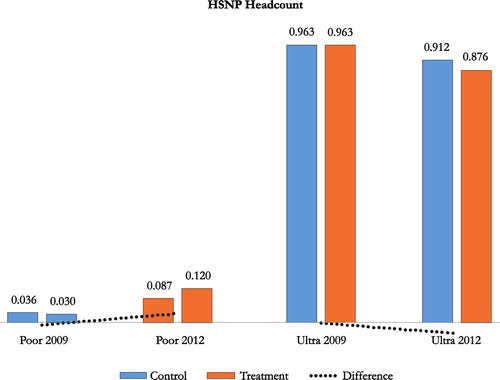
Figure 2. Intensity of multidimensional poverty by year and poverty segment (HSNP MPI).
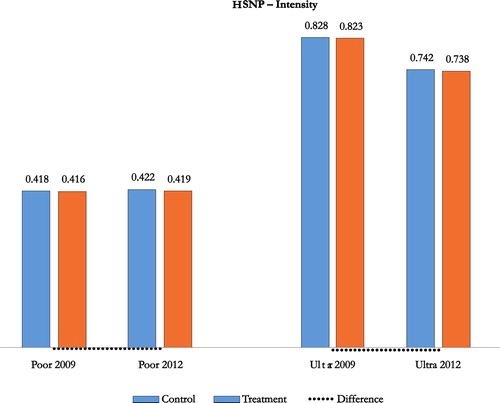
Table 4. Impact heterogeneity analysis.
measures the intensity of multidimensional poverty and represents the degree to which households are deprived. A closer examination of the intensity measures has revealed a consistent pattern from baseline to end-line. The degree of deprivation remained fairly stable across the treatment and control groups for the poor segment. However the ultra-poor segment witnessed the largest drop in poverty intensity between baseline and end-line. Taking the above into consideration, we can conclude that the impact of the HSNP on poverty reduction is driven by the decline in the incidence and intensity of poverty among the ultra-poor households.
It can be argued that there is some evidence to support impact heterogeneity. We can expect ultra-poor households participating in the program to reduce the MPI by 0.146 points, while the poor households actually see a small increase of 0.037. The heterogenous impact is consistent with findings from OPM on the HSNP, and with findings from evaluations of other antipoverty transfer programs.
Interestingly, it can be gleaned from these results that although the MPI dropped substantially between the baseline and the end-line, the difference in the MPI between the treatment and control groups is less sizeable. Policy makers and practitioners thus should keep paying attention to the long-term impact of the HSNP on the MPI because the short-term program effect on the MPI is likely to be small in our study context.Footnote10 The MPI analysis leads to the interesting observation that there appear to be macro-factors driving significant poverty reduction across both groups outside the immediate program impact (this was not captured in the DID model used by OPM, as the DID approach focuses specifically on the program before versus after, and treatment versus control). We believe this is driven by an improvement in the macroeconomic conditions in Kenya during the pilot program. GDP growth in Kenya quickly recovered from the 2008 global financial crisis and grew considerably in 2010 and 2011. This finding contradicts the assertion that the MPI is static across time and overlooks macro-factors, which perhaps holds true for the global MPI, but in the case of the HSNP in Kenya, the substantial MPI reduction over time yet marginal reduction between treatment and control groups implies that forces bigger than the immediate program may have driven poverty reduction among the sampled households. This supports the general view that 70% of the poverty reduction is due to economic growth and 30% to antipoverty transfers (Barrientos Citation2016). Hence, it is worth bearing in mind the broader context when the scale of impact for antipoverty transfers is evaluated.
In this section we have analyzed the impact of participation in the HSNP on the HSNP MPI using DID and PSM DID estimations. Results from various models predicted MPI reduction ranging from 0.046 to 0.048 as a result of the cash transfer. Decomposition and segmentation of the MPI showed that the poverty reduction was driven by the ultra-poor segment. These findings clearly demonstrate the efficacy of the HSNP in reducing poverty, which builds the case for the continuation and expansion of the program. However, the program is more effective at helping certain segments of the population. A potential implication is to focus future program efforts on the ultra-poor segment, which could be achieved by changing the targeting mechanism from a poverty cutoff approach to a poverty-ranking approach, and to increase coverage for the households at the bottom of the ranking. In addition to program recommendations, we will review the political economy of Kenya in the next section and include further policy recommendations which would support the long-term sustainability of the program.
Finally, we have carried out the DID for the respective unidimensional poverty indices. The treatment group fared significantly better at end-line than the control group across all three dimensions, and the result was particularly visible for the poverty dimension. However, the DID estimation is only significant for food insecurity. By participating in the HSNP, beneficiaries can expect a 0.015 reduction in food insecurity, significant at the 1% level. There was no statistically significant effect on consumption poverty or asset poverty.
5. Policy analysis
As can be seen in the impact evaluation, the HSNP significantly reduces multidimensional poverty and is found to be effective in improving food security. This section attempts to place our findings in a broader policy context. The success of the program can be attributed to the rigorous design and knowledgeable implementation carried out by a network of stakeholders. However, in the long run, the program needs to be sustainable in order to justify the considerable costs incurred for establishing and maintaining it. For a development project to have lasting benefits and contribute to poverty alleviation, it must have local support and be operationally and financially viable. While major donors and bilateral aid agencies alike are placing increasing emphasis on sustainability in the projects they support, this can be difficult to achieve, owing to the many political factors that are not always within the control of the project managers. It is therefore recommended for the sector to combine short-term, context-specific impact evaluations with broader policy analysis, to fully determine the drivers of potential change and the long-term viability of the project. This section seeks to dissect the political environment which enabled the conception and expansion of the HSNP.
While strong advocacy and good design may have helped the HSNP come into being, plentiful empirical evidence in favor of antipoverty transfers existed long before Kenya adopted it. Therefore, this raises the question: what was the political environment in Kenya like when the HSNP was accepted?
Social protection existed in Kenya traditionally in the form of informal assistance from family and community. Contributory assistance such as pensions or health insurance remains relatively low as the majority of the population works in the informal sector (ESRC Citation2014). As social protection programs spread through Africa, Kenya experimented with them through the Cash Transfer to Orphans and Vulnerable Children (OVC-CT) program. The pilot was deemed hugely successful and was expanded in 2006 and again in 2008, with additional expansions in the plan (Ward et al. Citation2011). The success of this program established a receptive climate for the HSNP. Armed with the endorsement of the African Union and the World Bank, and buoyed up by its success with the OVC-CT program, the GoK was ready to embark upon another social protection program and the political environment was ripe for it.
All it took then was a policy window in which the conversation could take place, and funding to kick-start the program.
Historically Kenya had suffered frequent conflicts caused by ethnic rivalry over territories and resources. The 2003 election opened the development space for the expansion of existing social protection programs, as the new government’s poverty reduction pledges and development targets had been met by the time of the election. A few years later, in 2007, crisis erupted after the alleged electoral manipulation which placed incumbent president, Mwai Kibaki, in power. Protests from opposition supporters were met with counter-protests and police intervention. Violence quickly escalated and it was estimated that up to 1500 people died and over 600,000 people were displaced from their homes. The incidents also led to the Kenyan police force to target certain ethnic communities. Donors and the development community were shocked by the election violence. The US, UK and European Commission threatened to withdraw aid in condemnation of the human rights abuses committed by the GoK (BBC Citation2018; ICRP Citation2014). This placed the GoK under considerable pressure to re-establish legitimacy among the people. Antipoverty transfers are an ideal instrument during such turbulent times. They also signal to the international community that the GoK is accountable for the well-being of its citizens and committed to institutionalizing social protection. Furthermore, they serve as an externally financed patronage resource that can be used to drum up constituency support.
There is also the issue related to DFID’s development agenda and the GoK’s lack of resources. In late 2007 DFID entered into a bilateral agreement with the GoK that was to see a transfer of £80 million of development aid to Kenya over the next 10 years. Shortly afterwards, in 2009, DFID identified social protection as a key focus area and declared as one of its organizational targets ‘to help build social protection programmes to get help to 50 million people in 20 countries over the next three years’ (IDC Citation2010, 25).
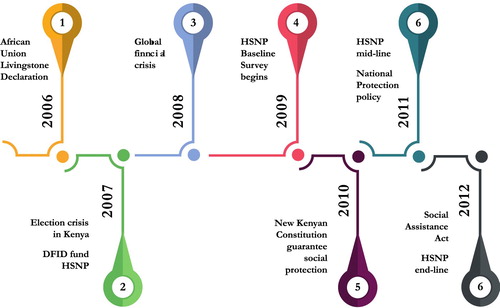
Over the course of the next few years, social protection advanced rapidly. In 2010, Kenya passed a new constitution, which for the first time formally guaranteed social protection as a fundamental right to its citizens, under Article 43, and Articles 53–57 (GoK Citation2010). In 2011, Kenya developed its National Social Protection Policy, which attempts to synchronize different social protection programs managed by multiple agencies into a coordinated system managed by the National Social Protection Secretariat, housed in the Ministry of Labour, Social Security and Services. The National Social Protection Policy was followed by the 2012 Social Assistance Act, which provides non-contributory social assistance to vulnerable citizens. The National Safety Net Programme was then created, which encompasses five cash transfer programs, including the OVC-CT and the HSNP (ESRC Citation2014). A diagram of the political events leading up to and taking place during the HSNP pilot is presented in .
Figure 3. Political timeline in Kenya, 2006–2010.
6. Conclusion
Impact evaluation is a crucial component of forming evidence-based development policies. The current research set out to evaluate the impact of Kenya’s HSNP on multidimensional poverty, and to identify the driving forces in that process. Using longitudinal baseline and follow-up surveys conducted for HSNP evaluation, we constructed an MPI that corresponded to the HSNP’s primary objectives, and analyzed the impact of program participation on the MPI in a series of econometric models. We used the simple DID model to estimate the ATT, and compared it with DID models controlling for covariates (household size, age and gender of household head, occupation of household head and whether he/she was illiterate) and attrition. We also conducted PSM to mitigate the selection bias that could arise in cluster randomized control trials applied to geographical units. Results from all the models showed a unanimously negative and statistically significant relationship between program participation and reduction of multidimensional poverty. Beneficiaries experienced a reduction in the MPI ranging from 0.046 to 0.048, implying that the program is successful at reducing poverty.
Furthermore, we decomposed the MPI into its respective components of poverty incidence and intensity, and examined these across the multidimensionally poor households and ultra-poor households. We discovered that the decline in poverty among the ultra-poor households accounts for most of the impact. Our research observed impact heterogeneity in that the ultra-poor households benefited significantly more from program participation that the poor and non-poor households. Taken together, these results suggest that the HSNP is successful at poverty reduction, although it could be fine-tuned to focus the finite development resources on the ultra-poor segment.
Results from the impact evaluation and policy analysis of the HSNP offer valuable insights to other developing countries interested in social protection programs. As evidenced by the current paper and prevailing consensus from existing literature, social protection in the form of cash transfer programs can successfully reduce multidimensional poverty. The manner in which social protection transfers quickly spread across Latin America and sub-Saharan Africa reflects the growing prevalence of evidence-based policy and the power of development research. Impact evaluations of pilot projects successfully overcame reluctance from elites and generated domestic demand, thus paving the way for sustainable social protection initiatives. Additionally, Kenya’s HSNP highlighted the determining role that the political economy plays in the conception and sustainment of development programs. The academic community’s research and the African Union’s endorsement of social protection were crucial in garnering domestic support in Kenya. Furthermore, implementation would not have been possible without DFID’s financial commitment and its well-coordinated network of experts. Consequently, continued international endorsement as well as DFID’s support are crucial for the program’s sustainability in the medium term. Current international focus on social protection is likely to continue, as evidenced in Sustainable Development Goal 1, Target 3, ‘Implement nationally appropriate social protection systems and measures for all, including floors, and by 2030 achieve substantial coverage of the poor and the vulnerable’. In the long term, knowledge transfer and institutionalization are critical to ensure that effective social protection programs have a home in the legislature and government budget and remain at the top of the national agenda.
The GoK is making exemplary strides towards the institutionalization of social protection, evidenced by its constitutional recognition and the creation of social protection ministries. In the short term, institutionalization has the benefit of enhancing the efficient coordination of social protection programs, which can lead to cost savings and lends further legitimacy to the programs, as well as reaffirming the state’s interest in providing for its vulnerable citizens. In the long term, institutionalization reinforces the longevity of the program itself, and has the potential to transform short-term projects into long-term institutions capable of poverty eradication (Barrientos Citation2013).
If we look beyond the impact evaluation results and assess the HSNP’s merit from a long-term perspective, we can see that it still faces considerable challenges. First of all, the majority of the funding for the HSNP still resides outside the GoK. Despite formal endorsement and pledges of support, there remains limited engagement from the government to date, partially driven by the limited electoral dividends offered by these marginalized northern districts. The mobilization of domestic finances to cover social protection programs such as the HSNP is not yet in place, which will be a major challenge to the program’s sustainability once the donor support concludes.
As it were, externally financed development programs are neither uncommon, nor to be interpreted as a weakness in state commitment; rather they are most likely a result of budget constraints due to the low revenue-generation capacity in developing countries. However, we must also bear in mind that foreign aid priorities and capabilities change. Reliance on external funding also weakens the legitimacy of the program and undermines the social contract between the state and its citizens. Therefore, transfer financing needs to be gradually shifted from foreign aid to domestic taxation to safeguard against future uncertainty. This is a key difference between the more successful social protection programs in Latin America and those in sub-Saharan Africa (Barrientos Citation2013). There are some challenges to bear in mind with this approach: income taxes are low in developing countries such as Kenya, where the majority of the population works in the informal economy; consumption tax however, is regressive in that it is increasingly burdensome for the poor. As it seems, the right financing will be a mixture of foreign aid, resource revenue and domestic taxation.
Acknowledgements
The authors would like to thank Bilal Malaeb, Subhasish Dey, Doug Gollin, Fred Merttens, Pedro Rosa Dias, Andy McKay, Osman Ouattara, Armando Barrientos and participants in two workshops at OPHI, Oxford, in December 2016 and March 2018 for providing valuable comments. As usual, responsibility for any errors remains the authors.
Disclosure statement
No potential conflict of interest was reported by the authors.
ORCID
Katsushi S. Imai http://orcid.org/0000-0001-7989-8914
Notes
1 In 2005, 45.9% of the Kenyan population suffered from poverty, based on the international poverty headcount ratio at $1.90 a day (2011 PPP) (World Bank Citation2016). More recent statistics on income poverty are unavailable, which will justify our investigation of the MPI based on more recent data.
2 See the website of HSNP (http://www.hsnp.or.ke/index.php/component/content/article?id=49) for more details of how cash is delivered.
3 The authors postulated that beneficiary children could potentially experience psycho-social effects, as they were feeling better from being better fed and clothed as a result of receiving the transfer.
4 It would be useful to make comparisons among the three groups, but because of the small sample size as a result of sub-grouping, we have aggregated them into one group.
5 Children under 15 years of age are counted as three-quarters of an adult, while household members over 15 years of age are counted as an adult and take a value of one.
6 An individual is considered illiterate if he/she cannot write a simple letter.
7 Occupation is split into Working or Not-working based on various classifications, including herding, farming, collecting bush products, being self-employed, doing paid work (including casual labor), helping in the family business, doing unpaid domestic work, doing other unpaid work, such as unpaid work at nursery, not working (too old, unable or no opportunity), no specific duties, fishing and other.
8 The nine indicators for the food insecurity dimension are based on these questions: ‘During worst period, did the household members go an entire day without eating?’, ‘In the past seven days, did your household eat smaller meals than you would have liked?’, ‘Did you buy food on credit from a shop?’, ‘Did you sell any other assets in order to buy food?’, ‘Did you borrow food or rely on help from family or relatives (other than the main provider) to buy food?’, ‘Did you collect and eat wild food and/or animals?’, ‘Did you sell any of your animals to buy food?’, ‘Did you reduce the number of meals you eat?’, ‘Did you skip entire days without eating solids?’.
9 The results of the PSM are available on request.
10 Our results are in sharp contrast with the findings of a few recent papers that have evaluated the social protection or anti-poverty programs on the MPI elsewhere. For instance, Tutor and Seth (Citation2018) have examined the effects of the Philippine Conditional Cash Transfer Program (Pantawid Pamilya) on the MPI by applying the regression discontinuity design to the household data in 2011 and 2013 and have found that the MPI defined over education and health significantly reduced by 0.16–0.18 points. Also, based on the randomised control trials to evaluate the effect of savings incentive programs on the MPI in rural Uganda, Wang et al. (Citation2018) have found that the MPI defined in health, assets, housing and risk factors significantly reduced by more than 0.10 points. These results, however, are not comparable to ours as the definitions of the MPI and the study settings are different.
References
- Alkire, S., A. Conconi, and S. Seth. 2014. “Multidimensional Poverty Index 2014: Brief Methodological Note.” Draft, OPHI, University of Oxford.
- Alkire, S., and J. Foster. 2011. “Counting and Multidimensional Poverty Measurement.” Journal of Public Economics 95 (7–8): 476–487. doi: 10.1016/j.jpubeco.2010.11.006
- Alkire, S., and M. E. Santos. 2014. “Measuring Acute Poverty in the Developing World: Robustness and Scope of the Multidimensional Poverty Index.” World Development 59: 251–274. doi: 10.1016/j.worlddev.2014.01.026
- Barrett, C. B., and D. Maxwell. 2007. Food Aid After Fifty Years: Recasting its Role. Abingdon: Routledge.
- Barrientos, A. 2013. Social Assistance in Developing Countries. Cambridge: Cambridge University Press.
- Barrientos, A. 2016. “Monitoring and Evaluation of Antipoverty Transfers.” IDPM (Institute for Development Policy and Management) 61512 Antipoverty Transfer, Mimeo.
- Barrientos, A., and D. Hulme. 2009. “Social Protection for the Poor and Poorest in Developing Countries: Reflections on a Quiet Revolution.” Oxford Development Studies 37 (4): 439–456. doi: 10.1080/13600810903305257
- Barrientos, A., M. Nino-Zarazua, and M. Maitrot. 2010. “Social Assistance in Developing Countries Database: Version 5.0.” Brooks World Poverty Institute, University of Manchester.
- BBC. 2018. “Kenya Profile – Timeline.” Last Accessed February 20, 2018. http://www.bbc.co.uk/news/world-africa-13682176.
- Campbell, I., S. Dalrymple, R. Craig, and A. Crawford. 2009. “Climate Change and Conflict: Lessons From Community Conservancies in Northern Kenya.” Last Accessed February 20, 2018. http://www.iisd.org/sites/default/files/publications/climate_change_conflict_kenya.pdf.
- Dercon, S. 2002. “Income Risk, Coping Strategies, and Safety Nets.” The World Bank Research Observer 17: 141–166. doi: 10.1093/wbro/17.2.141
- Devereux, S., R. Sabates-Wheeler, M. Tefera, and H. Taye. 2006. “Ethiopia’s Productive Safety Net Program (PSNP): Trends in PSNP Transfer within Targeted Households (Final Report).” Institute of Development Studies. https://www.ids.ac.uk/files/PSNPEthiopia.pdf.
- Donner, A., and N. Klar. 2004. “Pitfalls of and Controversies in Cluster Randomization Trials.” American Journal of Public Health 94 (3): 416–422. doi: 10.2105/AJPH.94.3.416
- Ellis, F., S. Devereux, and P. White. 2009. Social Protection in Africa. Cheltenham: Edward Elgar.
- ESRC (Economic & Social Rights Centre – Hakijamii). 2014. “State of social protection in Kenya.” Last Accessed April 6, 2016. http://www.hakijamii.com/.
- Fiszbein, A., and N. Schady. 2009. Conditional Cash Transfers: Reducing Present and Future Poverty. Washington, DC: World Bank.
- Fitzgibbon, C. 2016. “Shock-Responsive Social Protection in Practice: Kenya’s Experience in Scaling Up Cash Transfers.” ODI-HPN. https://odihpn.org/blog/shock-responsive-social-protection-in-practice-kenyas-experience-in-scaling-up-cash-transfers/.
- Gao, Q., I. Garfinkel, and F. Zhai. 2009. “Anti-poverty Effectiveness of the Minimum Living Assistance Policy in Urban China.” Review of Income and Wealth 55: 630–655. doi: 10.1111/j.1475-4991.2009.00334.x
- Garcia, M., and C. Moore. 2012. The Cash Dividend: The Rise of Cash Transfer Programs in Sub-Saharan Africa. Washington, DC: World Bank.
- GoK (Government of Kenya). 2010. Constitution of Kenya. Nairobi: Government of Kenya.
- Hidrobo, M., J. Hoddinott, N. Kumar, and M. Olivier. 2018. “Social Protection, Food Security, and Asset Formation.” World Development 101: 88–103. doi: 10.1016/j.worlddev.2017.08.014
- Hoddinott, J. 2008. “Social Safety Nets and Productivity Enhancing Investments in Agriculture.” January 18. SSRN. https://ssrn.com/abstract=1661284 or http://dx.doi.org/10.2139/ssrn.1661284.
- HSNP. 2016. “Home.” Last Accessed April 3, 2016. http://www.hsnp.or.ke/.
- Hurrell, A., and R. Sabates-Wheeler. 2013. Kenya Hunger Safety Net Programme Monitoring and Evaluation Component: Qualitative Impact Evaluation Final Report: 2009–2012. Oxford: Oxford Policy Management.
- ICRP (International Coalition for the Responsibility to Protect). 2014. “The Crisis in Kenya.” Last Accessed April 30, 2016. http://www.responsibilitytoprotect.org.
- IDC (International Development Committee). 2010. DFID’s Performance in 2008–09 and the 2009 White Paper: Fourth Report of Session 2009–10: V. 1: Report, Together with Formal Minutes. London: Stationery Office/Tso.
- IDS. 2015. “Kenya Hunger Safety Net Programme.” Last Accessed April 13, 2016. http://www.ids.ac.uk/project/kenya-hunger-safety-net-programme.
- Kabeer, N., and H. Waddington. 2015. “Economic Impacts of Conditional Cash Transfer Programmes: A Systematic Review and Meta-Analysis.” Journal of Development Effectiveness 7 (3): 290–303. doi: 10.1080/19439342.2015.1068833
- Khandker, S. R., G. B. Koolwal, and H. A. Samad. 2009. Handbook on Impact Evaluation: Quantitative Methods and Practices. Washington, DC: World Bank.
- Kovacevic, M., and M. C. Calderón. 2014. UNDP’s Multidimensional Poverty Index: 2014 Specifications. UNDP Human Development Report Office Occasional Paper. New York: United Nations Development Programme.
- Merttens, F., A. Hurrell, M. Marzi, R. Attah, and M. Farhat. 2013. “Kenya Safety Net Programme Monitoring and Evaluation Component.” Last Accessed April 5, 2016. http://www.hsnp.or.ke/filedownload.php?download_file=hsnp_impact_quantitative_evaluation_report2009_2013.pdf.
- OPM. 2013. “The Impact of the Kenya Cash Transfer Program for Orphans and Vulnerable Children on Household Spending.” Last Accessed August 22, 2016. http://www.opml.co.uk/publications/impact-kenya-cash-transfer-program-orphans-and-vulnerable-children-household-spending.
- OPM (Oxford Policy Management). 2011. “HSNP Targeting Effectiveness Evaluation Report.” Last Accessed July 27, 2016. http://www.opml.co.uk/publications/kenya-hsnp-monitoring-and-evaluation-component-targeting-effectiveness-evaluation.
- Robano, V., and S. Smith. 2014. “Multidimensional Targeting and Evaluation: A General Framework with an Application to a Poverty Program in Bangladesh.” OPHI Working Paper. Last Accessed July 6, 2016. http://www.ophi.org.uk/wp-content/uploads/OPHIWP065.pdf.
- Rosenbaum, P. R., and D. B. Rubin. 1983. “The Central Role of the Propensity Score in Observational Studies for Causal Effects.” Biometrika 70 (1): 41–55. doi: 10.1093/biomet/70.1.41
- Sen, A. 1976. “Poverty: an Ordinal Approach to Measurement.” Econometrica 44: 219–231. doi: 10.2307/1912718
- Skoufias, E. 2005. Progresa and Its Impacts on the Welfare of Rural Households in Mexico. IFPRI Research Report 139. Washington, DC: International Food Policy Research Institute.
- Soares, F. V., S. S. Soares, M. M. Sousa, and R. G. Osório. 2006. Cash Transfer Programmes in Brazil: Impacts on Inequality and Poverty. Working Paper 21. Brasilia: International Poverty Centre.
- Tonmoy Islam, T. M. 2014. “An Exercise to Evaluate an Anti-Poverty Program with Multiple Outcomes Using Program Evaluation.” Economics Letters 122 (2): 365–369. doi: 10.1016/j.econlet.2013.12.032
- Tutor, M., and S. Seth. 2018. “Evaluating the Impact of Philippine Conditional Cash Transfer Program on Multidimensional Poverty.” A Mimeo. Presented at Multidimensional Impact Evaluation Workshop, OPHI, The University of Oxford, March 1–3.
- UNDP. 2010. The Real Wealth of Nations: Pathways to Human Development. New York: UNDP.
- Wang, J. S., F. Ssewamala, B. Malaeb, T. Neilands, I. Garfinkel, J. Waldfogel, and J. Brooks-Gunn. 2018. “Effects of a Multifaceted Economic Empowering Intervention and Savings Incentives on Long-term Multidimensional Poverty Among Orphan Youths in Rural Uganda.” A Mimeo. Presented at Multidimensional Impact Evaluation Workshop, OPHI, The University of Oxford, March 1–3.
- Ward, P., A. Hurrell, A. Visram, N. Riemenschneider, L. Pellerano, C. O’Brien, I. MacAuslan, and J. Willis. 2011. “Kenya: Cash Transfer Programme for Orphans and Vulnerable Children (CT-OVC), Kenya: Operational and Impact Evaluation, 2007–2009.” Last Accessed August 17, 2016. http://www.unicef.org/evaldatabase/index_60321.html.
- World Bank. 2016. World Development Indicators 2016. Washington, DC: World Bank. Last Accessed April 8, 2016. http://data.worldbank.org/data-catalog/world-development-indicators.